
Quantum dots (QDs) are one of the most important nanostructures due to their unique properties and applications in a wide range of novel devices. Reference Semonin, Luther, Choi, Chen, Gao, Nozik and Beard1,Reference Lee, Ku, Barve, Montoya, Jang, Brueck, Sundaram, Reisinger, Krishna and Noh2 Since the discovery of QDs, they have been applied to quantum devices, Reference Zhang, Huo, Rastelli, Zopf, Höfer, Chen, Ding and Schmidt3 solar cells, Reference Wu, Yu, Susha, Sablon, Chen, Zhou, Li, Ji, Niu and Govorov4 lasers, Reference Tatebayashi, Kako, Ho, Ota, Iwamoto and Arakawa5 and photodetectors. Reference Wu, Shao, Dorogan, Li, Li, Decuir, Manasreh, Wang, Mazur and Salamo6 Fabrication of QDs with user-specified properties is desired for many different applications. For example, a high density of QDs is desired for solar cells and photodetectors, while a low density of QDs is needed in the fields of quantum computing and quantum cryptography, such as single-photon emitters. Reference Chang, Chen, Chang, Hsieh, Chyi and Hsu7 In the past 10 years, several approaches have been developed to obtain low densities of QDs so that each isolated single QD can be addressed optically. After InAs deposition, slightly less than the critical coverage value, postgrowth annealing is introduced to obtain low-density dots around ∼109 cm−2, Reference Kamiya, Tanaka and Sakaki8 ∼108 cm−2, Reference Kamiya, Tanaka, Ohtsuki and Sakaki9 and ∼104–108 cm−2. Reference Ohmori, Kawazu, Torii, Takahashi and Sakaki10 Also, it has been found that low densities of QDs can be obtained when InAs is intentionally deposited on the sample surface inhomogeneously. Reference Silva, Quivy, González-Borrero, Marega and Leite11 To further reduce the QD density, the InAs coverage is intentionally varied along the surface of a highly inhomogeneous sample by stopping the rotation of the wafer during InAs deposition. After additional thermal annealing, QD density as low as 2.5 × 107 cm−2 is achieved by using this method. Reference Sun, Jin and Wang12 Similarly, InAs is deposited on a GaAs substrate with a temperature gradient. Offcut substrate can also be used to achieve nucleation of low-density QDs in the range of 107–108 cm−2 without any growth interruption or postgrowth annealing. Reference Dubrovskii, Cirlin, Brunkov, Perimetti and Akopyan13 As a result, a QD density gradient is found along the same direction of thermal gradient and QDs with densities as low as ∼8 × 106 cm−2 are observed in the high-temperature region. Reference Jin, Ye and Wang14 Recently, very low-density QDs (∼4 × 106 cm−2) have been reported by using a low InAs growth rate and high growth temperature. Reference Huang, Niu, Ni, Xiong, Zhan, Fang and Xia15,Reference Trevisi, Seravalli, Frigeri and Franchi16 Using this simple method, large-scale low-density QDs can be formed but with poor control over the QD position. Prepatterned substrate has also been used to grow position-controlled low-density QDs for potential device integration. Reference Schneider, Strauss, Sunner, Huggenberger, Wiener, Reitzenstein, Kamp, Hofling and Forchel17–Reference Toujyou and Tsukamoto19 This method requires pregrowth processing of substrates, which can easily introduce contaminations and defect formation. Additionally, it is difficult to grow low-density QDs in a large scale limited by the processing techniques.
In this article, we report the fabrication of ultralow-density QDs formed in self-assembled nanoholes by molecular beam epitaxy (MBE). This technique uses the unique droplet epitaxy. Reference Liang, Wang, Lee, Sablon, Mazur and Salamo20,Reference Alonso-González, Martín-Sánchez, González, Alén, Fuster and González21 By using the droplet epitaxy, the formation of large-scale low-density QDs can be easily obtained and well controlled. By using high-temperature droplet etching epitaxy, the nanohole density and hence QD density are reduced to ∼4 × 106 cm−2. Reference Wu and Wang22 Such a low density of QDs provides opportunities for fabrication of low-density QDs and researches on individual QD behaviors within the capability of current facilities. Reference Huo, Witek, Kumar, Cardenas, Zhang, Akopian, Singh, Zallo, Grifone and Kriegner23 After capping with a thin GaAs layer, the positions of QDs remain visible on the sample surface, which facilitates fabrication of single QD device or experiment on a single QD. Reference Pfeiffer, Lindfors, Zhang, Fenk, Phillipp, Atkinson, Rastelli, Schmidt, Giessen and Lippitz24 In addition, the presented growth method can be further extended to obtain ordered QDs by combining the approach of fabricating ordered Ga droplets using focus ion beam or other techniques. Reference Wei, Lian, Lu and Wang25
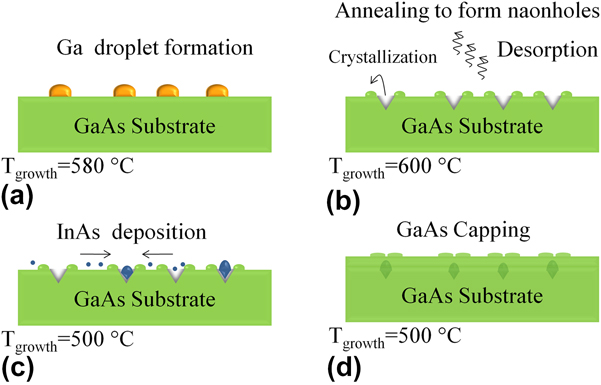
All samples in this article were grown on semi-insulated GaAs (100) substrates using an MBE system equipped with reflection high-energy electron diffraction (RHEED). Substrate temperatures were measured by a noncontact transmission thermometry temperature measurement system and then calibrated by the native oxide desorption temperature of GaAs determined by RHEED. After heating the sample up to 610 °C, the sample was kept at this temperature for 10 min to completely remove the native oxide. After oxide desorption, a GaAs buffer layer of 0.5 µm was grown at 580 °C. Then, the chamber was prepared for nanohole growth by droplet etching epitaxy. Reference Alonso-González, Martín-Sánchez, González, Alén, Fuster and González21,Reference Wang, Holmes, Shultz and Salamo26–Reference Wang, Liang, Sablon and Salamo29 The schematics of low-density QD growth are shown in Fig. 1. First, all the cell shutters were closed, the As background flux pressure was reduced to ∼10−9 torr, and 3-ML Ga based on an equivalent amount of GaAs on (100) orientation was deposited to form droplets on GaAs surface as shown in Fig. 1(a). Subsequently, the sample was annealed at 600 °C for 5 min to form nanoholes. As shown in Fig. 1(b), the nanoholes are created by Ga nanodrilling under high-temperature annealing. In this article, the substrate temperature (580 °C) was much higher than previously reported and thus the nanohole density was a lot lower. One reference sample A is grown with nanohole only and another three QD samples were grown on nanohole templates. After the formation of nanoholes, the substrate temperature was immediately reduced to 500 °C and different InAs coverages were deposited on the three samples at a growth rate of 0.03 ML/s as illustrated in Fig. 1(c). The slow growth rate is essential for surface diffusion of In adatoms and nucleation of InAs QDs solely in nanoholes. The three QD samples are assigned as samples B, C, and D, which correspond to InAs coverage of 0.9, 1.2, and 1.35 ML, respectively. The samples were then quenched to room temperature and then investigated by atomic force microscopy (AFM). A separated set of samples were grown by using the same recipes, but the QDs were capped with 10 nm GaAs for photoluminescence (PL) study. Such a thin capping layer left distinct surface structures which can assist to locate the position of buried QDs, as shown in Fig. 1(d). These three samples are labeled as B′, C′, and D′ corresponding to InAs coverages of 0.9, 1.2, and 1.35 ML, respectively.
Schematics of low-density InAs QDs growth on nanohole template. (a) Ga deposition in As depleted ambience to form low-density Ga droplets by high temperature droplet epitaxy. (b) High-temperature annealing to form nanoholes. (c) Deposition InAs at a very low growth rate to create QDs in nanoholes. (d) Covering ofInAs QDs with a thin GaAs capping layer.
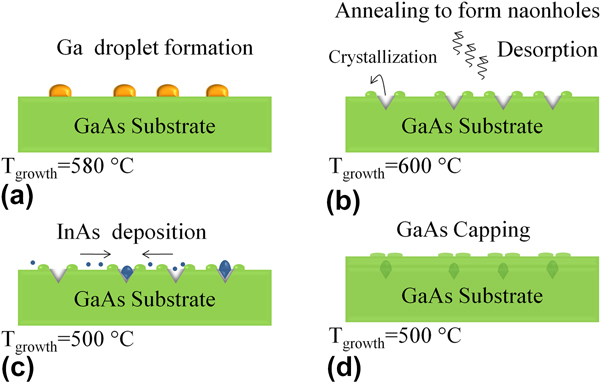
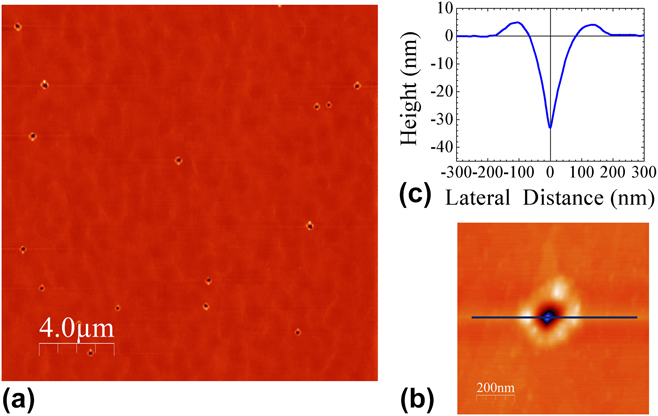
Figure 2 shows the AFM images of the nanohole sample (sample A). Figure 2(a) is a 20 × 20 µm2 AFM image of the nanohole sample surface. The very-low density of nanoholes is due to droplet epitaxy growth at a high temperature of 580 °C. The formation of nanodroplets is governed by two different mechanisms at different temperatures. Reference Wu and Wang22 According to the classical nucleation theory, the density of clusters reduces with increasing temperature and the density of nanodroplets generally follows a classical nucleation scaling law at low temperatures. However, Ostwald ripening becomes substantial at high temperatures, and Ostwald ripening further reduces the density of droplets on GaAs surface. Reference Heyn, Stemmann, Schramm, Welsch, Hansen and Nemcsics30 Therefore, by growing at a high temperature of 580 °C, the obtained nanohole density of sample A is estimated to be as low as ∼4 × 106 cm−2. Figure 2(b) shows a magnified 1 × 1-µm2 AFM image of a single nanohole. The ring-like wall around the nanohole is from the droplet etching process. Reference Liang, Wang, Lee, Sablon, Mazur and Salamo20,Reference Heyn, Stemmann and Hansen28,Reference Wang, Liang, Sablon and Salamo29,Reference Heyn, Bartsch, Sanguinetti, Jesson and Hansen31 The presence of Ga droplet promotes As removal from the substrate. As a result of the low solubility around 10−4, As atoms quickly diffuse through the liquid Ga droplet. Reference Heyn, Bartsch, Sanguinetti, Jesson and Hansen31 The released As atoms from the substrate reattach to the surface by reacting with Ga atoms diffused out from the liquid droplet and crystallizes the ring-shaped wall at the boundary of the droplet. Reference Heyn32 The line profile shown in Fig. 2(c) is taken along the [011] direction. The hole diameter is measured to be 147.8 ± 16.1 nm while the hole depth is observed to be as deep as 29.1 ± 3.5 nm. The hole depth value is significantly larger than previous reports. Reference Liang, Wang, Lee, Sablon, Mazur and Salamo20,Reference Heyn, Stemmann and Hansen28 This can be attributed to enhanced As desorption from the substrate at the high growth temperature. The etching depth is the product of the etch rate, r e, and etching time, t. Reference Heyn, Bartsch, Sanguinetti, Jesson and Hansen31 The etching rate, r e, can be expressed as a thermally activated function, r e ∝ exp(−E e/k B T), where E e is the activation energy of etching, i.e., As removal from the substrate; k B is the Boltzmann constant; and T is the temperature. Reference Heyn, Bartsch, Sanguinetti, Jesson and Hansen31 Therefore, the etching rate, r e, can be significantly enhanced at a high temperature due to the exponential dependence of temperature. As a result of enhanced nanodrilling by droplets at high temperatures, the nanohole depth is much deeper in this study. It has been known that the As desorption is the key process of the nanodrilling effect, and As flux can be used to control the etching rate and the nanohole morphology. Reference Wang, Liang, Sablon, Lee, Mazur, Strom and Salamo33,Reference Li, Wu, Wang, Liang, Lee, Kim and Salamo34 To create smaller nanoholes, a higher As flux or a shorter annealing time can be used.
(a) A 20 × 20-µm2 AFM image of sample A with nanoholes. (b) Magnified AFM image of a single nanohole. (c) Line profile of the nanohole in (b) along the [011] direction.
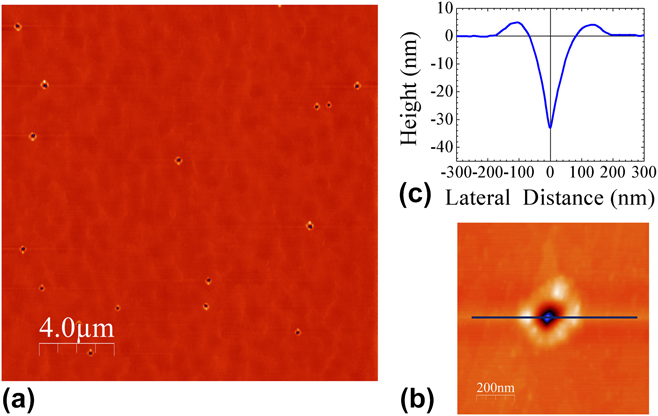
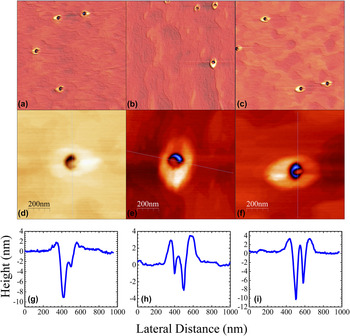
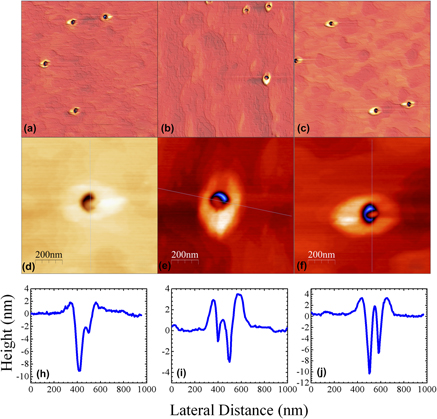
Figure 3 shows 5 × 5-µm2 AFM images of samples B, C, and D. As shown in Figs. 3(a)–3(c), all samples show very-low-density nanoholes, of which the density is, similar as sample A, 5–7 × 106 cm−2. Magnified AFM images of samples B, C, and D are displayed in Figs. 3(d)–3(f). The AFM images demonstrate the detailed structures of QDs formed in the nanoholes. It is also worth noting that the QDs only form inside the nanoholes, indicating that the QD nucleation took place preferably inside the nanoholes. The phenomenon can be understood by the modified surface chemical potential by droplet epitaxy. Specifically, the deposited atoms diffuse from regions of high chemical potential to regions of low chemical potential. Given a sufficient long diffusion length, this implies that the chemical potential in the nucleation sites is minimal. To formulate the chemical potential quantitatively, we assume that the InAs epitaxial layer conforms exactly to the shape of the underlying hole-patterned GaAs structures. The chemical potential for the epitaxial layer growth can be expressed as Reference Li35
 $$\mu = {\mu _0} + \Omega \gamma k + \Omega {E_{{\rm{str}}}} + \Omega {{\partial \gamma \left( h \right)} \over {\partial h}}\quad ,$$
where μ0 is the thermodynamic driving force of the crystallization process, Ω is the atomic volume, γ is the surface energy density, k is the local surface curvature, and E
str is the mismatch strain energy density stored in the epitaxial material. The strain energy density can be expressed by
 ${E_{{\rm{str}}}} = 2G\left[ {\left( {1 + \upsilon } \right)/\left( {1 - \upsilon } \right)} \right]\varepsilon _0^2$
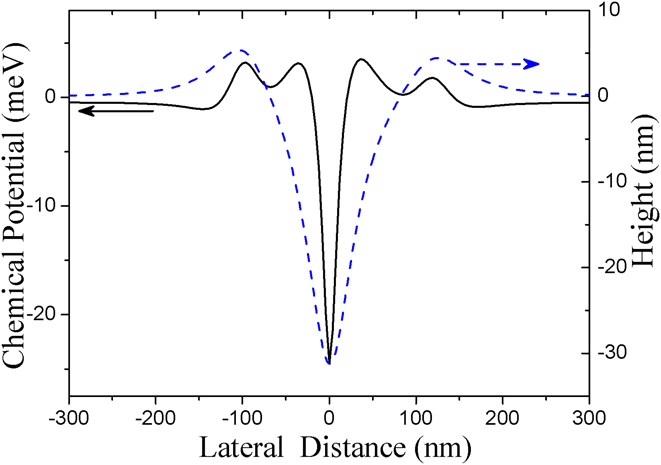
, where G is the shear modulus, υ is the Poisson ratio, and ε0 is the strain mismatch between the epitaxial material and the substrate. The second term represents the contribution of the surface curvature, the third term determines the strain contribution to the chemical potential, and the last term is the contribution of the surface energy change with the increase of layer thickness. We use AFM-generated surface profiles in Fig. 2(c) to calculate the surface curvature and hence the locally varying surface chemical potential. The calculated result of the chemical potential of the hole-patterned GaAs substrate is shown in Fig. 4. The dashed curve is the surface profile of the hole-patterned surface, and the solid curve is the calculated surface chemical potential according to Eq. (1). One can find that there is a minima of the chemical potential at the center of the nanohole caused by the minimal surface curvature.
(a–c) AFM images with lateral scale 5 × 5 µm2 of sample B (0.9-ML InAs), sample C (1.2-ML InAs), and sample D (1.35-ML InAs). (d–f) Single QD AFM images of samples B, C, and D, respectively. (g–i) AFM line profile of samples B, C, and D taken along the [011] direction. The lateral scale of the AFM images is 1 × 1 µm2.

Chemical potential as a function of lateral distance of hole-patterned GaAs substrate. The thickness of InAs layer is 1.35 ML in the calculation. The dashed blue line is the surface profile measured by AFM, and the black solid line represents surface chemical potential.
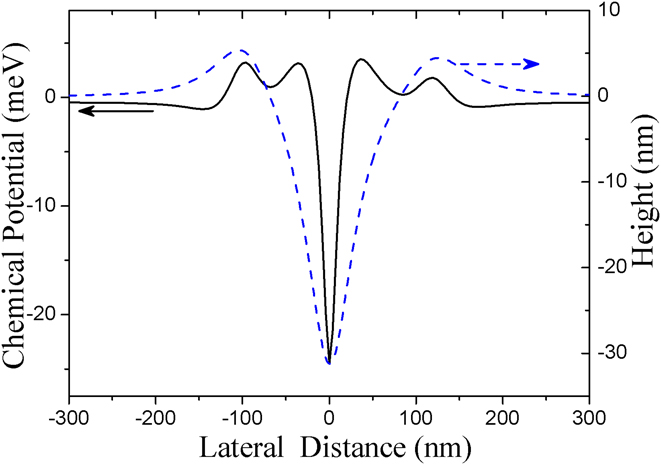
The position of the minimal surface chemical potential agrees very well with the observed locations of self-assembled InAs QDs inside the nanoholes, as shown in Fig. 3. The local minima of chemical potential at the center of the holes are narrow and relatively deep, which suggests that the possibility of QDs formed inside the nanoholes is high. By using a very slow growth rate of InAs, all QDs are formed in the nanoholes. The experimental observations are consistent with the modeling results based on the calculations of surface chemical potential. It should be noted that the anisotropies of the thermodynamic driving force, the surface energy density, and the mismatch strain energy density are not considered here.
The line profile taken along the [011] direction of all samples is shown in Figs. 3(h)–3(j). The QDs preferentially form against the nanohole sidewall along the
 $\left[ {01\bar{1}} \right]$
direction. First, the nanohole formation is obviously an anisotropic process, which is evident from Fig. 2. The nanohole is slightly deviated from perfect circle with a high GaAs hillock along the
 $\left[ {01\bar{1}} \right]$
direction. In other words, the surrounding area of the nanoholes is higher along the
 $\left[ {01\bar{1}} \right]$
direction than along the [011] direction. We speculate that the anisotropic process during nanodrilling creates more atomic steps along the
 $\left[ {01\bar{1}} \right]$
sidewall with a lower surface energy density, which results in a lower chemical potential along the
 $\left[ {01\bar{1}} \right]$
direction preferred by the InAs QD nucleation. By carefully controlling the droplet etching process, highly symmetric circular nanohole can be realized.
Reference Huo, Křápek, Rastelli and Schmidt36
In addition, since the GaAs(100) surface is anisotropic, nanostructures formed on the surface may deviated from the symmetrical shape. It has been shown that the anisotropic strain field can lead to formation of slightly elongated InAs QDs along the
 $\left[ {01\bar{1}} \right]$
direction on the GaAs surface.
Reference Schmidbauer, Wang, Mazur, Lytvyn, Salamo, Grigoriev, Schäfer, Köhler and Hanke37
Therefore, the anisotropic strain can also account for the preferred nucleation of InAs QDs against the sidewall along the
 $\left[ {01\bar{1}} \right]$
direction, according to Eq. (1). The anisotropic surface diffusion lengths can also lead to preferential nucleation of QDs along the
 $\left[ {01\bar{1}} \right]$
direction.
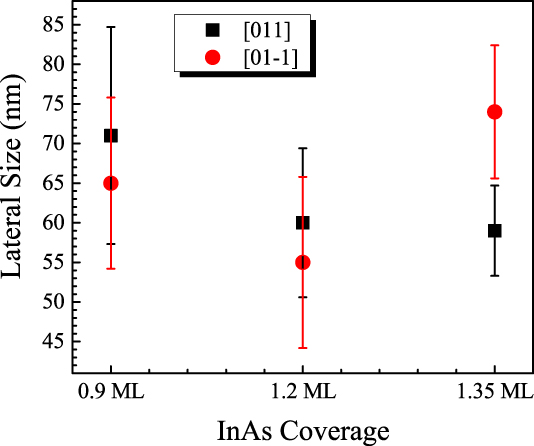
After InAs deposition, the nanoholes are only partially filled with QDs against the sidewall due to anisotropic nucleation. The QDs of all samples show similar sizes following the shape of nanoholes. The measured average lateral size of these QDs is in the range of 50–80 nm, as shown in Fig. 5. The lateral width of the QDs measured along the
 $\left[ {01\bar{1}} \right]$
direction is 65 ± 10.8 nm, 55 ± 10.8 nm, and 74 ± 0.8.4 nm, and the width measured along the [011] direction is 71 ± 13.7 nm, 60 ± 9.4 nm, and 59 ± 5.7 nm for samples B, C, and D, respectively. As shown in Fig. 5, the width of the QD of sample D is the largest along the
 $\left[ {01\bar{1}} \right]$
direction, whereas the smallest in the [011] direction for all samples. It should be noted that due to the fact that the QDs are below the surface, the size measurement using AFM becomes less accurate. Therefore, the QD size measurement of sample B also has the largest error. Moreover, the height of the QDs is difficult to estimate as the QDs partially fill inside the nanoholes. Nonetheless, in Fig. 3, it shows that the tip of the QD of sample B is well below the surface, whereas the tip of the QDs of other samples almost reaches the level of the surface. Obviously, the QDs grow taller with increasing In coverage and such an argument agrees with previous reports on QD fabrication with much higher In coverages.
Reference Liang, Wang, Lee, Sablon, Mazur and Salamo20
To obtain QDs with smaller size, less In deposition can be applied during QD growth. At the same time, the nanoholes can also be grown with smaller dimensions by less annealing time and/or higher As flux. Therefore, the growth of QDs can be either independently controlled at the nucleation step or adjusted by designing the formation of nanoholes. As a result, the control of the QD density and QD size can be decoupled and optimized independently.
The lateral dimensions of the QDs formed in the nanoholes. The measurements are taken along the [011] and
 $\left[ {0\bar{1}1} \right]$
directions.
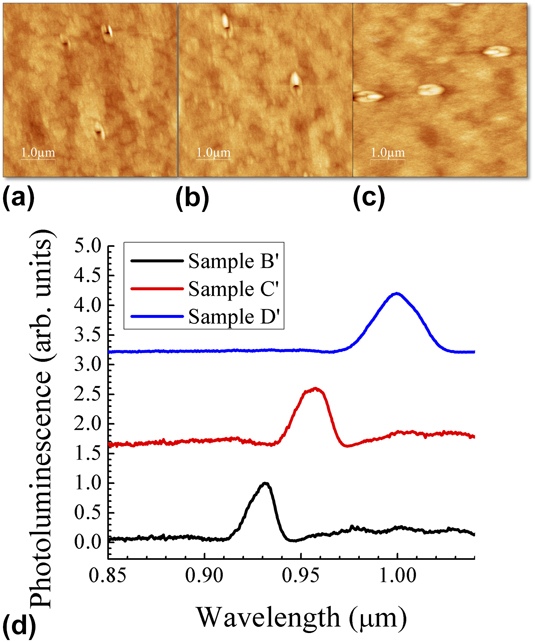
To gain more details of the QDs fabricated by nanohole filling, another set of QD samples with the same sample structures were grown but capped with a 10-nm GaAs cap layer at 500 °C after the formation of InAs QDs. The AFM images of the capped samples B′, C′, and D′ are illustrated in Fig. 6. After being caped with the thin GaAs layer, the QD position is still clearly present on the surface. This is so because the nanohole surrounding structures are made of GaAs and subsequent growth of the thin GaAs layer tends to follow the original structure shape. The surface can be flattened by further deposition of GaAs. As previously discussed and shown in Fig. 4, the nanohole region has lower chemical potential, and nucleation of GaAs also preferentially happens in the nanoholes. For samples B′, C′, and D′, the depth of the hole left on the surface is only few nanometers after GaAs capping. It is also worth mentioning that the unclosed hole depth decreases with increasing In coverage. The hole depth of samples B′ and C′ is ∼2.5 nm, whereas the hole is totally filled for sample D′. This again indicates that the QD size is dependent on the In coverage.
5 × 5-µm2 AFM images of samples (a) B′, (b) C′, and (c) D′ after capping with 10-nm GaAs. (d) PL of samples B′, C′, and D′ measured at 77 K.
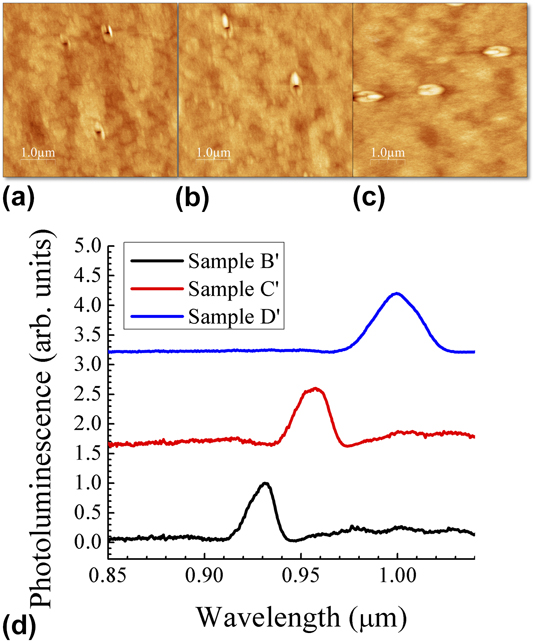
PL measurements of these caped low-density InAs QDs were carried out at 77 K by using a Fourier transform infrared spectrometer. The excitation power intensity is estimated to be about ∼1.0 W/cm2. Figure 6(d) shows the PL spectra of all the capped samples. The PL spectra for samples B′, C′, and D′ are normalized with the peak intensity. All the three samples exhibit a single narrow emission peak. As shown in Fig. 6(d), samples B′, C′, and D′ show PL peaks at 0.93, 0.96, and 1.0 µm with full width at half maxima (FWHM) of 14 nm (20 meV), 17 nm (23 meV), and 26 nm (33 meV), respectively. The narrow PL peak width indicates formation of uniform low-density QDs in the nanoholes. The red shift of the PL peak upon increasing the In coverage suggests weaker quantum confinement of the QDs with higher In coverage and thus the formation of larger QDs. Therefore, PL results again confirm that the size of QDs increases from increasing In coverage from 0.9 to 1.35 ML. It is interesting to observe that the FWHM grows much larger for sample D′ than for sample B′. With increasing In coverage, the QDs grow larger and expand out from the holes, resulting in a large size variation and hence larger inhomogeneity broadening of PL. When the In coverage is low, the QDs are confined inside the nanoholes. When the In coverage increases, the QDs grow bigger and the overall uniformity gets worse. Therefore, FWHM increases with increasing In coverage. Nevertheless, the narrow and well-resolved PL spectra of such low-density QDs at 77 K indicate good optical property and uniformity of these QDs.
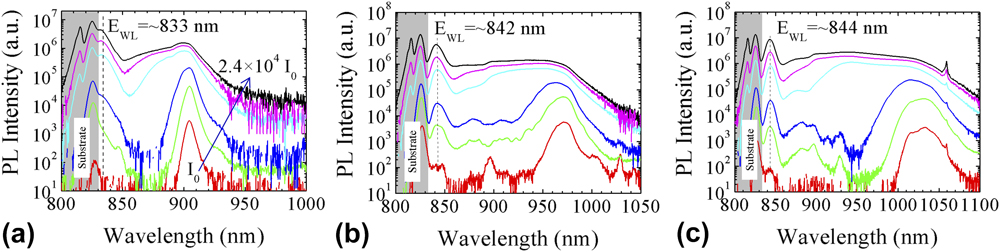
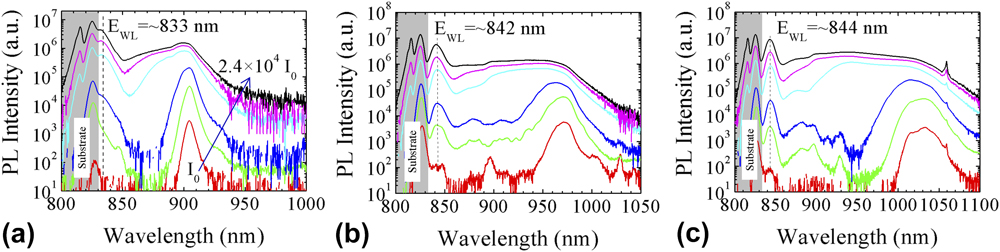
To gain further insights into the optical properties of the QDs, power-dependent PL measurements of the QDs were investigated at 15 K. The power-dependent PL measurements are performed using the 532-nm line of a doubled neodymium-doped yttrium aluminum garnet laser for excitation in variable temperatures, 10–300 K, within a closed cycle helium cryostat. The laser spot diameter is about 20 μm. The excitation power intensity varies from I 0 = 70 mW/cm2 to 2.4 × 10⁴ I 0. The PL signal from the sample is dispersed by a 0.5-m single-grating monochromator and detected by an liquid nitrogen-cooled InGaAs photodiode detector array. Figure 7(a)–7(c) shows the power-dependent PL spectra for the three capped QD samples B′, C′, and D′. The PL spectral shape shows a strong dependence on the excitation power. The PL peaks around 1.5 eV are due to GaAs emission from the substrate. At a low excitation power, the three samples exhibit a single narrow emission peak similar to what has been measured for low power excitation at 77 K. With increasing excitation power over 200 I 0, the PL spectra clearly show enhanced broadening. The broadening of PL emission mainly extended to shorter wavelengths, which can be attributed to multiple additional transitions starting to appear at shorter wavelength ranges with high excitation intensity. Because of state-filling, radiative recombination from excited states becomes substantial in the QDs, leading to a broad emission spectra. As the QDs are relatively large in size, a weak quantum confinement with a large number of closely spaced excited states is expected. As a result, the state-filling does not show well-resolved emission peaks from excited states. Additionally, a distinct narrow peak is observed below the GaAs band gap around 833–845 nm at high laser excitation powers. The narrow emission peak is in the typical wetting layer spectral range of InAs/GaAs samples, which indicates formation of InAs wetting layer in addition to InAs QDs. Reference Wang, Holmes, Shultz and Salamo26 Based on the QD volume and density, it suggests that a portion of the InAs deposited on the surface does not contribute to the formation of QDs and, consequently, should be deposited between nanoholes, hence forming a wetting layer.
PL spectra of samples (a) B′, (b) C′, and (c) D′ measured with different excitation powers at 15 K. The excitation powers used are I 0 = 70 mW/cm2, 20 I 0, 200 I 0, 3500 I 0, 2 × 10⁴ I 0, and 2.4 × 10⁴ I 0. The arrow in the plot indicates the direction of increasing laser excitation power.
In conclusion, ultralow-density InAs QDs are grown on a self-assembled low density nanohole template patterned by high temperature droplet etching epitaxy. AFM and the PL technique have revealed that the QD size can be controlled by varying In coverage. The formed surface structure after capping QDs with a thin GaAs layer serves as the nanostructure position marker which benefits single QD device fabrication. The density and the size of the QDs can be controlled independently by using the method reported in this article. The presented low density nanostructure growth technique opens opportunities for studying single QD properties and single QD devices.
Supplementary Material
To view supplementary material for this article, please visit https://doi.org/10.1557/jmr.2017.408.
ACKNOWLEDGMENTS
The authors acknowledge the support of the National Science Foundation of the U.S. (EPSCoR Grant No. OIA-1457888), National Program on Key Basic Research Project (2013CB933301), and National Natural Science Foundation of China (61474015). The authors wish to dedicate this article to the memory of Dr. Jan H. van der Merwe.