

The Liberal party dominated twentieth-century Canadian politics by dominating Quebec (see Johnston Reference Johnston2017, Table 3.1). Over the same period, the party regularly rotated its leadership between Quebec and elsewhere. How critical were leaders from Quebec to success in that province? Did success in Quebec come at a price in the rest of Canada? Some of these questions have been taken up before, notably by Lemieux and Crête (Reference Lemieux, Crête and Howard1982), Crête and Simard (Reference Crête, Simard and Crête1984), and Nadeau and Blais (Reference Nadeau and Blais1993). But much has happened since those early contributions, and analysis in greater depth is now possible. It is time to return to the questions.
The questions are not peculiar to Canada. Recent theoretical developments in ethnic politics have come to emphasize their coalitional nature. The cohesion and mobility that characterized the twentieth-century Quebec federal electorate—and may characterize it again in the twenty-first century—is a common pattern. After reviewing the theory, this article moves to evidence about Liberal leader selection. It proposes a simple estimation model for broadly parallel analyses in Quebec and the rest of Canada and considers the unfolding of leadership dynamics over the full period. It then moves to a more complex model that tests economic factors as an alternative explanation for the original pattern. The basic pattern survives the challenge. The article concludes by considering mechanisms of effect and by asking whether the pattern is sustainable.
Empirical and Theoretical Preliminaries
A pattern for leaders from Quebec is already on the record. Lemieux and Crête (Reference Lemieux, Crête and Howard1982: 222–23) and Crête and Simard (Reference Crête, Simard and Crête1984: 194–96) estimate that having a leader from the province adds 13 to 15 percentage points to the Liberals’ Quebec vote, relative to recent levels.Footnote 1 Nadeau and Blais (Reference Nadeau and Blais1993) echo this finding and extend it to the entire electorate, with a Canada-wide estimated impact of between 4 and 5 percentage points. Although they conjecture that the boost inside Quebec “may be amplified by bandwagon effects in the rest of the country” (780), they supply no proof. It is possible that the net effect they identify masks directional divergence between Quebec and the rest of Canada, with the former simply overpowering the latter. The Nadeau-Blais finding is also notable in another way: leadership is not their initial concern. Rather, their focus is on economic voting, with the Quebec leadership component as a necessary control. Yet this ancillary consideration ends up dominating their system.
These findings are consistent with recent work on ethnic voting patterns and, indeed, add up to a case in point. Ethnicity is commonly presented as susceptible to policy extremism and irreconcilable positions, in contrast to the fungibility of positions in the economic domain. A classic statement is Rabushka and Shepsle (Reference Rabushka and Shepsle1972). An alternative view is gaining traction, starting with Saideman et al. (Reference Saideman, Lanoue, Campenni and Stanton2002), which emphasizes not the fixity of ethnic-group positions but their mutability. Ethnic politics as ordinary politics is the central theme of Birnir (Reference Birnir2006). She proposes a notion of the “ethnic attractor”, which “produces a long-term pattern through the association of ethnic voters who are enticed to rely on fellow group members for electoral cues” (10). The policy content of this cue-giving is commonly negotiable. Rarely, pace Rabushka and Shepsle, do demands become all-or-nothing. Birnir goes on to observe: “In the short term, cohesion dominates ethnic group behavior. In the long term, flexibility becomes the norm, as the group responds cohesively to exogenous influences” (10). Her view is broadly consistent with Dawson's (Reference Dawson1994) conception of “linked fate”, especially to the extent that ethnic groups structure sociability in ways that amplify their collective influence (Uhlaner, Reference Uhlaner1989a, Reference Uhlaner1989b).
Cohesion and mobility lie at the very core of Johnston's (Reference Johnston2017) claim about Quebec as the twentieth-century pivot for Canadian government. Three things are helpful to making the cohesion-mobility logic work. The first is that votes are cast for policy, not for parties (Kedar Reference Kedar2009). Parties are the instruments of policy but are not ends in themselves. Johnston (Reference Johnston2017: 86–88) argues that this is truer for voters in Quebec than in the rest of Canada, and was especially so before 1993. This presupposes the second factor: that a party is actually able to enact policy, alone or in coalition. As Birner (Reference Birnir2006: 38) puts it: “A party that cannot enact policy is less representative than one that can.” Either an ethnic party is mobile in choosing coalition partners, or ethnic voters are mobile in choosing among parties. As credible contenders for single-party government, Canadian parties attract the second form of mobility. Quebec voters respond accordingly, or at least they did so for many decades. The complex perfectly exemplifies the pattern identified by Huber (Reference Huber2012: 999): “In majoritarian systems with geographically dispersed groups, there can be strong incentives for a minority group to vote together for a mainstream party in an effort to become pivotal in determining election outcomes.” The third factor is that parties are accessible to members of minority ethnic groups. Best of all, conjectures Birnir, is if ethnic representation is structured through “larger, nonethnic parties” (Reference Birnir2006:15). For access to the policy process, a strong signal is access to leadership.
Evolution of the pattern
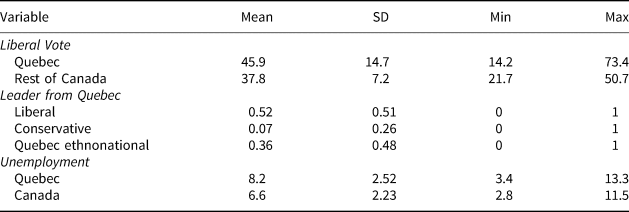
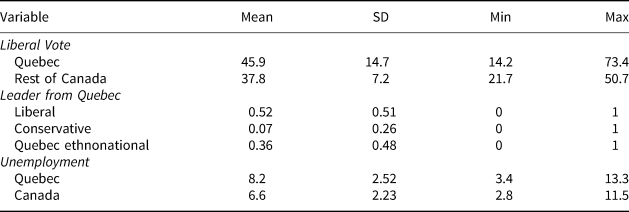
Across all elections since 1867, the Liberals were led by a Quebec francophone about half the time (see Table 1). As this was true of no elections in the first 34 years, the Quebec position for the twentieth and twenty-first centuries is even stronger. For the last five decades, only Quebec francophones have led the Liberals to parliamentary majorities and only one never did so. In the Darwinian world of party politics, choosing such leaders evidently carries survival value.
Descriptives (N = 42)
How is this value delivered? It is unlikely to be the product of dumb luck. Rather, it bespeaks intra-party elite coordination to deliver a pattern of alternation. This coordination is helped by taking the process outside the halls of parliament. This, in turn, required new norms, which include forbearance, and these are difficult to enforce. Ultimately, alternation raises the question: alternation of what? The next sections take these questions up in turn.
Going outside
Alternation was helped by the shift in 1919 from intra-parliamentary caucus selection to an extra-parliamentary convention. It mattered little that thanks to MPs’ influence over the selection of constituency delegates, early conventions could be styled as a caucus choice in disguise (Power, Reference Power and Ward1966: 371–72). The key point, rather, is that the extra-parliamentary mechanism facilitates candidacies by persons with modest experience, including from outside parliament; it expands the menu (Kenig, Reference Kenig2009). This, in turn, increases the scope for managed succession (Courtney, Reference Courtney1973: 137–60).
The appeal of the outside strategy is illustrated per contra by the effort required to manage the inside transition in 1887 from Edward Blake to Wilfrid Laurier. As Blake manoeuvred to leave politics, he operated on the belief that his party's growth prospects in Ontario were weak. He also believed that the two most obvious Ontario-based successors, Sir Richard Cartwright and David Mills, would meet resistance in Quebec; the only Ontarian acceptable to Quebeckers was Blake himself. Meanwhile, it seemed clear that in Quebec, anti-Conservative sentiment was growing in reaction to the execution of Louis Riel. Given this convergence of facts, Laurier was the solution to Blake's retirement puzzle (Banks, Reference Banks1957: 119–20). Accordingly, he acted with determination to have his colleagues make the right choice (Courtney, Reference Courtney1973: 49–50). He induced Mills and Cartwright to step aside and to nominate Laurier. He acquiesced in the impression that Laurier was a temporary expedient and that Blake himself would return, a tactically useful illusion (Banks, Reference Banks1957: 122–23, 125; Willison, Reference Willison1903: vol. 1, 34). Of course, Laurier was far from an interim choice.
Norms and their enforcement
Although Blake's move seems motivated by the immediate electoral context, Laurier's longevity and success may have put alternation, as such, on the table. At first, this worked to the advantage of non-Quebeckers. In 1919, Protestants inside the Liberal party wanted payback for loyally supporting a Catholic francophone for more than 30 years (Lederle, Reference Lederle1947: 85–86). On the other side, “One prominent French-Canadian Liberal MP said … ‘We French-Canadians efface ourselves. We admit that the leader must be English Protestant … ’” (quoted in Lederle, Reference Lederle1947: 90).
When the winner at the 1919 convention, William Lyon Mackenzie King, retired in 1948, it was an “open secret” that he and his cabinet supported Louis St. Laurent as his successor (Quinn, Reference Quinn1951: 231). Their emphasis was on securing the Quebec base (Quinn, Reference Quinn1951: 232–33), which seemed at risk after the conscription crisis of 1944–45. But by 1948, alternation also seemed to be congealing as a norm, particularly as the Laurier-King succession had yielded stability and success (Courtney, Reference Courtney1995: 167).
If alternation was now a norm, it was not affirmed universally. In 1968—the next occasion for the choice of a francophone—a majority of delegates opposed its continuance (Regenstreif, Reference Regenstreif1969). Among the reasons that delegates gave for their choice, the virtue of alternation was rarely mentioned. Supporters of Pierre Trudeau, the presumptive beneficiary, were more likely than others to offer alternation as a reason, but LeDuc (Reference LeDuc1971: 110–11) sees this as heavily coloured by rationalization. Trudeau's ultimate majority required four ballots to secure and was the narrowest in the party's history. In 1984, Trudeau himself attacked the presumption of alternation as a barrier to talent and as demeaning to the beneficiary (Chrétien, Reference Chrétien1994: 199).
Given this lack of consensus, alternation requires elite initiative and timely self-restraint. When it is not the Quebec turn, potential candidates from that region must not offer themselves. This was illustrated in 1919 and again in 1957. Should a Quebecker break ranks, elites in the province must work against that person. When it is the Quebec turn, only one Quebecker should come forward and only after elite vetting. Elites outside Quebec must join those inside the province in creating a critical early bloc, making the Quebec candidate a pole of attraction for later ballots.
These principles are illustrated by the contrasting cases of 1968 and 1984. In 1968, contestation was very close, and the convention needed to be intensely managed. It helped that Quebec delegates were consistently the most solidary (LeDuc, Reference LeDuc1971: 112, Table 7; 113, Table 9). Even so, 40 per cent of Quebec delegates did not give Trudeau as their “true” preference (LeDuc, Reference LeDuc1971: 112, Table 8). Although final-ballot differences between elite delegates and the rank and file were weak (LeDuc, Reference LeDuc1971: 116, Table 12),Footnote 2 in the critical early ballots, elites were distinctively consolidated around Trudeau (LeDuc, Reference LeDuc1971: 115, Table 1). In 1984, contrary to previous norms, Jean Chrétien sought to be Pierre Trudeau's successor. But Quebec colleagues discouraged Chrétien and declined to endorse him: “They saw the tradition [of alternation] as a positive custom and they were reluctant to break it: one break now could open the way to a series of anglophone leaders later on” (Chrétien, Reference Chrétien1994: 194).
Ambiguity of categories
The point in choosing Laurier was to carve out a place for Quebec francophones. But this avoided the question of which was more critical, language or region (or, for that matter, religion). The ambiguity is perfectly captured by the cases of Paul Martin Sr. and Paul Martin Jr. The elder Martin's background was bilingual but situated mainly on the French side of the divide. He emerged from the 1917 conscription crisis as quite nationalist (Donaghy, Reference Donaghy2015: 7–8). When he ran against Lester Pearson to succeed Louis St. Laurent in 1958, he was handicapped by being too French and too Catholic (Donaghy, Reference Donaghy2015: 162). In 1968, he was not French enough (Martin, Reference Martin1983): he had chosen the anglophone path for university education, and the bulk of his public life was solidly rooted in Ontario. Paul Martin Jr. presents himself as an anglophone and was born and educated in Ontario. But his business and political life lies squarely in Quebec. His defeat by Jean Chrétien in 1990 and his accession to the leadership in 2003 can be characterized as preserving alternation only if we stipulate that a Quebec leader must also claim native fluency in French.
This logic extends to the succession in 2006. Stéphane Dion was the sole francophone in a race that was arguably the francophone turn. But his victory also implied unbroken leadership from Quebec. In the early stage of the leadership campaign, this was a disadvantage: in an editorial that ultimately endorsed Dion, the Toronto Globe and Mail (2006) stated, “A sense that it is the turn of a leader from outside Quebec has worked against him.” The editorial said nothing about linguistic alternation, nor did it endorse him on that explicitly categorical basis.
The next successions—Michael Ignatieff, anglophone from Ontario, and Justin Trudeau, from Quebec—might seem to clarify matters. But Justin Trudeau is less essentially French and less rooted in the politics of his home province than any Quebec-francophone predecessor. And the high frequency of leadership change—four switches in less than a decade—arguably undermined the deliberative and controlled character of the earlier, slow-moving pattern, where a leader typically held the position for at least ten years or was allowed to weather at least one defeat.
Indicators, Estimation Strategy and Interpretation
Leader indicators
Full representation of parties’ leadership requires three indicators. A base in Quebec may matter more to Quebeckers than to others, but there is no reason to dismiss by fiat its relevance to both electorates. Two indicators are obvious: one for the Liberal party and one for the Conservative party. The third indicator is for parties that I term “Quebec ethnonational”. The appearance of the leader of such a party bespeaks the party's very existence. For the Quebec electorate, the first-order effect is a matter of arithmetic: as the menu of alternatives expands, the space left over for the old parties shrinks. For both Quebec and the rest of Canada, an ethnonational insurgency signals a potential crisis. It disrupts the historic domination of the province by the two old parties and may even signal failure by one or both to manage the file, so to speak. The three parties/party types mirror the logic in Nadeau and Blais (Reference Nadeau and Blais1993). But as Nadeau and Blais had a small number of observations, they conserved degrees of freedom by loading the three party situations into a single indicator. This forced them to commit ex ante to arbitrary values for each component, even as the avenues of effect are masked. My setup allows each leader type to have its own effect.
Coding decisions for each category require justification, however. For the Conservatives, the big question is Brian Mulroney. He is not a native francophone, but his fluency and command of idiom are complete. Moreover, his initial entourage tended to identify quite closely with Quebec national aspirations (Sawatsky, Reference Sawatsky1991). For Nadeau and Blais (Reference Nadeau and Blais1993), Mulroney qualifies as a Quebec leader fully in the class of his Liberal counterparts; I follow their example. The 1997 election also meets this test, with Jean Charest at the helm. Even so, a Quebec-based Conservative leader is a rare thing, as Table 1 shows, present in only 7 per cent of all elections.
The Quebec ethnonational category also requires exercises of judgment. The earliest election with such a leader is 1945, in the aftermath of a conscription crisis. The primary entity was the Bloc Populaire CanadienFootnote 3 led by Maxime Raymond, but the landscape also featured an uncoordinated array of Quebec nationalist insurgents (Cohen, 1965: Table 7; Johnston, Reference Johnston2017: 94). Also included are all elections in which some variant of Social Credit was led by a Quebecker, 1965 to 1980 inclusive. In 1962 and 1963, the Quebec contingent massively outnumbered the remnant from the rest of the country, but the nominal leader of the party was Robert Thompson from Alberta. For some of this period, the Ralliement Créditiste was a separate organization from the ostensibly pan-Canadian Social Credit. When the two Social Credit rivals reunited, the Quebec wing was the senior partner. Throughout, the Créditistes maintained a loose social-conservative and nationalist affinity with the remnant of the old Union Nationale. All elections from 1993 forward fit the ethnonational criterion, with a Bloc Québécois leader continuously present. All told, such party leaders have been present in 36 per cent of all elections.
Finally, there is the leadership of the Liberal party. At the time Crête-Lemieux-Simard and Nadeau-Blais were writing, there had never been a Quebec leader who was not a francophone, nor a francophone who was not a Quebecker. Since then, as already mentioned, the party has been led by Paul Martin, who presents as essentially anglophone, and Justin Trudeau, an ambiguous case. Nadeau and Blais show the way, I believe, with their treatment of Brian Mulroney: the key is that the leader represents a riding in Quebec; the rest follows from that. Thus the chain of Quebec leadership, as coded, is unbroken from Chrétien to Dion. Overall, slightly more than half of all elections feature a Liberal leader from Quebec.Footnote 4
Economic indicators
The second part of this article deploys economic evidence. Apart from the general interest in updating the Nadeau-Blais analysis, there is also a question of substantive interpretation of leadership effects. Brian Mulroney's accession to the Conservative leadership in 1983 coincided with the highest level of unemployment in the entire postwar period, with 1984 close behind. His 1993 departure coincided with another deep recession and the second-highest postwar unemployment reading. The 1962 election—the breakthrough year for the Ralliement Créditiste—followed the so-called Eisenhower recession. The year before this election saw the third highest postwar unemployment rate and the highest to that date. (Recall, however, that Réal Caouette was not inscribed as the Créditiste leader until 1965.) The unemployment peak of 1993 was also the year the Bloc Québécois fought its first election. It is natural to wonder if the apparent effects from Conservative and Quebec-ethnonational leaders are not so much from the persons as from the times—from bad times, that is.
Following Nadeau-Blais, I tested models with inflation, real income growth and unemployment. As in Nadeau-Blais, inflation and real income growth had no effect. Unemployment is another matter. I use the average level by year, from seasonally adjusted source data. In Quebec, election-year unemployment has ranged almost 10 points. The range in Canada as a whole is about one point smaller. Over the full period, unemployment in Quebec has stood 1.6 points higher than the Canada-wide average. Despite these discrepancies, the time path is basically the same in each part of the country.
My estimation model differs in a critical particular from the one used by Nadeau-Blais. Their focus is on the incumbent, such that the effect of unemployment is exactly reversed depending on which party is the incumbent. My setup is open to the possibility that some, at least, of the impact from unemployment is positional. That is, voters do not react just to whether a party is in power but also to what they see as its policy priorities, a possibility first proposed in political science by Kiewiet (Reference Kiewiet1981). In recent work that is both synoptic and attentive to mechanisms, Kayser and Grafström (Reference Kayser and Grafström2016) show that the negative impact of unemployment is particularly harsh for incumbents on the left, and that this is so across a wide range of countries and continents.Footnote 5 Moreover, the qualitative pattern may extend to periods when the left is out of power. On this logic, the Liberals may be generally susceptible to unemployment effects, although especially so when they are in power. But are Canadian Liberals on the left? There is little indication that Liberal governments produce better redistributive outcomes than the Conservatives or that they are more concerned than the Conservatives to fight unemployment (Banting and Myles, Reference Banting and Myles2013: Figure 1.3). The Kayser-Grafström argument points us away from such considerations, however. To them, the key is that the left is identified with the provision of “luxury goods”: policy outcomes that may be valued when times are good but that drop in priority when times turn bad. These include human rights, multiculturalism and environmental protection. On these issues, the Canadian Liberals stand clearly to the left of the Conservatives. With this in mind, Liberal incumbency is represented in the estimation by a dummy and an associated interaction term. This imposes no restraint on how, if at all, incumbency conditions the effect of unemployment; it neither precludes symmetry nor requires it.
Observations
Lemieux-Crête-Simard covers 15 elections in five decades, 1930–1979. Nadeau and Blais cover 11 or 13 elections, 1953–1988.Footnote 6 It is straightforward to update the analysis, as we have seen 8 elections since Nadeau-Blais and 11 since Lemieux-Crête-Simard. For analyses that exclude economic factors, there is no compelling reason to start in 1930. Extending the series enables inclusion of the breakthrough case of Sir Wilfrid Laurier and expands the number of observations to 42. It is true that in the early years, the system underwent institutional and demographic change. The parties required some decades after 1867 to fully colonize the electoral landscape. Only in 1874 were writs of election issued simultaneously for all ridings, and later still for ridings in the West (Reid, Reference Reid1932). The secret ballot was introduced in 1878 (Reid, Reference Reid1932). The franchise remained restricted in the late nineteenth century, and although it came to comprise nearly all male citizens in the early twentieth century (Ward, Reference Ward1950), women did not enter the electorate until 1917 and 1921. Initiating the series at later dates to accommodate these developments does not alter the basic findings, however.
As mentioned, the only relevant economic series is for unemployment. As this series starts in 1946, it yields 22 observations, with the 1949 election as the first.
Estimation Strategy
The basic strategy is to regress the Liberal vote on dummy variables indicating whether or not the leader of the designated party is from Quebec. My setup is open to the possibility that the electorate does not respond instantly to the change of leadership. Start by assuming instead that the electorate adjusts to an exogenous change instantly:
 $$V_{t{\rm \; \;}} ^{\rm {^\ast}} = {\rm \;} \theta _{0{\rm \;}} + {\rm \;} \theta _1L_{t{\rm \;}} + {\rm \;} \upsilon _{t{\rm \;}}, {\rm \;\ \;} t = 1,{\rm \;} \ldots, {\rm \;} T$$
where  $V_t^{\rm *} $ is the hypothetical Liberal share at election t depending on whether or not L t = 1, the leader is from Quebec, or L t = 0, the leader is from another province.Footnote 7 To the extent that there is inertia in the system, actual shifts over an interval will be expressed thus:
 $$V_{t{\rm \; \;}} -V_{t-1{\rm \; \;}} = {\rm \;\ \lambda \;} \lpar {V_t^{\rm {^\ast}} -{\rm \;} V_{t-1{\rm \;}}} \rpar .$$
V t is the observed Liberal share at t. λ indexes how much of the inertia-free potential is actually realized over the interval, where 0 < λ ≤ 1. If λ = 1, then the shift is instantaneous. Although  $V_t^{\rm *} $ is not observed, we can model it by substituting (1) into (2):
 $$V_t-{\rm \;} V_{t-1} = {\rm \;} \lambda {\rm \;} \lpar {\theta_0 + {\rm \;} \theta_1L_t + {\rm \;} \upsilon_t-{\rm \;} V_{t-1}} \rpar {\rm \;}. $$
Exploding the parentheses, rearranging terms, and factoring V t−1 yields:
 $$V_t = {\rm \;} \lambda \theta _0 + {\rm \;} \lambda \theta _1L_t + \lpar {1-{\rm \;} \lambda} \rpar V_{t-1} + {\rm \;} \lambda \upsilon _t{\rm \;}, $$
which now looks like something we can estimate. If we set λθ 0 = β 0, λθ 1 = β 1, 1 − λ = δ, and λυt = εt, we can estimate the equation as:
 $$V_t{\rm \;} = {\rm \;\ \;} \beta _0 + {\rm \;} \beta _1{\rm \;} L_t + {\rm \;} \delta V_{t-1} + {\rm \;} \varepsilon _t.$$
The meaning of β 1 in (4) differs from that of θ 1 in (1). β 1 is not the full effect that we suppose might occur in a world of instantaneous adjustment—that is, θ 1. Rather, β 1 = λθ 1, a version discounted by the speed of adjustment. To recover the full effect of an indefinitely sustained shift to a Quebec francophone, we need to adjust the regression estimate, thus: β 1/λ , the sum of an infinite series. But λ is also a derived value. The derivation starts with δ, the coefficient on the lagged dependent variable. Given that δ = 1 − λ, it must be the case that, λ = 1 − δ. Hence, θ 1 = β 1/(1 − δ).
The presence of the lag term reflects the fact that gradual onset is a realistic possibility. Setups akin to this are ubiquitous in electoral research. For instance, Evans and Andersen (Reference Evans and Andersen2006) show that past vote affects current economic perceptions, and the same is true for perceptions of leaders and issues; biased cognition exerts a drag on political response (Bartels, Reference Bartels2002). What is more, the Quebeckers who actually lead the Liberal party are typically drawn from the anti-nationalist end of the Quebec pool. This is obvious for our time, when the place of Quebec in or out of Canada is explicitly contested. But it was also true in the late nineteenth and early twentieth centuries, when Liberals in Quebec were commonly anti-clerical Rouges. Even if they moderated their anti-clericalism, they were still basically unacceptable to the Ultramontane hierarchy, which also dominated the nationalism of the time (Neatby, Reference Neatby1973). On this account, new Quebec-based leaders are not automatically credible; rather, they have something to prove.
In situations like this, political time series are commonly modelled as systems of such partial adjustment.Footnote 8 Additionally, my strategy is a variant of the “general-to-specific” approach (Hendry, Reference Hendry2003), which argues that there is little justification for imposing instantaneous adjustment by fiat, as would be the case without a lag term in the model. Estimation of such a model requires discharge of two conditions, however. One is that the vote series is stationary, which is to say that it is “stable” and that it exhibits minimal trending, periodicity or structural breaks. Both vote series outside Quebec pass these tests with flying colours. In Quebec, the conditions for estimation are satisfied for the 1867–2015 series. For the postwar Quebec series, the critical one for unemployment estimation, the situation is not so clear. The relevant diagnostics appear in the online appendix, section 1. The other condition is that the system can be estimated by Ordinary Least Squares (OLS). For this, the concern is that disturbances are serially correlated. As it happens, lag terms help soak up such autocorrelation (Pickup, Reference Pickup2014), such that estimation by OLS is possible. See the online appendix, section 2. (For estimations in the rest of Canada, in fact, two lag terms are always necessary to absorb the autocorrelation.)
The basic expectations are:
• β 1 > 0 (or θ 1) > 0. When the Liberals choose a leader from Quebec, their vote in the province increases.
• For leaders of the Conservatives and of Quebec-based ethnonational parties, β 1(or θ 1) < 0.
This logic applies to Quebec. For the rest of Canada, the signs of effect for the Liberals and the others are indeterminate.
Whatever the sign of the relationships outside Quebec, the strategic logic of alternation applies to Quebec itself. Hence, I expect the following to be true:
•
 $\vert \beta _{1QC}\vert \gt \vert \beta _{1ROC} \vert $.

Basic Estimations
Quebec
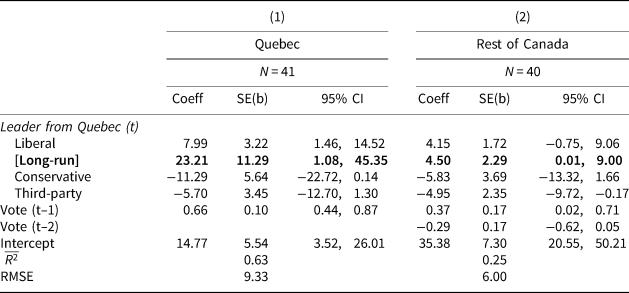
The evidence for both Quebec and the rest of Canada appears in Table 2. Choosing a leader from Quebec makes a huge difference to the Liberals’ fate in that province. For the Liberals, the immediate gain is about 8 percentage points. When the Conservatives choose such a leader, the hit on the Liberals is even bigger, about 11 points. A third party with a Quebec leader and a primarily or exclusively Quebec base reduces the Liberal share by about half that amount again (although the coefficient is not unequivocally different from zero). The immediate effect is not the whole story, however. The lag term, denoted as Vote (t − 1), implies that only one-third of the total potential gain occurs on the first iteration. Should a Quebec leader remain in place for, say, five or six elections, the total gain would be greater than 20 points. This is the implication of the “long-run” estimate in bold.
Quebec Leaders and the Liberal vote
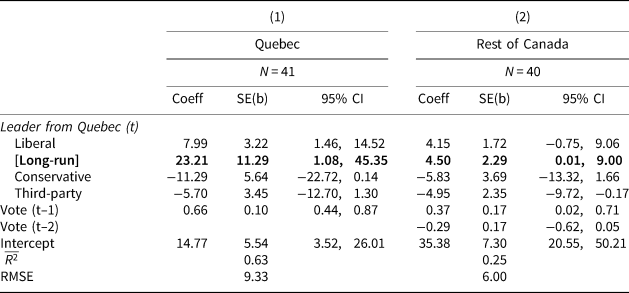
Note: Estimation by OLS. Long-run statistics estimated with nlcom in Stata.
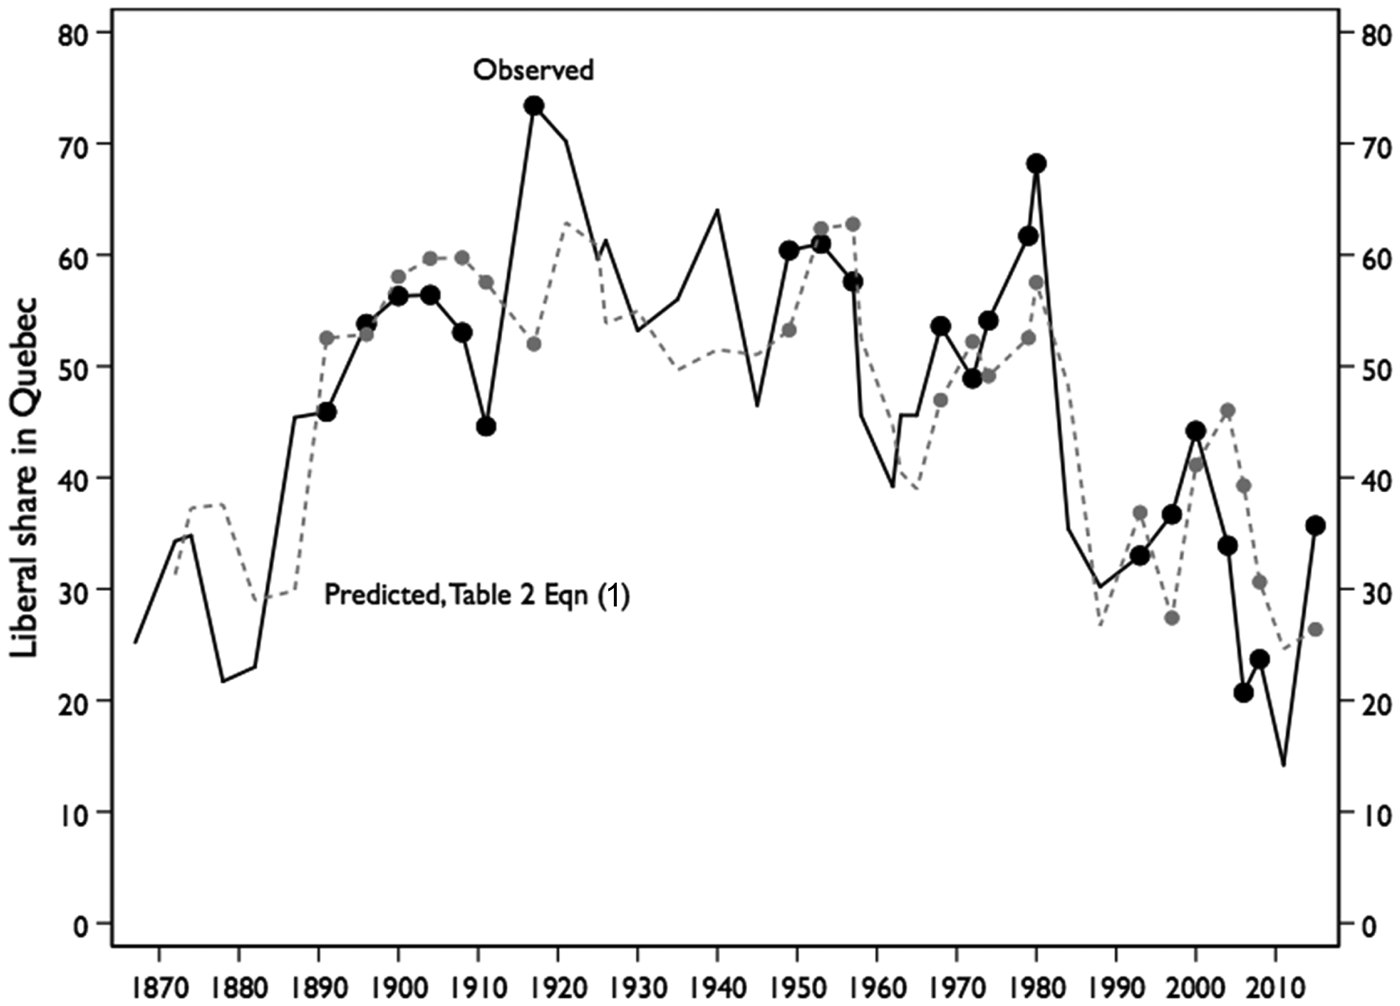
To get a sense of how well the model fits the facts, consider Figure 1. The figure embodies predictions from Table 2, equation 1 (dashed grey), along with the observed values (solid black). Bear in mind that the model has other moving parts: three observations with a Conservative leader from Quebec; several observations with a Quebec third party; and movement in the lag term, not just from leader factors but also from forces outside the model.
Liberal Leader Dynamics in Quebec
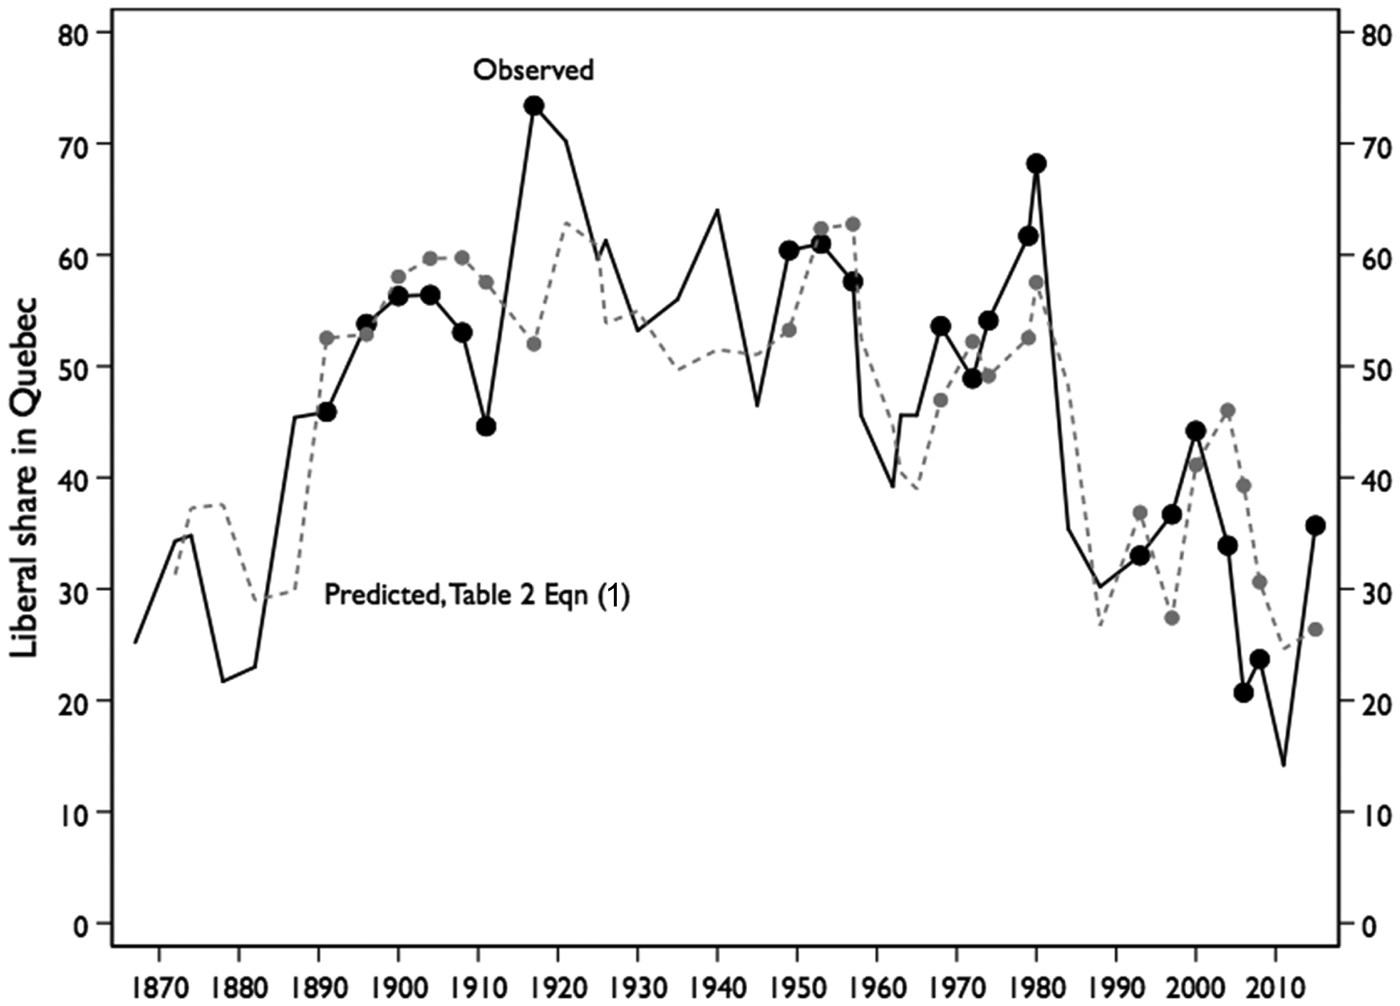
Wilfrid Laurier and Pierre Trudeau illustrate Quebec leadership over a long haul. In Laurier's first election as leader, he boosted the party's fortunes not a bit. The previous election, in 1887, was the breakthrough, a doubling of the party's share in Quebec. It may be significant that Laurier's first platform, in 1891, included “Unrestricted Reciprocity,” a proposal to drop tariff barriers on US goods and ask nothing in return. This was not popular with the Montreal business community. Added value from the switch to Laurier came only in 1896, when reality almost caught up with prediction. This was in spite of the fact that the Catholic hierarchy endorsed the Conservative position on the Manitoba schools crisis, which was then unfolding. Arguably, voters saw Laurier and his endorsement of robust federalism as the better guarantee of communal rights (Crunican, Reference Crunican1974). The subsequent time path of predicted values roughly tracks that for observed ones—until 1911. The 1911 election revealed the continued existence of anti-Rouge and ultra-nationalist forces in Quebec, which produced a negative reaction to the 1910 Naval Bill (Brown, Reference Brown1975: 188–9). The observed drop in 1911 generates a further predicted drop in 1917. Instead, the conscription crisis sent the Quebec Liberal vote through the roof. Critically, Laurier was intransigent on conscription; a leader from another province might have handled the matter differently.
As with Laurier, Trudeau's relationship to his province was complicated. His accession coincides with a jump in Liberal share, although smaller than predicted. The next two elections are broadly in range with prediction, although with short-term motion contrary to prediction. The backdrop to 1972 includes the 1970 October crisis, which brought two kidnappings, a political murder and the abridgement of civil liberties (Smith, Reference Smith1971). The 1974 election shifted focus to the economy and restored the Liberals’ share. In Trudeau's last two elections, the Liberal share reached heights unheard of since the 1917 conscription crisis. This was a period of mounting constitutional tension, with Quebec as the focus. Again, as with Laurier, the largest pro-Liberal shift occurs not upon accession but at a later moment of crisis.
Of the other two Quebec leaders to last more than one election, one follows the predicted path, the other not. Jean Chrétien exemplifies the classic pattern. There is an uptick in his first election, 1993, but less than predicted. The 1997 election was supposed to yield a poor result, thanks to Jean Charest assuming the Conservative leadership. Instead, the Liberals made a modest gain. Their 2000 result was exactly as predicted; the forecast incorporated both the gain in 1997 and the departure of Charest from federal politics. Louis St. Laurent's trajectory lies off the standard path: an instant hit but no further gains. The prediction model says that the Liberal share should grow again in 1953, but it did not. All three readings for St. Laurent are higher than all but one recorded by Laurier.
The two leaders with one election to their name, Stéphane Dion and Justin Trudeau, both seem to have helped their party, Trudeau especially. The era for both is a bad one for the Liberals, however. The 2008 result is the worst since 1887, and the 2015 result, even though it yielded a handsome crop of seats, is well below the median.
Although observed values do not march in lockstep with predicted ones, the patterns are broadly consistent with the logic of the partial-adjustment setup. With the sole exception of Louis St. Laurent, the first election with a Quebec leader yields modest results. The two longest-serving ones ended their careers at much higher levels than they started them. The same is true of Jean Chrétien. Only for St. Laurent was the last result the worst. Dion and Trudeau, of course, have no trajectory to discuss.Footnote 9
The rest of Canada
In the rest of the country, the pattern echoes that in Quebec. For neither big party is the leader effect significantly different from zero. The long-run effect from Liberal leadership is similarly pallid. Not only is the first lag weak but the second lag partly offsets it. Thus the initial effect and the long-run effect are barely distinguishable. The clearest signal, in fact, seems to be from the presence of a Quebec-based third-party leader.
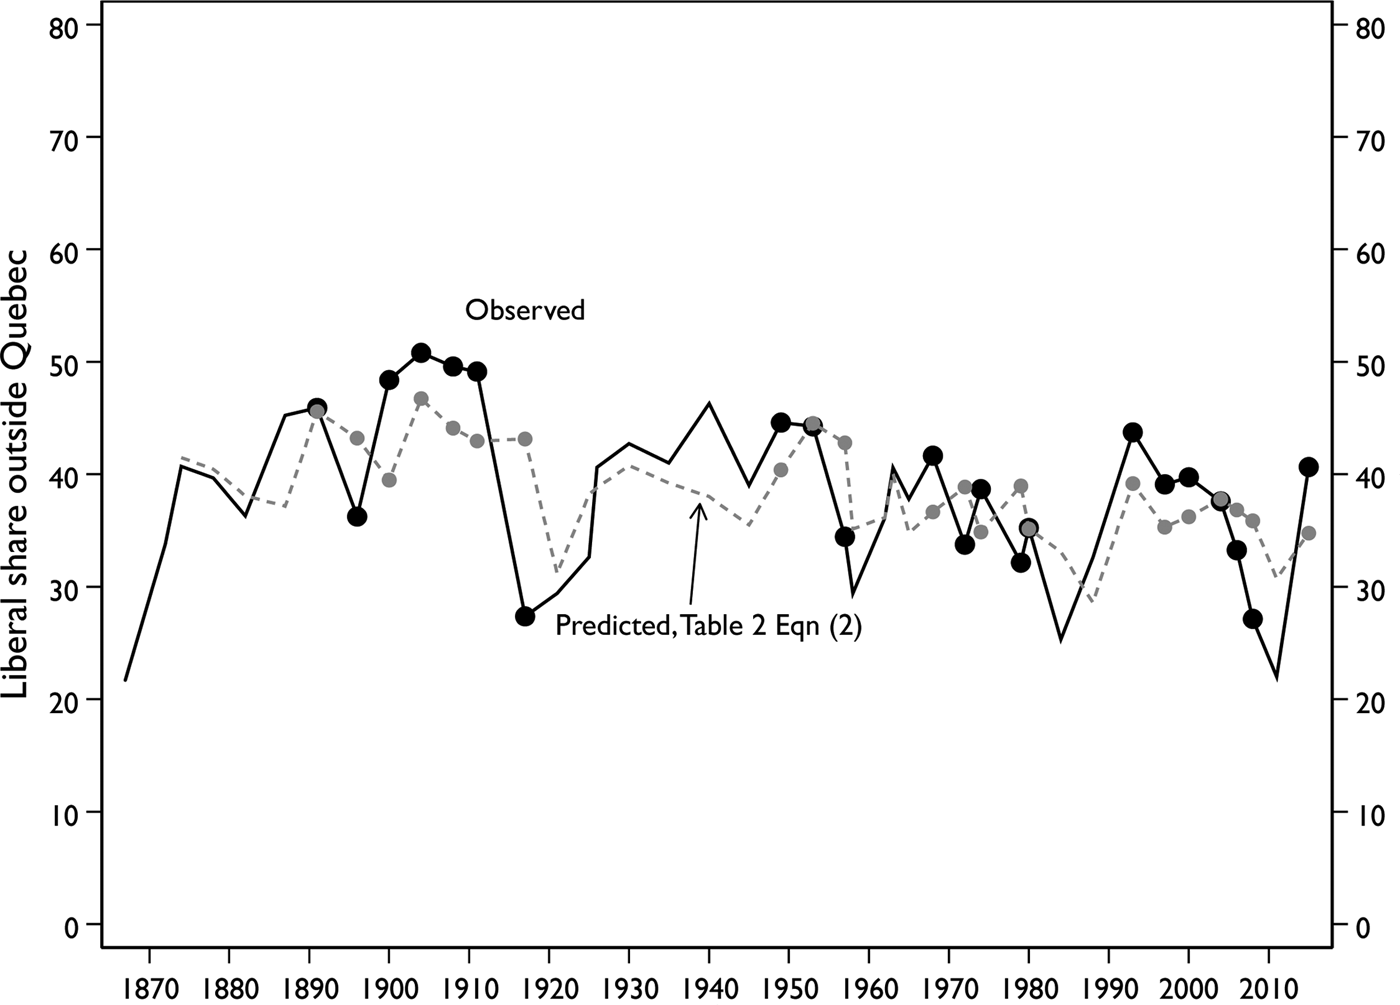
Accordingly, as Figure 2 shows, the dynamics outside Quebec are less remarkable overall than in Quebec and less readily tied to leadership. Consistent with the coefficients in Table 2, both predicted and observed values for years with a Liberal leader from Quebec generally lie above those without one. But consistent with the large standard errors in the table are observations where the opposite is true, and strikingly so: 1917, 1957, 1979, 2004 and 2008. These observations stand in contrast to the Quebec pattern. Where in Quebec the leader tends to exit on a high note, in the rest of Canada the leader's last campaign is often a disaster. The seeds of that disaster may have been planted earlier: in every sequence since 1945, the trend over the Quebecker's prime ministerial career is negative.
Liberal Leader Dynamics outside Quebec
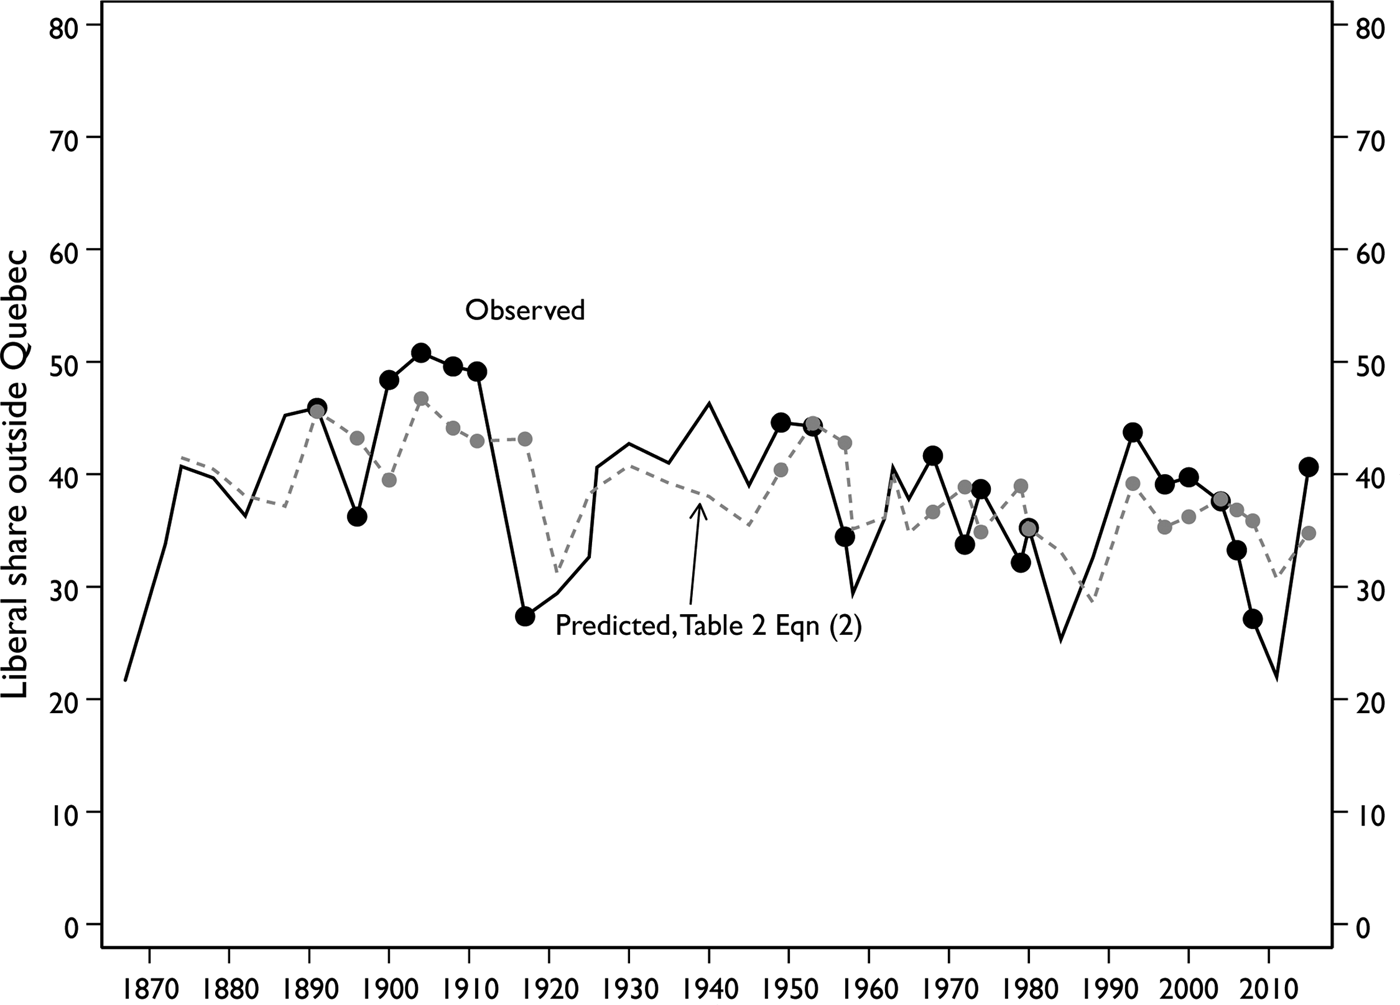
Reversion to a non-Quebec leader is not a magic bullet, however. It is true that the Liberal share went up when Mackenzie King succeeded Laurier. But the initial gain was modest and probably reflected more recovery from the catastrophe of 1917 than the peculiar appeal of King. King's striking gains came later and hardly seem attributable to shedding the Quebec burden. The succession after St. Laurent was similarly unimpressive. Lester Pearson's loss in 1958 was almost as bad as the one in 1917. The recovery in the early 1960s was tepid. Pierre Trudeau clearly dissipated the credit he gained in 1968, but the disaster of 1984 came on John Turner's watch, and 1988 was scarcely better. Arguably, the best way to repair the damage left by one Quebec leader is to replace him—eventually—with another one.Footnote 10
The Person or the Times?
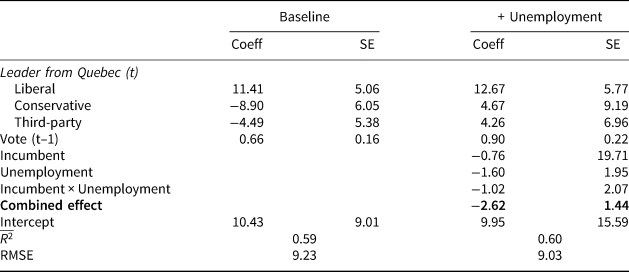
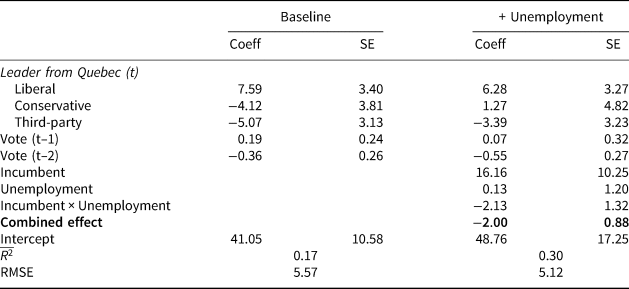
For the conditional impact of unemployment, the presentation is in two stages: the first calibrates 1949–2015 parameters relative to those in the full-period estimations in Table 2; the second shows the augmented estimation with incumbency and unemployment.
The Quebec pattern appears in Table 3. The baseline estimation is quite close to that in Table 2. The Liberal coefficient looks stronger, the Conservative coefficient weaker, and the Quebec ethnonational coefficient also slightly weakened. Only the Liberal coefficient is significantly different from zero. The pattern is basically recognizable, if tilted toward leadership choices by the Liberals. Tests for equivalence of coefficients between the full and truncated series indicate that they are essentially equal.Footnote 11 With this we can move to the estimation that includes incumbency and unemployment.
A Model with Unemployment, Quebec, N = 22
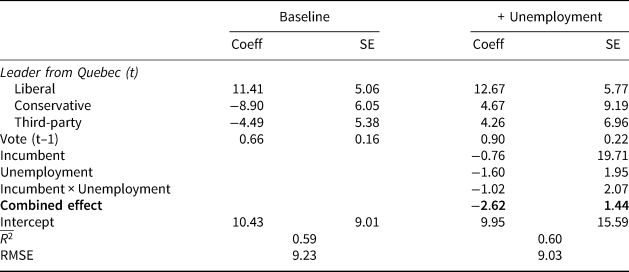
Note: The unemployment series is from Statistics Canada, Table 282-0087. Rate is for Quebec. Combined effect estimated with lincom in Stata.
In the full model, the relative ranking of leader effects remains unchanged, but only the Liberal one remains basically as before. Indeed, it seems strengthened. The other leader coefficients turn into noise: their signs reverse—a nonsense result—and their standard errors expand. The economy itself does seem to matter and in a differential way. Even when the Liberals are out of power, they are affected adversely by unemployment. This pattern may help account for the Liberals’ weak performance in Quebec, as they moved to regain power in 1962–63 and 1993. According to Figure 1, their 1962 share was the lowest to that date since 1887, and their 1963 share, the lowest (1962 aside) since 1911. When the Liberals do attain power, economic impact strengthens: an additional percentage point is added to the impact estimation. Taken separately, neither coefficient is significantly different from zero. More striking, however, is the estimate for the combined effect of incumbency and unemployment—the numbers in bold. Here the coefficient is about 2.5 points and almost twice its standard error. It has a 0.09 chance of being the product of chance covariance.
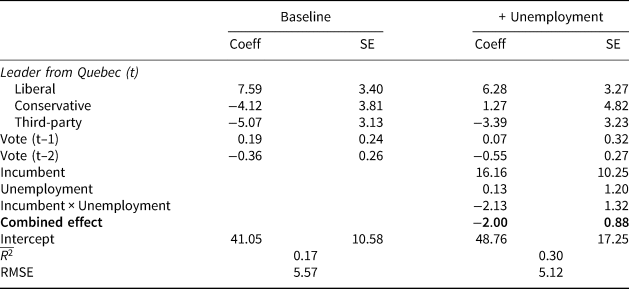
The same patterns appear outside Quebec, according to Table 4. In the baseline estimation, signs on the leader variables are as in Table 2, although now with Liberal leadership more clearly dominant than before. As with the Quebec estimations, the coefficients are indistinguishable from those for the full period.Footnote 12
A Model with Unemployment, Rest of Canada, N = 22
Note: The unemployment series is from Statistics Canada, Table 282-0087. Rate is for Canada.
Combined effect estimated with lincom in Stata.
Adding the incumbency and unemployment terms leaves the Liberal-leader effect in place but upsets the Conservative-leader one, also an echo of the Quebec pattern. Although the economic pattern seems pretty clearly to be incumbent-oriented, it is still positional. Out of power, the Liberals are unaffected by unemployment; in power, they are clearly punished for it. The coefficient is not quite as large as in Quebec, but its estimate is more stable. The probability that the combined effect is the product of chance covariance is less than 0.02.
There is more than a suggestion, then, that some of the apparent leader effects in the full estimations are by-products of the times. Postwar activation of nationalist opinion in Quebec was most intense in recessions. This was a theme in Pinard (Reference Pinard1966, Reference Pinard1975) for the Créditistes and should be one for the Bloc Québécois, as Johnston et al. (Reference Johnston, Blais, Gidengil, Nevitte and Brady1996) suggests. The fact that the Conservatives were faced with a leadership crisis in 1983 reflected concern that the party could be better poised to exploit the opportunity presented by that year's recession. Mulroney's decision to step down in 1993 was clearly influenced by the low state of the party's prospects. Put this way, the leadership options that emerged for voters —for Quebec voters, especially—may have been a transmission belt for economic forces.
The same cannot be said for leader selection by the Liberals. The only transition with remotely plausible economic content was the one in 1984, in the wake of deep economic crisis. By this time, however, Pierre Trudeau's run of power spanned 16 years, with only one brief hiatus. Retirement seemed like a natural career move. The other changes followed an internal organizational rhythm. St. Laurent had been groomed for 1949. His retirement in 1957 followed electoral defeat. Although there were anticipatory signs of the recession of 1958, the economy generally seemed strong in 1957. It also seemed strong in 1968, so much so that the chief economic concern of the time was inflation. Jean Chrétien's timing was fortuitous but dictated mostly by the fact that John Turner had lost two consecutive elections. Jean Chrétien’s displacement by Paul Martin Jr. was fraught, but the infighting that accompanied it was of long standing. It is hard to see the economy in the rapid turnover that followed Martin's time at the helm. And, to go back to the evidence in Table 4, adding the economic dimension leaves the basic pattern intact for Liberal leadership: having a leader from Quebec matters a lot inside that province, there is no suggestion that a Quebecker hurts the party, and there is a strong hint that it helps.
The economic estimations are more suggestive than definitive, however. They require slicing the data very thinly: for the residuals, only 14 degrees of freedom remain in the Quebec estimation and 13 in the non-Quebec one. As section 2 of the online appendix indicates, serial correlation in errors is problematic. In Quebec, the baseline estimation is basically free of such correlation, but adding the economic terms moves the estimation into a danger zone for both first- and higher-order autocorrelation. In the rest of Canada, the autocorrelation pattern is the reverse. Without the economic terms, the estimation appears to harbour first-order autocorrelation. Including the economic terms seems to absorb the autocorrelation, such that the OLS estimation is unbiased.Footnote 13
Conclusion and Discussion
When the Liberal party chooses a leader from Quebec, its vote in the province increases significantly. It is not penalized for this—and may even be helped—in the rest of Canada. On the Quebec side, the pattern helps explain the province's role as the twentieth-century pivot for government (Johnston, Reference Johnston2017). Although the pattern outside Quebec is weaker, the sheer number of voters makes the rest of Canada essential to the overall pattern. At a minimum, voters outside Quebec must not countermobilize. The relative sizes of the electorate, historically roughly 3:1, are such that even a modest adverse reaction outside Quebec could neutralize shifts inside the province. Instead, absolute gains and losses in the rest of Canada roughly match those inside Quebec. And the pattern may be self-fulfilling: since 1960 the party has been led by a Quebecker more often than not. Indeed, dropping the Quebec leader creates a moment of peril.
The essence of the story survives the most obvious omitted-variable challenge, from the macroeconomy. It turns out the economy matters, roughly on the scale and along the policy channel identified by Nadeau and Blais (Reference Nadeau and Blais1993). The exact structure of effect is not the simple retrospective one that they posited, although it clearly has a retrospective component. The component just happens to be conditional on party positioning. Although invoking the economy seems to explain away most of the apparent effect from leaders of parties other than the Liberals, it touches the heart of this article's claim not at all. If anything, bringing the economy into the picture sharpens the relief for Liberal leaders.
The article is largely silent on the mechanisms that produce the main pattern. This is true for both Quebec and the rest of the country. The time path of effect, both as modelled by the partial adjustment framework and as revealed by Figure 1, point away from a simple “favourite-son” type of effect. Only once was the full effect delivered immediately upon accession. This was in 1949 with Louis St. Laurent. That shift might be mere reversion to a normally high level, a reflection of the Liberal party's near-hegemonic domination of Canadian politics in the period. The reversion would be from the crisis moment of 1945, the immediate aftermath of struggle over conscription. What is more, the article is silent on who within Quebec delivers the bump. The “bump” may not be shift in preference so much as abstention by nationalists, augmenting the pattern in Johnston (Reference Johnston2017) (88–89). In recent years, the key group may be anglophones and allophones—rallying to a francophone federalist and falling away when that prospect is no longer dangled. This seems unlikely for earlier years, however. Whatever the pathway, it remains to be explored.
Mechanisms in the rest of Canada are similarly opaque. Nadeau and Blais (Reference Nadeau and Blais1993) refer to “strategic voting”. On this logic, voters outside Quebec register Liberal strength inside Quebec and react accordingly. Since the 1940s, they have had access to poll information. In earlier decades, they would have to base inference on the mere identity of the Liberal leader.Footnote 14 Another possibility is that the Liberal party benefits from a “national unity” vote, where the choice of a Quebecker reaffirms the party's ability to manage the issue. The sign and size of the “third-party” effect in Table 2 also suggests this. Yet another is that leaders from Quebec are, or have become, more competent than their non-Quebec rivals. Their very longevity may attest to this. The difficulty with this argument, of course, is its circularity. For the Liberals at least, the circle is a virtuous one, not one that harms the party for the long run.
The pattern may now be living on borrowed time. Successful, enduring party building in Canada has historically required brokerage. Brokerage is helped by deliberate, multi-decade cycles that enable inter-communal trust to flourish. Long cycles also enable successors to be identified and groomed. Cycles seem to be shortening, even as the very boundary criteria for alternation are being challenged.
That said, a countertrend may also be underway, one that reflects the logic identified by Birnir (Reference Birnir2006). At the core of her argument is that mere representation is a weak claim for an ethnic party. Substantive impact on policy is the ultimate trump, and for Westminster-style parties this means a polyethnic big tent. The 2011 and 2015 elections witnessed the collapse of the Bloc Québécois vote. So long as the Bloc had a strong foothold, it limited the ability of Quebec to serve as the veto player. Although the positive marginal impact of choosing a Quebecker to lead the Liberal party persisted, it operated against a moving baseline that was increasingly distant from the target. If the trend away from the Bloc continues, the old pattern may be restored.
Supplementary material
To view supplementary material for this article, please visit https://doi.org/10.1017/S0008423918001038.
Acknowledgments
Earlier versions of this article were presented at the 2018 Canadian Political Science Association annual meeting, Regina, SK, and at the 2018 Toronto Political Development Workshop, Munk School of Global Affairs and Public Policy, University of Toronto. I am grateful for all comments and advice at those meetings, but especially to J. B. Lewis, Carolyn Tuohy and this journal's anonymous referees. I remain solely responsible for all errors and omissions.