Implications
Lameness is an important welfare and production concern for dairy farms. To establish lameness prevalence on a farm, a sample of cows needs to be assessed. Larger sample sizes provide more accurate results but take longer and incur a greater cost. Sequential sampling provides a means of stopping sampling early without sacrificing accuracy, and can be used to establish whether lameness levels on a farm are acceptable. A sampling protocol is presented that can be applied as part of a targeted surveillance tool, where greater certainty is attached to declaring a farm to have unacceptable levels of lameness.
Introduction
Animal-based measures, or welfare outcome measures are considered to provide a more direct account of welfare compared with resource-based measures (Webster et al., Reference Webster, Main and Whay2004). This change in perception has influenced the way in which welfare assessments are carried out and welfare outcome measures are increasingly being included in welfare assessment protocols. For example, the holistic species specific Welfare Quality protocols consist of predominantly animal-based measures. One of the drawbacks of animal-based measures, however, is that they are time consuming to collect as they require a sample of animals to be observed individually. Lameness in dairy cows is an important concern urgently in need of attention (FAWC, 2009). It is a painful condition (Rushen et al., Reference Rushen, Pombourcq and de Passille2007) that has consequences in terms of production that include milk loss (Amory et al., Reference Amory, Barker, Wright, Mason, Blowey and Green2008), fertility problems (Garbarino et al., Reference Garbarino, Hernandez, Shearer, Risco and Thatcher2004), culling (Booth et al., Reference Booth, Warnick, Grohn, Maizon, Guard and Janssen2004) and costs associated with treatment (Kossaibati and Esslemont, Reference Kossaibati and Esslemont1997). Recent estimates of the levels of lameness suggest that UK farm prevalence levels are increasing, from an average of 21% in 1989/90 (Clarkson et al., Reference Clarkson, Downham, Faull, Hughes, Manson, Merritt, Murray, Russell, Sutherst and Ward1996) to 36% in 2006/07 (Barker et al., Reference Barker, Leach, Whay, Bell and Main2010). There is therefore a need for an assessment, which is both accurate and feasible.
In cases where an agency would charge a fee to carry out a welfare assessment, the cost of this assessment is likely to be partly attributable to the time taken to carry out the assessment, which is a function of the number of animals that are assessed. Hence, an argument has been made for reducing sample sizes to minimise these costs (Sorensen et al., Reference Sorensen, Rousing, Moller, Bonde and Hegelund2007). Sample sizes vary according to the purpose of assessment, and the level at which the estimates are intended to be used. For example, the protocol used by the Red Tractor Assured Dairy Farm Scheme (which assures over 11 000 dairy farms in the UK (CHAWG, 2013)) uses a sample size of 10 cows/farm (where the average UK farm has 125 cows (DairyCo, Reference D’Eath2013)) and is expected to provide accurate estimates for the UK dairy herd as a whole. Similarly, sampling 50 birds/flock (where maximum flock size is 2000 birds and 16 000 birds for Soil Association and Freedom Food certified farms, respectively) provides satisfactory estimates at the farm assurance scheme level, but, this sample size is limited in terms of the accuracy of prevalence estimates it can provide at the individual farm level (Main et al., Reference Main, Mullan, Atkinson, Bond, Cooper, Fraser and Browne2012). At the farm level, which is the focus of this study, larger sample sizes are required as the estimates produced will themselves be of interest rather than simply contribute to an aggregated estimate.
The dilemma therefore, between the need for smaller sample sizes on the one hand, and the need for accuracy on the other, has been addressed in clinical trials through the use of sequential sampling. Smaller sample sizes reduce the financial costs and minimise the exposure of participants to treatments whose effects may still be uncertain. Unlike in a fixed size sampling scheme where a decision is made based on a single large sample, in sequential sampling, a number of smaller samples are drawn in stages, and, there is an option to stop sampling early at each stage. Based on the hypothesis testing approach, sampling error cannot be inflated through drawing multiple samples as error rates are fixed from the outset. The conditions concerning the decision made at each sampling event, whether there is a positive or a negative outcome, or whether further data need to be collected, are based on rules which change dynamically according to the data. Where regular data and safety monitoring of clinical trials is required by independent boards, interim analyses from each sampling event provide the opportunity to assess participants for adverse effects as well as monitor for efficacy or futility of treatment (e.g., Aberle et al. (Reference Aberle, Adams, Berg, Black, Clapp, Fagerstrom, Gareen, Gatsonis, Marcus and Sicks2011) and Dember et al. (Reference Dember, Beck, Allon, Delmez, Dixon, Greenberg, Himmelfarb, Vazquez, Gassman, Greene, Radeva, Braden, Ikizler, Rocco, Davidson, Kaufman, Meyers, Kusek and Feldman2008)). Any number of such interim analyses can be carried out (up to the total number of participants) at any point during the data collection. Published clinical trials have included, for example, a single interim analysis at 66.8% of the sample (Bang et al., Reference Bang, Kim, Yang, Chung, Park, Lee, Lee, Kim, Noh, Cho, Mok, Kim, Ji, Yeh, Button, Sirzen and Noh2012); two interim analyses at 25% and 50% (Ballard et al., Reference Ballard, Truog, Cnaan, Martin, Ballard, Merrill, Walsh, Durand, Mayock, Eichenwald, Null, Hudak, Puri, Golombek, Courtney, Stewart, Welty, Phibbs, Hibbs, Luan, Wadlinger, Asselin and Coburn2006) and two interim analyses at 33% and 66% (Bussel et al., Reference Bussel, Cheng, Saleh, Psaila, Kovaleva, Meddeb, Kloczko, Hassani, Mayer, Stone, Arning, Provan and Jenkins2007).
Sample sizes for a number of sampling events used in the sequential schemes in this study will be derived from the Welfare Quality herd-size-based sampling scheme. The Welfare Quality protocol for dairy cows provides two sampling schemes for herd sizes up to 300 cows. For the more desirable option A, sample sizes range from 30 to 73 cows, and, when option A is not feasible, the smaller sampling scheme, option B, which ranges from 30 to 55 cows, is suggested (P98, Welfare Quality®, 2009). This study will be concerned only with the Welfare Quality ‘A’ scheme. In the protocol this sampling scheme is used to estimate prevalence levels, which are then integrated into aggregated scores. Here, the sample prevalence will be used to test for unacceptability as defined by exceeding a threshold for a given herd level prevalence. The performance of the sampling schemes will be evaluated against the standard fixed size Welfare Quality sampling scheme in terms of accuracy and time taken, where the accuracy can be understood to be the capacity of the test to detect the true state of a herd, and the time taken can be measured in average sample size over multiple simulations of the procedure.
A two-stage sequential sampling scheme involves two samples being drawn with the option of stopping after the initial sample. The decision to continue sampling after the first sample or to draw a second sample concerns rules set relative to the threshold value. These rules relate to the ‘tolerance’ set around the threshold, and are best illustrated by way of an example. For a farm of 120 cows, the Welfare Quality ‘A’ scheme suggests that 54 cows are mobility scored using a three point scale, 0 for not lame, 1 for lame and 2 for severely lame. Where in this situation the interest is only in presence or absence of lameness, both lame and severely lame cows are classified simply as being lame and no differentiation is made. The lameness scores are aggregated to form a sample prevalence, which becomes the estimate of the farm prevalence. If the threshold is set at 30%, a rule to stop early and declare a farm problem-free could be set around a limit of 25%, or at a tolerance level of 5% below the threshold (6.75 lame cows from the first sample of 27). Thus, if after scoring 27 cows, <7 are lame, then sampling could stop after scoring the 27 cows and the farm could be classified as not having a problem. If, on the other hand, >7 are lame, the decision could be taken to sample another 27 cows. Similarly, a rule could also be applied for deciding early that a farm has a problem. In this case a rule could be applied with a tolerance of 5% above the threshold, so where there is >35% lameness (or 9.45 cows from the sample of 27) a farm would be identified as a problem farm. However, if there are between seven and nine lame cows in the first sample drawn, there is less certainty and a further 27 cows would need to be scored. When a second sample is drawn the decision is then based on the original threshold of 30%. A summary of this scheme is presented in Figure 1.
Illustration of a sequential sampling scheme which uses a threshold of 30% to classify a farm with 120 cows and 40% lameness.

Where there is a known farm prevalence, it is possible to test how this scheme performs. By running 100 000 simulations of drawing random samples, the sequential scheme is able to correctly identify a problem farm 95.7% of the time. In terms of the cost associated with the number of animals scored, in the fixed size Welfare Quality sampling scheme this would have been associated with scoring 54 cows, whereas for the sequential scheme, this would be associated with scoring 34 cows on average. This is calculated from the proportion of times when sampling stops early and only 27 cows are scored plus the proportion of times a second sample is drawn and 54 cows are scored.
The example above describes a farm of 120 cows with a lameness prevalence of 40%. If a scheme is used where the total sample size for those farms that need a second sample to be drawn is equal to the Welfare Quality sample size, then, when compared to the fixed size Welfare Quality sampling scheme, (i) there are more incorrectly classified farms (4.2% as opposed to 2.8%); (ii) on average the sample size is greatly reduced (from 54 to 34); and (iii) there is the assurance that sample sizes will not be greater than Welfare Quality sample sizes on any farm.
The sequential scheme involves balancing the need for accuracy with the need for smaller sample sizes. However, if correctly classifying farms was considered to be more important, the sample size in each stage could be increased. For this example, if there were 33 cows in each half, then (i) there would be a mistaken classification 2.8% of the time (a rate equal to that of the fixed sample size scheme); (ii) the expected sample size would be 40 as opposed to 54 (still greatly reduced); however, (iii) on 21.6% of farms 66 cows would be sampled, that is, more than the Welfare Quality fixed size sampling scheme.
The aim of this study is to investigate which sequential sampling schemes are able to provide an optimum balance of accuracy and length of assessment to meet the needs of an on-farm welfare assessment.
Methods
Farm recruitment
Data were used from another much larger study, which looked at a number of different welfare outcome measures collected at different times of year, on organic and non-organic systems. Full details may be found in the study by Rutherford et al. (Reference Rutherford, Langford, Jack, Sherwood, Lawrence and Haskell2009). A brief description of the farm visits, farm recruitment and lameness scoring is detailed below.
Farm visits
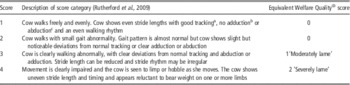
A total of 80 UK dairy farms were recruited, 40 organic and 40 matched non-organic. The farms visited here were visited once during the autumn (September to October) and once in the spring (March to June) with organic and matched non-organic farms visited within a 2-week period. Locomotion scoring was carried out using a four point scale, a simplification of one used previously (Manson and Leaver, Reference Manson and Leaver1988). Details of this scale and how it compares to that used by Welfare Quality is shown in Table 1. All cows in the milking herd were scored upon leaving the milking parlour at either morning or afternoon milking. Locomotion scoring was based on leg movement parameters such as stride length, tracking, adduction or abduction and weight bearing. Inter-observer reliability is reported in the study by Rutherford et al. (Reference Rutherford, Langford, Jack, Sherwood, Lawrence and Haskell2009).
Comparison of locomotion score categories (adapted from Rutherford et al. (Reference Rutherford, Langford, Jack, Sherwood, Lawrence and Haskell2009))

a Tracking: proximity of the hind foot to the print of the fore foot, normal walking would entail having the hind foot placed in the print of the fore foot.
b Adduction: the limb is turned outwards, away from the body, while the hock is turned inwards.
c Abduction: the limb is turned inwards towards the body.
Three two-stage sequential sampling schemes of increasing complexity were investigated, and were compared with a fixed size scheme (the Welfare Quality herd-size-based sampling scheme). For the sequential schemes, the potential (maximum) number of animals sampled (over the two stages) was equal to that of the fixed size sampling scheme, and the number of animals sampled at the first stage was half that number. The sequential sampling schemes investigated were, (1) a basic two-stage scheme, (2) a scheme that placed greater emphasis on correctly identifying ‘problem’ farms and (3) a scheme that incorporated severe lameness as a variable in the decision criterion. Comparison of the schemes to the fixed size sampling scheme was made in terms of accuracy (misclassification rate), and mean sample size (as a proxy for time taken). Accuracy was assessed on all farms irrespective of farm status, but due to farms either being classified as ‘good’ or ‘bad’ it was only possible to calculate either sensitivity or specificity for each farm.
The analyses investigated the effects of changing the threshold and the tolerance, where the threshold was the lameness prevalence used to classify a farm in terms of acceptability, and the tolerance was the range of farm prevalence levels around the threshold used at the first sampling event, to decide whether or not a second sample would be drawn. For each of the models, random samples were drawn from each of the farms according to either the fixed size or the sequential sampling scheme, and consequently each farm was classified as to its lameness status. Both the mean sample size and the misclassification rate were calculated by averaging first across the 80 farms, then across the 100 000 simulations. All analyses were carried out using the program R (version 2.14.1).
Classification of farms in terms of acceptability was based on a threshold set at the mean lameness prevalence (18%). This was an arbitrary value with the potential to bias the results to higher rates of misclassification. Normally the welfare relevance of a threshold would be incorporated through expert opinion. Misclassification rates and mean sample sizes were used as metrics to compare sequential schemes with a fixed size sampling scheme (the herd-size-based Welfare Quality sampling scheme). For the sequential sampling scheme at the first sampling event, half the total sample of the fixed size scheme was drawn. If at that stage, the sample prevalence fell outside a given distance (tolerance) from either side of the threshold, sampling stopped and a farm was classified. Otherwise, if it fell between those limits a second sample was drawn, so that the total number of animals sampled was equal to that of the fixed size scheme. For example, for a farm of 120 cows, a sample of 54 cows was drawn. If the tolerance was set at 10% either side of the threshold, then when using the threshold of 18%, sampling stopped when there were three or fewer lame cows (0.08×27) and the farm was declared ‘good’, or if there were more than eight lame cows (0.28×27) and the farm was classified as a problem farm. If the number was between those limits then a second sample was drawn and a decision was made based on the prevalence from the 54 cows. At that stage, a total of 10 or fewer lame cows in the sample of 54 classified a farm as ‘good’ (0.18×54), whereas >10 lame cows, a problem farm.
Results
The data used in this study consisted of the lameness scoring of 28 559 cows from 80 farms. Lameness prevalence as a proportion, varied from 0.04 to 0.42, with a mean value of 0.18 and the third quartile at 0.22. Severe lameness prevalence (score 4 s) varied from 0 to 0.15 with a mean value of 0.04 and the third quartile at 0.05.
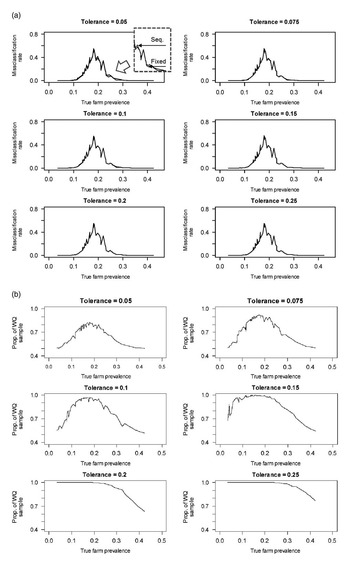
Figures 2a and b show misclassification rates and (relative) mean sample sizes for a basic two-stage sampling scheme compared with the fixed size sampling scheme. By increasing the tolerance around the threshold a second sample is drawn more often. This increases average sample sizes, and hence reduces the misclassification rate. Figure 2a shows that the misclassification rate of the simple and the sequential scheme are visually indistinguishable from each other beyond a tolerance of 0.05, and even at that level, a difference can only be perceived for farms where there is a lameness prevalence of approximately between 0.2 and 0.3. More generally, misclassification peaks where the true farm prevalence is close to the threshold, as these farms are the most difficult to classify. Figures 2a and b show that a tolerance of 0.05 or 0.075 would be the best choice for the basic two-stage sequential scheme depending on the relative importance of mean sample size and misclassification rate. Based on the small additional misclassification rate associated with when the tolerance is at 0.05, all further analyses will assume a tolerance of 0.075.
A comparison of fixed and sequential sampling schemes, in terms of (a) misclassification rate, and (b) relative mean sample size. Sampling schemes used to classify 80 dairy farms, based on 100 000 randomly drawn samples, where a threshold 18% lameness has been applied.

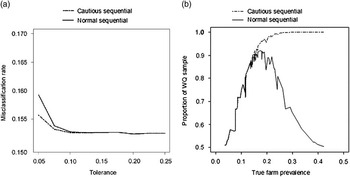
A second (cautious) sequential scheme was investigated that placed greater emphasis on correctly classifying ‘bad’ farms. This was achieved by making an adjustment to the basic sequential model, so that sampling only stopped early when the initial sample drawn indicated that it was a ‘good’ farm. Figure 3a shows lower misclassification rates for the ‘cautious’ scheme, and for a tolerance of 0.075 below the threshold, Figure 3b shows mean sample sizes are greater for farms with higher prevalence compared with the basic sequential scheme (though still much smaller than the fixed size sampling scheme).
A comparison of (a) misclassification rates (with a variable tolerance) and (b) mean sample sizes (with a fixed tolerance of 0.075) for two sequential sampling schemes used to identify ‘good’ and ‘bad’ farms, based on a lameness prevalence threshold of 18%. Sampling schemes used to classify 80 dairy farms, using 100 000 randomly drawn samples, where a threshold 18% lameness has been applied.

A cautious scheme thus provides a way of assuring greater confidence when declaring a farm to be ‘bad’ while still benefitting from smaller average sample sizes on good farms. However, accuracy may be further improved by incorporating a second predictive variable, prevalence of severely lame cows (score 4 s), for a cautious scheme, which is also ‘weighted’. The motivation here is that as there is a correlation of 0.58 between the proportion of cows that are lame on a farm, and, the proportion of the lame cows that are severely lame, then detecting more severely lame cows in a sample should be associated with a ‘bad’ farm. Severely lame cows are given a weight (w) and the sample size is adjusted to accommodate this by the following calculation:
 $$\vskip -1pt \eqalignno{ & {\rm Severity \ adjusted \ prevalence}= \cr &{{\left( {\left( {w{\times}{\rm number \ of \ severely\ lame\ cows}} \right){\plus}{\rm number\ of\ lame\ cows}} \right)} \over {\left( {{{w{\plus}1} \over 2}} \right){\times}{\rm sample\ size}}}$$
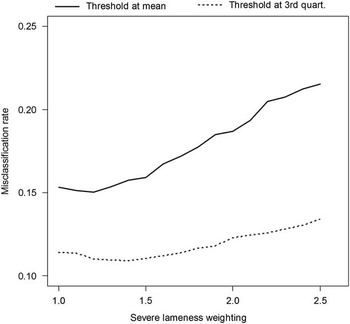
Despite the association, Figure 4 shows that when the threshold is set at the mean (18%) and the tolerance is at 0.075, the misclassification rate shows only a negligible reduction at a weighting of 1.2 before it increases. Upon closer inspection of the data, when the threshold is set at the mean, it can be seen that 24 farms are located within 3% of the threshold. These farms are the most likely to be misclassified and the aforementioned association with severe lameness has been reduced to a correlation of 0.09 for those farms. When the threshold is moved to the third quartile, the number of farms likely to be misclassified is reduced to 18 and the correlation of 0.14 is somewhat stronger, leading to a small reduction in misclassification rate at a weighting of 1.4.
Misclassification rates for a ‘weighted’ sequential scheme, based on 100 000 randomly drawn samples from 80 dairy farms, at two different thresholds.

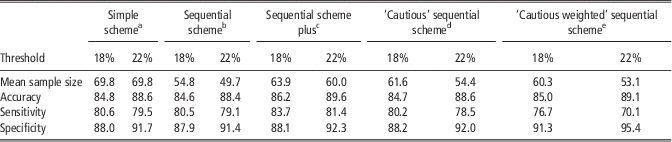
Table 2 presents a summary of the schemes and shows that the sequential schemes are able to achieve comparable levels of accuracy to the fixed size scheme, but with smaller sample sizes. The effect of the threshold can also be seen. The sensitivity of the test, the proportion of farms that have lameness prevalence levels above the threshold which also test as ‘bad’, decreases for the cautious scheme. This is because by no longer stopping early for bad farms, the risk of misclassifying ‘good’ farms as ‘bad’ based on a smaller sample is eliminated. Likewise, the specificity, the proportion of ‘good’ farms which are also classified as ‘good’ increases. This is because there are fewer ‘good’ farms that have been misclassified as ‘bad’. Sensitivity is further increased and specificity is further decreased when severe lameness is incorporated as an additional variable.
Average sample size, accuracy, sensitivity and specificity for different sampling schemes using thresholds set at the mean (18%) and third quartile (22%) for classifying problem farms on 80 UK farms

a Sample sizes based on Welfare Quality.
b Sample sizes based on Welfare Quality with interim sampling at 50%.
c 1.2×(sample sizes based on Welfare Quality with interim sampling at 50%).
d Sample sizes based on Welfare Quality with interim sampling at 50%, stopping early only for farms with prevalences below the threshold.
e Sample sizes based on Welfare Quality with interim sampling at 50%, stopping early only for farms with prevalences below the threshold. Severe lameness prevalence weighted as an additional variable. Weighting 1.2 for analysis at the mean and 1.4 for analysis at the third quartile.
This study has focused on achieving comparable levels of accuracy for sampling schemes that give smaller average sample sizes when compared with a fixed size scheme. An alternative approach might have been to instead focus on increased accuracy. For the ‘sequential scheme plus’, the sample sizes from the basic sequential scheme have been inflated. Here, they have been multiplied by a factor of 1.2 as this provides a reasonable compromise in terms of average sample size. Thus, in comparison with the fixed size sampling scheme, the sequential scheme plus has greater accuracy, and smaller average sample sizes, but, for some farms closer to the threshold, if a second sample is drawn, the sample size for these farms will then be greater.
Discussion
The aim of this study was to develop a feasible and accurate sequential sampling scheme, which could be used to classify dairy farms according to lameness prevalence. While the emphasis could have been on either accuracy or sample size, this study focused on schemes that were as good as a fixed size sampling scheme but benefited from smaller average sample sizes. By using a diagnostic approach, a threshold was used to classify farms in terms of acceptability. Farms with a lameness prevalence close to this threshold were the most difficult to classify, and had the greatest rates of misclassification. In this study, the mean value from the dataset of 80 farms was chosen for the threshold for illustration purposes. As there were generally more farms found around the mean than, for example, the third quartile and it was farms near the threshold that were often misclassified, this resulted in higher rates of misclassification for all methods.
In this study, three two-stage sequential sampling schemes were investigated, all of which had comparable levels of accuracy to the fixed size Welfare Quality sampling scheme, while using smaller average sample sizes. The total potential sample sizes used in the sequential sampling schemes were the Welfare Quality herd-size-based sample sizes, under the assumption that these are in fact acceptable. The first scheme examined here, illustrated the role of the tolerance on both mean sample sizes and accuracy, where it was possible to stop sampling early for both ‘good’ and ‘bad’ farms. Declaring a farm to have unacceptable levels of welfare may potentially have negative financial consequences for farmers. For this reason, there is a greater need for accuracy in making this decision than in declaring a farm to be ‘good’. By only stopping early for ‘good’ farms in the second ‘cautious’ scheme, the decision to classify farms as ‘bad’ was always made based on the larger sample size. This led to a small increase in average sample size, but sample sizes were still greatly reduced compared with the fixed size sampling scheme. The third scheme extended the cautious scheme, and sought to take advantage of the presence of severely lame cows as a risk factor for farms with high levels of overall lameness (Main et al., Reference Main, Barker, Leach, Bell, Whay and Browne2010), and the association found in this study between the proportion of cows which were lame and the proportion of lame cows that are severely lame. However, when the number of severe lame cows was weighted, there were only minimal gains in terms of accuracy and reduction in average sample size. Thus, although the decision to include severe lameness as a factor in the decision criterion was based on a moderately strong overall correlation (0.53), this was not always found to be the case for the group of farms around the threshold. Consequently, for many farms little additional predictive value was added, and higher weightings increased misclassification, especially for farms with lameness prevalence close to the threshold. Therefore, the scheme identified as the most suitable for use as part of a welfare assessment tool is the cautious scheme for which a protocol is included as Supplementary Table S1.
A number of practical considerations should be made if this protocol were to be used. First, as it has been shown that there is no strong association between different welfare indicators (Heath et al., Reference Heath, Lin, Mullan, Browne and Main2014) it is likely that it could only be used for a single welfare indicator and may be best suited as part of a targeted lameness surveillance scheme. Second, a challenge posed by welfare outcome-based assessment in general, is the assumption of random sampling. The most convenient way to sample dairy cows is to mobility score the cows as they are leaving the milking parlour, as this causes minimal disruption to the farm, and an association between milking order and lameness has been identified (Main et al., Reference Main, Barker, Leach, Bell, Whay and Browne2010). Based on this association, an alternative to random sampling has been proposed by Main et al. (Reference Main, Barker, Leach, Bell, Whay and Browne2010) who suggest locomotion scoring up to 100 cows from the middle of the milking order. This scheme has since been found to be able to provide accurate herd level prevalence when also applied to large herds with multiple groups (Hoffman et al., Reference Hoffman, Moore, Wenz and Vanegas2013). In general, though, the question of how a random sample may be achieved on farm can to some extent be considered to be a logistical one, and is common to most sampling schemes. Finally, as assessing the whole herd is rarely feasible, by only scoring a sample of animals, sampling error will inevitably be introduced, and this will be in addition to measurement error associated with inter-assessor reliability (D’Eath, 2012). Automatic lameness detection systems have the potential to offer a solution on both these accounts and remain an interesting area for future development, for example, the GAITWISE system proposed in the study by Maertens et al. (Reference Maertens, Vangeyte, Baert, Jantuan, Mertens, De Campeneere, Pluk, Opsomer, Van Weyenberg and Van Nuffel2011).
The schemes investigated here have used the Welfare Quality sampling scheme and have considered only two stopping points. As the same Welfare Quality sampling scheme is used for a number of different welfare indicators, as it stands, this sequential model could easily be applied to other measures with similar distributions such as body condition score, with careful selection of the threshold. However, the potential for assessing these jointly in a more complex protocol, such as the Welfare Quality protocol, is limited due to the lack of association found between different indicators. Future work could involve including further stopping points, and at the extreme, this could be as many stopping points as there are cows on a farm. By combining sample size inflation from the sequential sampling plus scheme, with additional stopping points, more advanced schemes that optimised both accuracy and sample size could be developed to provide the best of both worlds.
Acknowledgements
Funding for this project was provided by the Agriculture and Horticulture Development Board DairyCo division and AssureWel. The AssureWel project is a collaboration between the RSPCA, the Soil Association and the University of Bristol and is funded by the Tubney Charitable Trust. The authors would also like to thank the following for the collection of the data, along with the farmers that took part, Kenneth Rutherford, Fritha Langford, Mhairi Jack and Lorna Sherwood.
Supplementary Material
For supplementary material/s referred to in this article, please visit http://dx.doi.org/10.1017/S1751731115001536