Implications
Some research has demonstrated that animals finished at pasture had greater n-6 : n-3, conjugated linoleic acid (CLA) and n-3, which may be better for human health. This is interesting because beef cattle in the State of Rio Grande do Sul, Brazil, are produced mostly on natural or improved pastures. Therefore, this study examined the use of different levels of energy supplementation on winter pasture found in southern Brazil or confinement. Our results indicate that moderate levels of grain supplemented on pasture within the range used in this experiment linearly increased the killing-out proportion and carcass weight gain, without causing marked effects on CLA levels or n-6 : n-3 ratio.
Introduction
Beef produced from cattle at pasture has desirable nutritional characteristics and is increasingly valued by consumers as it tends to have higher levels of polyunsaturated fatty acids (PUFAs) and lower ratios of n-3 : n-6 FAs (Schmid et al., Reference Schmid, Collomb, Sieber and Bee2006; Fincham et al., Reference Fincham, Fontenot, Swecker, Herbein, Neel, Scaglia, Clapham and Notter2009; Duckett et al., Reference Duckett, Neel, Lewis, Fontenot and Clapham2013). Research with humans suggests that a lower ratio of n-3 : n-6 FAs is desirable for reducing the risk of many chronic diseases such as cardiovascular disease, cancer, inflammatory and autoimmune diseases (Simopoulos, Reference Simopoulos2008).
Diet could influence FA profile of meat and some research indicates that feeding cattle at pasture compared with typical feedlot diets results in greater concentrations of conjugated linoleic FA (CLA) and more favorable ratio between n-6 : n-3 in beef. This is probably due to the higher intake of PUFA in the pasture diets (Poulson et al., Reference Poulson, Dhimana, Urea, Cornforth and Olsona2004). However, animals finished at pasture may take more time to reach the weight and finish that is required to meet similar grading standards at the packing plant (Roberts et al., Reference Roberts, Kerth, Braden, Rankins, Kriese-Anderson and Prevatt2009) and the meat may be less tender than cattle fed in confinement (Rearte and Pierroni, Reference Rearte and Pieroni2001).
This study aims to evaluate the effects of different levels of pasture supplementation compared with feeding in confinement on animal performance, FA profile of intramuscular fat (IMF) and meat quality.
Material and methods
The study was conducted in the state of Rio Grande do Sul, Brazil. Thirty 3/4 Aberdeen Angus, 1/4 Charolais steers (281 ±16 kg; 16–20 months of age; average body condition score of 4.5 on a nine-point scale) from a commercial herd were used in a completely randomized design.
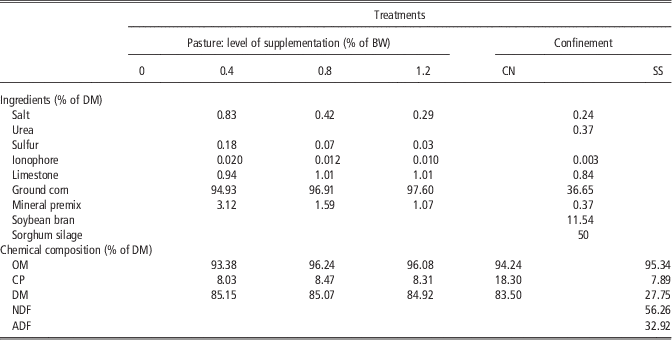
Steers were grazed at pasture or were fed in confinement. At pasture, all animals were kept in the same paddock (11.25 ha). The pasture contained oats (A. strigosa Schreb) and annual ryegrass (L. multiflorum L.). In the first 2 months, the steers were grazed on the same pasture and had free access to water and mineralized salt. After this, they received a concentrate supplement once daily (0700 h) in individual stalls, during 2 months. After returning to pasture, the supplement refusals were weighed (if present). Supplemented steers were randomly allocated to one of four levels of supplementation relative to BW (in dry matter (DM) basis): 0%, (S-0), 0.4% (S-0.4), 0.8% (S-0.8), and 1.2% (S-1.2) of BW. The supplement was an energy-based supplement (corn-based, Table 1) and formulated using the GrazFeed program (2007). The supplemented animals were slaughter when they reached 3.9 to 4 mm of rump fat thickness (RFT) measured each 15 days using an ultrasound with a 6 MHz probe.
Ingredients and chemical composition of the diets

DM=dry matter; CN=concentrated (grain); SS=sorghum silage; OM=organic matter.
Confined (CON) animals, before the confinement period, were grazed in the same pasture as the others steers. After 2 months, they started the confinement period (for about 30 to 60 days), until they reached a RFT of a minimum of 3.9 to 4 mm as measured each 15 days using an ultrasound with a 6 MHz probe to obtain animals with similar degrees of finishing at slaughter. CON animals were fed in individual pens (60 m2 per animal) equipped with automatic waters and individual feeders, at 0900 and 1600 h. The diet was formulated using NRC (1996) with a forage : concentrate ratio of 50 : 50 (DM basis; Table 1). The forage used was chopped sorghum silage (Sorghum bicolor L. Moench; CP-7.89, MO-95.34, NDF-56.26, ADF-32.92, IVDMD-62.2, % of DM ).
Measurement of forage availability
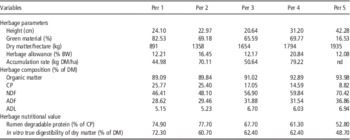
The forage availability of the pasture was determined by using the Sward Stick method (Hodgson, Reference Hodgson1990). The pasture height was measured in at least 200 locations in the experimental area every 28 days and the average value of the measurements was used as an independent variable in linear regression equations using the height measurements and actual forage mass measurements determined on the same date in 15 experimental locations using a square of 0.25 m2. The rate of herbage accumulation was determined using six exclusion cages (0.80 m high and 1.0 m diameter) using the paired cage method (Klingman et al., Reference Klinglman, Miles and Mott1943). It was our aim to maintain a forage mass between 1000 and 1500 kg DM/ha and a minimum height of 20 cm, to maximize animal performance and avoid competition during the grazing process. Initial accumulation was assumed to be 40 kg DM/day and results of the accumulation rate from the previous 28-day period was used thereafter for adjustment of animal stocking rate and calculation of actual supply of DM (Table 2).
Forage availability and bromatological composition of the pasture

Per 1=from July 1 to July 29; Per 2=from July 30 to August 26; Per 3=from August 27 to September 23; Per 4=from September 24 to October 21; Per 5=from October 22 to November 6; DM=dry matter; nd=not describe.
Chemical composition of pasture
The chemical composition of the pasture (Table 2) was determined on samples of pasture collected on day 14 of each experimental period by simulating grazing using hand plucking. Twenty random samples were cut close to the ground to quantify the percentage of green and dead (senescent) material in the pasture. All samples were weighed and dried in a forced-air oven at 60°C for 72 h and then ground in a Willey mill for laboratory testing.
NDF, ADF, lignin (Van Soest and Roberson, Reference Van Soest and Robertson1985), CP (Association of Official Analytical Chemists (AOAC), 1995) and in vitro DM digestibility (IVDMD; Van Soest et al., Reference Van Soest, Wine and Moore1966) were evaluated. The CP degradability of pasture was determined using the nylon bag technique (Sampaio et al., Reference Sampaio, Pike and Owen1985). Silage samples and supplements were collected every two weeks for analyses (Table 1).
Production parameters
The animals were weighed every 28 days, 12 h after removal of feed and water. Feed conversion for the supplement was calculated by dividing the weight gain of the individual animal in each respective period by the weight of supplement eaten.
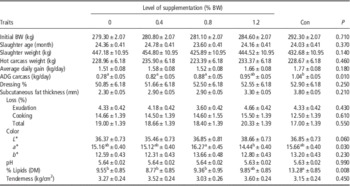
After slaughter, HCW, dressing % (HCW relative to final weight) was based on the BW obtained after 12 h fasting. The carcass adjusted ADG was calculated assuming a dressing percentage of 51% at the beginning of the experiment, the number of days to slaughter and HCW of each calf (Table 3).
Least squares means±standard deviation for carcass and meat traits in cattle fed on pasture with levels of supplementation and in confinement

Con=confinement; P=probability; L*=color parameter lightness; a*=color parameter red-green; b*=color parameter yellow-blue; DM=dry matter.
a,bValues within a row with different superscripts differ significantly.
Meat quality parameters and FAs profile
After cooling, the carcasses were cut at the 13th rib and a sample of the Logissimus dorsi muscle (LM) between the 11th and 13th rib was removed, deboned and divided into two sub-samples of ~8 cm each (A, B). The samples were identified, vacuum packed and frozen immediately for subsequent evaluations of meat quality (Table 3) and FA profile (Table 4).
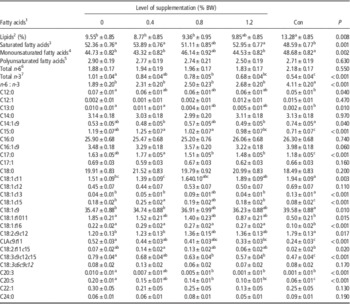
Least squares means±standard deviation for fatty acid profile of intramuscular fat and total lipid content in Longissimus dorsi muscle in cattle fed on pasture and in confinement

Con=confinement; P=probability.
a,bValues within a row with different superscripts differ significantly.
1 The fatty acid are expressed in g/100 g of fatty acid methyl esters.
2 The lipids are expressed in percentage of dry matter.
3 Sum of all saturated fatty acids – C12:0 to C24:0.
4 Sum of C12:1, C14:1, C16:1, C17:1, C18:1 and C22:1.
5 Sum of C18:2, C18: 3, C20:3 and C20:5.
6 Total n-6 – C18:2, C18:3 n-6 and C20:3.
7 Total n-3 – C18:3 n-3 and C20:5.
The first subsample was thawed in the refrigerator, oven-dried at 55°C to 60°C and ground for determination of total lipids in the IMF using the methodology in AOAC (1995). The other subsample, representing the space between the 11th and 12th rib, was designated for laboratory analysis of water loss by exudation. The pH was measured using a digital pH meter (DIGIMED) with electrodes for pH and temperature.
The color of the cuts was determined in the thawed sample with the aid of a portable colorimeter (model XE Mini Scan mark Hunter Lab) with a D65 light source, observation angle of 10° and opening of the measuring cell of 30 mm, using the parameters L* (measures darkness to lightness; lower L* indicate darker color), a* (measures redness; greater a* value indicates a redder color), and b* (measures yellowness; greater b* value indicates a more yellow color) of the CIELab system. The samples were allowed to stand with the surface exposed to the environment for 30 min to allow for myoglobin oxygenation before color measurements. Measurements were taken in triplicate and averaged. The degree of marbling was estimated by comparing the samples with photographic standards (United States Department of Agriculture (USDA), 1999) converted to a range of 2 to 11 points.
After weighing, thermometers were inserted into the geometric center of the samples and placed in a pre-heated (170°C) oven until the core temperature of the samples reached 71°C and then removed (Wheeler et al., Reference Wheeler, Cundiff and Koch1994). The samples were allowed to cool at room temperature (25°C), and then weighed again to determine cooking loss. A manual sampler was used to make six 12.7 mm diameter cylinders for each sample to analyze for tenderness using a Warner Bratzler Shear Force apparatus. The shear force was considered as the average of six cylinders.
In the second subsample, lipids were extracted (Hara and Radin, Reference Hara and Radin1978) and later transmethylated (Christie, Reference Christie1982). A 1 μl aliquot of transmethylated lipid was injected into a gas chromatograph (model-Finnigan Focus GC) with a flame ionization detector and capillary column (CP-Sil 88; Varian Inc®, chemical analysis equipment), 100 m long by 0.25 μm internal diameter and 0.20 μl film thickness). The carrier gas used was hydrogen at a flow rate of 1.8 ml/min. The temperature program of the oven of the gas chromatograph was: started at 70°C with standby time of 4 min, then raised to 175°C (13°C/min) with standby time of 27 min, continued to increase to 215°C (4°C/min) with standby time of 9 min. and finally, an increase of 7°C/min. up to 230°C for 5 min, totaling 65 min. The injector temperature was 250°C and detector was 300°C. The identification of FA was performed by comparison of retention times with those obtained with standard sample esters and quantification of the proportion of FAs was performed using the Chromquest 4.1 software (Thermo Electron®, Rodano, Italy).
Statistics
The supplemented and the confined animals were individually fed, due to this, being considered experimental unit. The statistical analyses were performed using SAS v.9.2 (Statistical Analysis System, 1999), GLM procedure. ADG and supplement conversion between periods, were evaluated as repeated measures on the same experimental unit, using a split plot design according to the model, Y ijk =μ+T i +A j +(AT) ij +P k +(PT) ik +ε ijk where μ is the mean, Y ijk the jth observation associated with the ith treatment (T) of the kth period (P), A j the effect associated with the jth animal; (AT) ij the effect of the jth animal in the ith treatment (Error A), (PT) ik the interaction between ith treatment and kth period of observation and ε ijk the random error (Error B). Fat thickness at the 13th rib and rump showed non-normal distributions using the Shapiro–Wilk test and treatments were compared by nonparametric Kruskal–Wallis tests using the NPAR1WAY procedure of SAS.
The carcass ADG, dressing %, slaughter weight, HCW and meat quality measurements were analyzed using analysis of variance and the model Y ij =μ+a i +c k +ε ij, where Y ij is the observation of the steer j in treatment i for variable Y, μ the average effect and a i the effect of the ith treatment (i=1–5), c k the effect of the kth covariate; ε ij the error associated with the jth steer on the ith treatment. The treatment means were compared using the Tukey test (5%) by PROC GLM. The fat thickness did not follow a normal distribution so were compared using a nonparametric Kruskal–Wallis test.
For analysis of the FAs, the data were analyzed for normality using the Shapiro–Wilk test. The results were submitted to an analysis of variance for analysis of the FA profile. The treatment means were compared using the Tukey test (5%).
Linear, quadratic and cubic regressions of concentrate intake for levels of supplementation on all experimental variables were conducted using the model Y ij =μ+β 1T i +β 2T i 2+β 3T i 3+ε ij where μ is the mean, Y ij the ijth observation of the individuals on the ith treatment (T), β 1, β 2 and β 3 are the regressors associated with the linear, quadratic and cubic effects, respectively, and ε ij the random error associated with each observation.
The experiment was carried out at the Federal University of Rio Grande do Sul, Brazil and animals were cared in accordance with Agronomy School Animal Care Committee.
Results and discussion
The average intake of supplement at pasture was 0.38, 0.67 and 0.96% BW for treatments S-0.4, S-0.8 and S-1.2, respectively. The consumption of supplement at pasture was lower than planned probably due to the high forage availability (1527 kg DM/ha; 14.75% BW) and nutritional quality of the pasture (CP – 18.32%; IVDDM – 61.3%, NDF – 56.34%).
Feeding system (confinement v. pasture) did not affect ADG, slaughter age, slaughter weight, LM area, HCW, subcutaneous fat thickness (SFT; Table 3) and dressing %, however, the carcass ADG was greater in confined animals compared with 0, 0.4% and 0.8% of supplementation. Duckett et al. (Reference Duckett, Neel, Lewis, Fontenot and Clapham2013), when evaluating animals fed corn silage v. different pastures, noted that animals in confinement had a greater ADG, subcutaneous fat, fat thickness and a tendency for greater IMF. Similar results were observed by Blanco et al. (Reference Blanco, Casasu, Ripoll, Panea, Albertı and Joy2010) who found a greater subcutaneous fat and IMF in young bulls fed in confinement (27 mm; 12.8 mm) compared with those fed in confinement+grazing alfalfa (3.3 mm; 11.7 mm), or alfalfa pasture (1.4 mm; 8.5 mm).
When evaluating just the pasture animals, dressing percentage tended to increased linearly (Y=50.97+1.83x; P=0.06; standard error (s.e.)=0.33) and carcass ADG increased linearly (Y=0.76+0.18x; P=0.02; s.e.=0.02) with increased level of supplementation. Roberts et al. (Reference Roberts, Kerth, Braden, Rankins, Kriese-Anderson and Prevatt2009) noted that steers grazing winter annual ryegrass (L. multiflorum L.) fed with increasing levels of corn supplementation (0%, 0.5%, 1%, 1.5%, and 2% of BW) had decreased days on feed (P<0.05) and a linear increase (P<0.05) in ADG as well as preliminary and final dressing %.
Our results suggest that meat quality (pH, tenderness, marbling, parameters b* on the CIE L*a*b* scale, cooking and dripping losses) was not affected by the feeding system or with increasing supplementation level at pasture (Table 3). However, the treatment S-0.8 had greater parameter a* on the CIE L*a*b* scale compared with S-1.2, and luminosity (L*) increased linearly with increased level of supplementation (Y=35.68+2.34x; R 2=0.16; s.e.=0.41; P=0.05) for pasture animals, indicating that the meat was lighter with increased level of supplementation. Others have reported no differences between the color of meat in steers that received different levels of concentrate (French et al., Reference French, O’Riordan, Monahan, Caffrey, Mooney, Troy and Moloney2001; Duynisveld et al., Reference Duynisveld, Charmley and Mir2006).
The meat of grazing animals is often darker than confined animals fed grain-based diets (Bidner et al., Reference Bidner, Schupp, Mohamad, Rumore, Montgomery, Bagley and Mc Millin1986; Bruce et al., Reference Bruce, Stark and Beilken2004). This difference can be attributed to increased SFT in confined animals (slower cooling rate), higher glycogen stores, marbling (Mancini and Hunt, Reference Mancini and Hunt2005) and lower concentrations of myoglobin (Bidner et al., Reference Bidner, Schupp, Mohamad, Rumore, Montgomery, Bagley and Mc Millin1986). However, our study did not find differences between pasture and confinement probably because the confinement diet was 50% sorghum silage.
The percentage of total fat in the meat of supplemented animals was 29% lower in grazing steers than for those fed in confinement (Table 4), with less total lipid up to supplementation of 0.8% of BW. The same were observed by Duckett et al. (Reference Duckett, Neel, Lewis, Fontenot and Clapham2013) who found a greater percentage of fat in the meat for confinement animals.
The IMF of confined animals was significantly lower (Table 4) in saturated fatty acids (SFA; P<0.001) and higher in monounsaturated fatty acids (MUFA; P=0.002) compared with 0 and 0.4% of supplementation treatments. This is probably due to a decrease in biohydrogenation by rumen bacteria. Blanco et al. (Reference Blanco, Casasu, Ripoll, Panea, Albertı and Joy2010) working with young bulls (confinement v. Lucerne grazed) and Duckett et al. (Reference Duckett, Neel, Lewis, Fontenot and Clapham2013) working with Angus steers (confinement v. forage species grazed) found no differences in SFA between confined or grazing animals, but the animals fed in confinement had higher concentrations of MUFA than was found in the current experiment.
The concentration of oleic acid (C18:1 c9) was 11% lower in IMF in steers at pasture supplemented with 0.4% of BW compared with those in confinement (Table 4). No differences were observed in myristic (C14:0), palmitic (C16:0) and stearic (C18:0) FAs, representing 95% of the SFA of IMF. Some research indicates that in finishing systems, the SFAs present in greater quantities in bovine IMF are palmitic, stearic and myristic, respectively (Realini et al., Reference Realini, Duckett, Brito, Dalla Rizza and Mattos2004; Nuernberg et al., Reference Nuernberg, Dannenberger, Nuernberg, Ender, Voigt, Scollan, Wood, Nute and Richardson2005; Garcia et al., Reference Garcia, Pensel, Sancho, Latimori, Kloster, Amigone and Casal2008; Alfaia et al., Reference Alfaia, Alves, Martins, Costa, Fontes, Lemos, Bessa and Prates2009). However, there is high variability in the concentration of these FAs in different experiments and when different diets are fed (French et al., Reference French, O’Riordan, Monahan, Caffrey and Moloney2003; Duynisveld et al., Reference Duynisveld, Charmley and Mir2006; Blanco et al., Reference Blanco, Casasu, Ripoll, Panea, Albertı and Joy2010; Duckett et al., Reference Duckett, Neel, Lewis, Fontenot and Clapham2013).
The concentrations of alpha linolenic acid (C18:3 n-3), eocosapentoic acid (C20:5), and total n-3 FA in IMF of steers at pasture supplemented up to 0.8% BW was greater than in confinement and the concentrations of CLA (C18:2 c9t11) was greater than confinement up to 0.4% BW (Table 4). When examining the data from the pasture animals, there was a linear decrease (−0.189x+0.522; R 2=0.52; P<0.01; s.e.=0.014) in the levels of CLA with increasing levels of supplementation. The n-6 : n-3 ratio in IMF of grazing animals in this experiment was less than 4, which is considered more optimal for human health (Simopoulos et al., Reference Simopoulos, Leaf and Salem1999; Simopoulos, Reference Simopoulos2008).
De Freitas et al. (Reference De Freitas, Lobato, Cardoso, Tarouco, Vieira, Dillenburg and Castro2014) reported similar results to ours when evaluating the IMF profile in LM of 60 purebred Hereford, 1/4 Braford and 3/8 Braford steers finished either in a feedlot or on improved pastures in the state of Rio Grande do Sul. They reported that beef produced exclusively on improved pastures had higher concentration of components that are considered beneficial to human health, such as n-3 FAs, and a lower n-6 : n-3 ratio.
Many studies have reported that grazing animals (Poulson et al., Reference Poulson, Dhimana, Urea, Cornforth and Olsona2004; Fincham et al., Reference Fincham, Fontenot, Swecker, Herbein, Neel, Scaglia, Clapham and Notter2009; Blanco et al., Reference Blanco, Casasu, Ripoll, Panea, Albertı and Joy2010; Duckett et al., Reference Duckett, Neel, Lewis, Fontenot and Clapham2013; De Freitas et al., Reference De Freitas, Lobato, Cardoso, Tarouco, Vieira, Dillenburg and Castro2014) or fed higher levels of forage than concentrate (75 : 25; Phillip et al., Reference Phillip, Oresanya and Jacques2007) have greater concentrations of intramuscular CLA, and increased n-3 : n-6 ratio (Poulson et al., Reference Poulson, Dhimana, Urea, Cornforth and Olsona2004; Blanco et al., Reference Blanco, Casasu, Ripoll, Panea, Albertı and Joy2010; Duckett et al., Reference Duckett, Neel, Lewis, Fontenot and Clapham2013; Guerrero et al., Reference Guerrero, Sañudo, Albertí, Ripoll, Campo, Olleta, Panea, Khliji and Santolaria2013; De Freitas et al., Reference De Freitas, Lobato, Cardoso, Tarouco, Vieira, Dillenburg and Castro2014; Lorenzo et al., Reference Lorenzo, Crecente, Franco, Sarriés and Gómez2014) probably due to higher amounts of PUFA in the diet. The levels of CLA observed in this experiment were slightly higher than those observed by Realini et al. (Reference Realini, Duckett, Brito, Dalla Rizza and Mattos2004) for grazing and confined animals and lower than those observed by Duynisveld et al. (Reference Duynisveld, Charmley and Mir2006). Poulson et al. (Reference Poulson, Dhimana, Urea, Cornforth and Olsona2004) observed similar levels of CLA to this experiment in meat (Longissimus dorsi and Semitendinosus) from feedlot Angus crossbred steers in the USA and higher than those observed for animals finished on pasture or fed pasture throughout their life.
Grazing animal or with moderate levels of grain supplementation have greater concentrations of intramuscular CLA and increased n-3 : n-6, when compared with confined animals.
Conclusion
The ADG, slaughter weight, HCW, marbling and tenderness were not influenced by finishing system or supplementation rate. However, the level of supplementation at pasture resulted in a linear increase in dressing % and carcass ADG. IMF of animals finished at pasture with moderate level of supplementation compared to animals fed in confinement had greater concentration of CLA, linolenic, and n-3, and lower n-6 : n-3 in IMF which may be beneficial for human health.
Acknowledgement
The authors thank to Frigorífico Silva, University of São Paulo and to The Brazilian Angus Association for the financial and resources support, including the use of its installations, equipments, analysis and samples required for the execution of this research.