I. INTRODUCTION
Traditional approaches to making faster chips have been aimed at shrinking the size of the transistors to reduce the distance (channel length) current has to flow.Reference Dennard, Gaensslen, Yu, Leo Rideout, Bassous and Leblanc1, Reference Fischetti2 Another approach is to introduce strain in the channel region to allow electrons to pass through it with less resistance by modulating the valence band of the Si.Reference Oberhuber, Zandler and Vogl3–Reference Reiche, Moutanabbir, Hoentschel, Gösele, Flachowsky and Horstmann7 Compressive and tensile strains are introduced in p- and n-channels of complementary metal-oxide semiconductor (MOS) transistors by adding Ge and C in the source/drain (S/D) regions.Reference Mohta and Thompson4, Reference Reiche, Moutanabbir, Hoentschel, Gösele, Flachowsky and Horstmann7 Both approaches have been implemented simultaneously for over a decade.
Strained silicon is a very thin layer of single-crystal silicon with built-in strain (stress) to accelerate electrons, enabling faster devices. Transistors fabricated with strained silicon are faster due to increased electron mobility and velocity. The concept was first demonstrated in the mid-1980s, and the technology has been evolving ever since.Reference Manasevit, Gergis and Jones8, Reference People, Bean, Lang, Sergent, Stormer, Wecht, Lynch and Baldwin9
Uniaxial strain has been recognized as the preferred strain type for deep-submicron device applications, and localized uniaxial strain, in the channel region, has displaced global biaxial strain as the mobility enhancer of choice. Biaxial strain has been plagued with process integration issues, such as high defect levels, germanium interdiffusion, and poor efficiency in boosting p-MOS transistor performance.Reference Fischetti, Ren, Solomon, Yang and Rim10 Local uniaxial strain processes have been used in enhancing electrical performance of devices since the 90-nm technology node at many companies.Reference Thompson, Armstrong, Auth, Cea, Chau, Glass, Hoffman, Klaus, Zhiyong, Mcintyre, Murthy, Obradovic, Shifren, Sivakumar, Tyagi, Ghani, Mistry, Bohr and El-Mansy11–Reference Chau, Doczy, Doyle, Datta, Dewey, Kavalieros, Jin, Metz, Majumdar and Radosavljević14
Implementation of p-MOS strain engineering started with the simple addition of Ge (up to 20 at.%) into the S/D region. As device dimensions shrink, the complexity of device structures and process control accuracies increases. In advanced devices, Si1−xGex epitaxial layers with higher Ge content (up to 50 at.%) are frequently used to realize increased channel stress. To reduce defect generation in the Si1−xGex/Si interface, multiple Si1−xGex epitaxial layers, with different Ge contents and thickness, are introduced. Heavily B-doped Si1−xGex epitaxial layers used for achieving lower contact resistance in the S/D region also add complexity. The Si1−xGex/Si goes through various thermal processing steps, and certain levels of physical property changes are to be expected after heat treatment at high temperatures.
Thermal behaviors of the Si1−xGex/Si layers during subsequent thermal processing steps should be monitored and understood for effective process integration, quality control, and device yield improvement. Multiwavelength, high spectral resolution micro-Raman characterization of thin epitaxial Si1−xGex layers on Si(100) was performed to investigate the effect of rapid thermal annealing (RTA) on Ge diffusion and Si stress at various temperatures.
II. EXPERIMENT
A. Raman spectra of Si and Si1−xGex/Si
Stress-free Si (100) shows a sharp single, longitudinal optical (LO) phonon Raman peak at 520.3 cm−1 under 180° backscattering measurement configurations due to Raman selection rules.Reference De Wolf15, Reference De Wolf16 The presence of stress or strain in Si causes a shift of the Raman peak (LO phonon peak) position. Raman also is sensitive to deterioration in crystallinity (due to increased defects and variations in dopant concentration and stress within the measurement area). This is seen as changes in the full-width-at-half-maximum (FWHM) of the Raman peak. The change in shift of the Raman peak is proportional to the magnitude of stress in Si [σxx + σyy (MPa) = −434.5 Δω (cm−1)].Reference De Wolf16
Raman spectra from a Si1−xGex epitaxial layer on Si(100) shows four distinctive Raman peaks, all in the wave number (Raman shift) range of 150–550 cm−1, when the probing depth of the excitation wavelength exceeds the thickness of the Si1−xGex epitaxial layer. A peak at 520.3 cm−1 is the Si–Si stretching (optical phonon) mode from the Si wafer. Three peaks in the ranges of 280–310, 390–450, and 500–515 cm−1 correspond to the Ge–Ge, Si–Ge, and Si–Si phonon stretching modes of the specific Si1−xGex epitaxial layer.Reference Alonso and Winer17–Reference Tzeng, Ku, Chang, Yang, Chern, Lin, Hasuike, Harima, Ueda, Ishigaki, Kang and Yoo19 The Si–Si peak of Si1−xGex (i.e., shift of the Si–Si peak of Si1−xGex from the Si–Si peak for a Si wafer) shifts to the lower wave number side by an amount proportional to the Ge content in the Si1−xGex layer.Reference Alonso and Winer17–Reference Vartanian, Ueda, Ishigaki, Kang and Yoo25 Thus, the Ge content can be estimated from the magnitude of the Raman shift of Si–Si peak from the Si1−xGex layer.
B. Raman system requirement
For accurate Si stress and Ge content measurement of Si1−xGex layers, high spectral resolution (∼0.1 cm−1 before curve fitting) and stability is required.Reference Tzeng, Ku, Chang, Yang, Chern, Lin, Hasuike, Harima, Ueda, Ishigaki, Kang and Yoo19–Reference Vartanian, Ueda, Ishigaki, Kang and Yoo25 For best results, the appropriate excitation wavelength must be chosen based on the thickness of the Si1−xGex epitaxial layer. For thin Si1−xGex epitaxial layers, shorter excitation wavelengths, with shallower probing depths, must be chosen. For thick Si1−xGex epitaxial layers, longer excitation wavelengths with deeper probing depths work better. High spectral resolution and a multiwavelength Raman measurement capability are necessary for thorough and complete analysis of Si1−xGex epitaxial layers with various thicknesses.
The spectral resolution and measurement repeatability in conventional monochromator-based Raman systems are not suitable for characterizing high-quality crystalline semiconductor materials due to the use of moving parts, frequent calibration requirement, limited spectral resolution, large image distortion, large (geometric and optical) aberrations, and single-wavelength operation.Reference Tzeng, Ku, Chang, Yang, Chern, Lin, Hasuike, Harima, Ueda, Ishigaki, Kang and Yoo19, Reference Tzeng, Ku, Chang, Yang, Chern, Lin, Hasuike, Harima, Ueda, Ishigaki, Kang and Yoo20, Reference Vartanian, Ueda, Ishigaki, Kang and Yoo25–Reference Yoo, Ueda and Kang27 The accuracy and precision are inadequate. Very high spectral resolution (typically <0.1 cm−1 before curve fitting), measurement repeatability, and long-term stability (also better than <0.1 cm−1) are required for proper characterization and monitoring of high-quality crystalline semiconductor materials such as Si-based semiconductors. The design of a polychromator-based, multiwavelength Raman spectroscopy system, with long focal length (2.0 m) has been reported by Yoo et al.Reference Yoo, Kang, Ueda and Ishigaki26
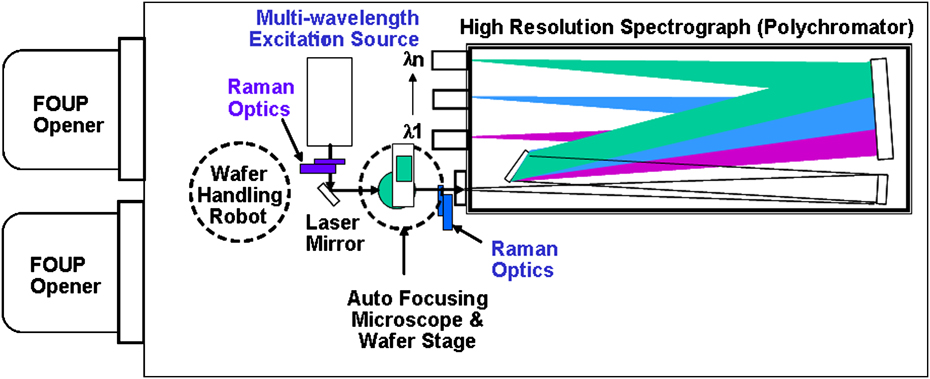
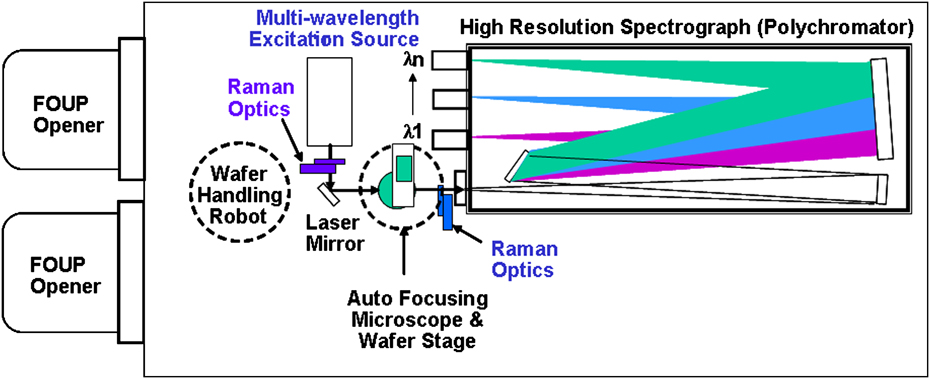
Such a Raman spectroscopy system (MRS-300, San Jose, CA) was designed to overcome the deficiencies in conventional monochromator-based micro-Raman systems. Schematic illustration of the MRS-300 system is shown in Fig. 1. Stress/strain and Ge content in Si1−xGex/Si with different Si1−xGex thicknesses can be monitored in-line. The MRS-300 was designed with no moving parts and a minimum of optical components for improved stability and repeatability, along with a longer focal length for higher spectral resolution. The design concept and performance of the MRS-300 for stressed Si and Si1−xGex/Si characterization applications have been reported by Yoo et al.Reference Tzeng, Ku, Chang, Yang, Chern, Lin, Hasuike, Harima, Ueda, Ishigaki, Kang and Yoo19–Reference Chang, Hong, Lee, Jang Jian, Chuang, Fan, Hasuike, Harima, Ueda, Ishigaki, Kang and Yoo30
Schematic illustration of polychromator-based multiwavelengh Raman spectroscopy (MRS-300) system.
For wide-range Raman scans, in the wave number range of 200–550 cm−1, to verify Raman peaks corresponding to Ge–Ge, Si–Ge and Si–Si bonds in Si1−xGex layer(s) and Si substrates, an additional monochromator-based high-resolution Raman system was used. Five excitation wavelengths (363.8, 441.6, 457.9, 488.0, and 514.5 nm) from ultraviolet (UV) to visible range were used.
C. Sample preparation and Raman characterization
B-doped, single (∼54 nm) and double (∼21 + 54 nm) Si1−xGex layers were epitaxially grown on 300-mm-diameter p−-Si(100) device wafers following 20-nm technology node rules, by chemical vapor deposition. The Si1−xGex/Si wafers were heat treated in the temperature range of 950–1050 °C for 60 s by RTA to investigate the effect of heat treatment temperature on Ge content and Si stress near the Si1−xGex/Si interface of microstructures on rectangular monitoring pads of 50 × 80 μm2 in size.
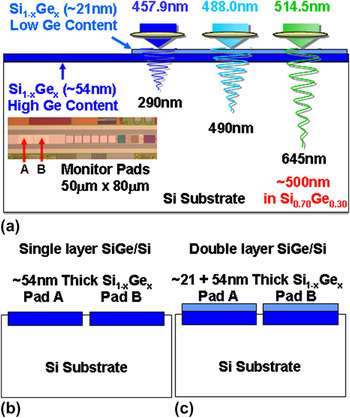
High spectral resolution, multiwavelength, micro-Raman spectroscopy was used as a nondestructive characterization technique. Three excitation wavelengths (457.9, 488.0, and 514.5 nm) were used. The penetration depths of the three excitation wavelengths range from 290 to 645 nm in Si. For Si1−xGex/Si, the penetration depth of a given wavelength varies with Ge concentration. The penetration depth becomes shallower as Ge content in Si1−xGex increases. Figure 2 shows (a) microphotograph and excitation wavelength dependence of the probing depth of Raman measurements on undoped Si0.70Ge0.30 epitaxial layers on Si (100) and cross-sectional illustrations of (b) single-layer Si1−xGex/Si, and (c) double-layer Si1−xGex/Si. Multiwavelength Raman measurements were made on monitor pads A and B [50 × 80 μm2, Fig. 2(a)] inset of a die at the center of wafers. The single-layer Si1−xGex/Si wafers [Fig. 2(b)] have a ∼54-nm-thick Si1−xGex epitaxial layer with a high Ge content of ∼30 at.% on Si (100). The double-layer Si1−xGex/Si wafers [Fig. 2(c)] have a ∼20-nm-thick Si1−xGex top layer with a low Ge content of ∼15 at.% on top of a ∼54-nm-thick Si1−xGex bottom layer with a high Ge content of ∼30 at.% on Si (100). The target B dopant concentrations of top and bottom Si1−xGex epitaxial layers were ∼5.0 × 10¹⁹ and ∼1.2 × 1020 cm−3, respectively.
(a) Microphotograph and excitation wavelength dependence of probing depth of Raman measurement on undoped Si0.70Ge0.30 epitaxial layers on Si (100) and cross-sectional illustrations of (b) single-layer Si1−xGex/Si and (c) double-layer Si1−xGex/Si.

The change of Ge content and thickness of the Si1−xGex layer(s), before and after RTA, were characterized by secondary ion mass spectroscopy (SIMS) depth profiling and high-resolution x-ray diffraction (HRXRD) for verification and comparison with the Raman measurement results. There were slight variations in Raman spectra between the monitor pads A and B. For the sake of simple comparison, Raman characterization results on monitor pad A are only discussed here. The measurement area for micro-Raman, SIMS, and HRXRD are <1 μmφ, ∼10 μmφ, and 100 × 100 μm2, respectively. Thus, the areal resolution of these three characterization techniques differs by four orders of magnitude (∼13,000 times). The depth, lateral, and areal resolution of each characterization technique should be carefully considered when comparing characterization results from different techniques.
III. RESULTS AND DISCUSSION
A. Single-layer Si1−xGex on Si (100)
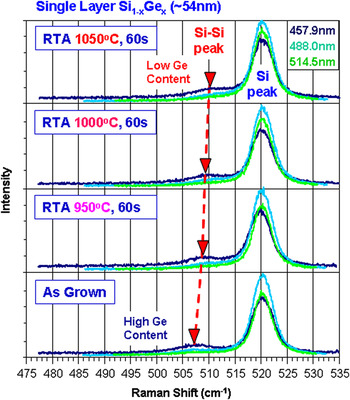
Multiwavelength Raman spectra from monitor pads of the ∼54-nm-thick single-layer Si1−xGex film on Si (100), before and after RTA at 950, 1000, and 1050 °C for 60 s, are shown in Fig. 3. RTA was done in a conventional tungsten–halogen lamp-based RTA system in N2. The nominal Ge content of the Si1−xGex epitaxial layer is ∼30 at.%. The Si–Si peaks from as-grown Si1−xGex epitaxial layer on Si (100) are located at 507.3 cm−1, regardless of excitation wavelength. The Ge content can be calculated from the downward shift of the Si–Si peaks of Si1−xGex epitaxial layer from the stress-free Si peak (520.3 cm−1) divided by the sensitivity of the Si–Si peak position on Ge content (−0.35 cm−1 per Ge at.% for undoped, fully strained Si1−xGex/Si).Reference Tzeng, Ku, Chang, Yang, Chern, Lin, Hasuike, Harima, Ueda, Ishigaki, Kang and Yoo19–Reference Vartanian, Ueda, Ishigaki, Kang and Yoo25 Heavily B-doped (>1.0 × 1019 cm−3) Si1−xGex shifts the Si–Si Raman peak toward the lower wave number side and broadens the peak width (i.e., FWHM). Thus, the B doping induced shift and broadening of the Si–Si peak must be considered to estimate Ge content in B-doped Si1−xGex films. The Ge content of the as-grown Si1−xGex epitaxial layer is estimated to be 31.5 at.%. The Ge content estimated by HRXRD over the two monitor pads (A and B) (100 × 100 μm2) and neighboring Si area was 28.5 at.%. The average Ge content estimated by SIMS depth profile of monitor pad A of as-grown Si1−xGex epitaxial layer was ∼31.5 at.%. The Ge contents estimated by Raman and SIMS showed similar results, within measurement error, and are close to the nominal Ge content of 30 at.%. However, the Ge content estimated by HRXRD showed a large difference (1.5–3.0 at.%) from the nominal Ge content and that estimated by Raman and SIMS analyses. The Ge content of Si1−xGex epitaxial layers on blanket Si (100) wafers estimated by the HRXRD generally showed reasonable agreement with those values estimated by Raman and SIMS.Reference Tzeng, Ku, Chang, Yang, Chern, Lin, Hasuike, Harima, Ueda, Ishigaki, Kang and Yoo19–Reference Vartanian, Ueda, Ishigaki, Kang and Yoo25 The large discrepancy of the estimated Ge content of monitor pads smaller than the effective measurement area of HRXRD severely limits the validity of HRXRD as an in-line monitoring technique for advanced device wafers.
High spectral resolution, multiwavelength Raman spectra from ∼54-nm-thick, B-doped single epitaxial Si1−xGex layer, monitoring pad A on Si (100), before and after rapid thermal annealing (RTA), under various temperatures.

Single-layer Si1−xGex/Si (100) wafers showed systematic upward Si–Si peak shifts with increasing RTA temperature, regardless of excitation wavelength, indicating uniformity with depth. The upward Si–Si shift can be interpreted as the reduction of Ge content in the Si1−xGex epitaxial layer after RTA. Thus, it is suspected that Si1−xGex layer thickness increases while Ge content is reduced due to Ge diffusion into Si during RTA. SIMS depth profiles showed similar trends of increase in Si1−xGex layer thickness with Ge content decrease, after the RTA. While the envelopes of HRXRD rocking curves remained similar, fringes of the HRXRD rocking curve data became a little more distinctive after RTA. Relatively weak diffraction fringes from the as-grown Si1−xGex epitaxial layers (weaker signals, by four orders of magnitude, than the intense signal from the Si substrate) were observed due to the lower HRXRD measurement area coverage in the Si1−xGex epitaxial layer. With the weak diffraction signal from Si1−xGex epitaxial layers and the smearing effect of HRXRD rocking curve fringes after RTA, accurate quantitative analysis of Ge content became even more challenging.
B. Double-layer Si1−xGex on Si (100)
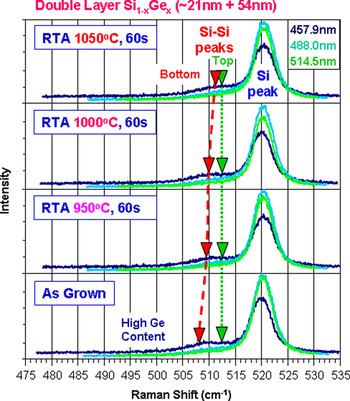
Multiwavelength Raman spectra from monitor pads of double (∼21 + 54 nm) Si1−xGex layers on Si (100), before and after RTA at 950, 1000, and 1050 °C for 60 s, are shown in Fig. 4. The nominal Ge content of the ∼21-nm-thick top Si1−xGex layer and ∼54-nm-thick bottom Si1−xGex layer were 15 and 30 at.%, respectively. For all excitation wavelengths, the dual Si–Si peaks from the as-grown double Si1−xGex epitaxial layer on Si (100) are located at 513.0 and 508.0 cm−1, after deconvolution of the two Si–Si peaks. Two inverted triangles for the 457.9 nm excitation Raman spectra indicate Si–Si peak positions of top and bottom Si1−xGex layers, after deconvolution using Lorentzian curve fitting of the broad “humps.” The Ge content of the double Si1−xGex epitaxial layers is estimated to be 16.0 and 31.1 at.%, respectively.
High spectral resolution, multiwavelength Raman spectra from ∼75 nm (21 + 54 nm) thick, B-doped double epitaxial Si1−xGex layers with different Ge contents, at monitoring pad A, on Si (100), before and after RTA under various temperatures.

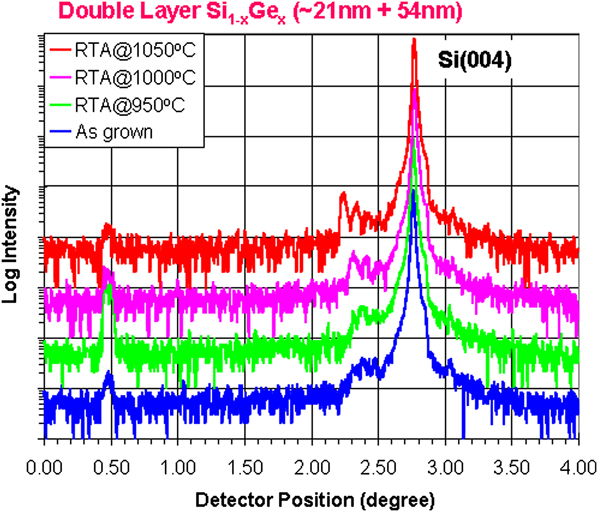
Figure 5 shows HRXRD rocking curves of wafers before and after RTA at 950, 1000, and 1050 °C for 60 s. The rocking curves were measured over the 100 × 100 μm2 area across two 50 × 80 μm2 monitor pads (A and B) and the neighboring Si area. As the RTA temperature increases, intensity of the small peak from the double Si1−xGex epitaxial layers next to the Si(004) substrate peak becomes stronger and fringes becomes clear. The Ge content of top and bottom Si1−xGex epitaxial layers, estimated from the small HRXRD peak, from double Si1−xGex epitaxial layers using a commercially available model, are 8.5 and 35.5 at.%, respectively.
High-resolution x-ray diffraction rocking curves of ∼75 nm (21 + 54 nm) thick, B-doped double epitaxial Si1−xGex layers with different Ge contents, at monitoring pads (A and B) and surrounding Si area, before and after RTA under various temperatures.
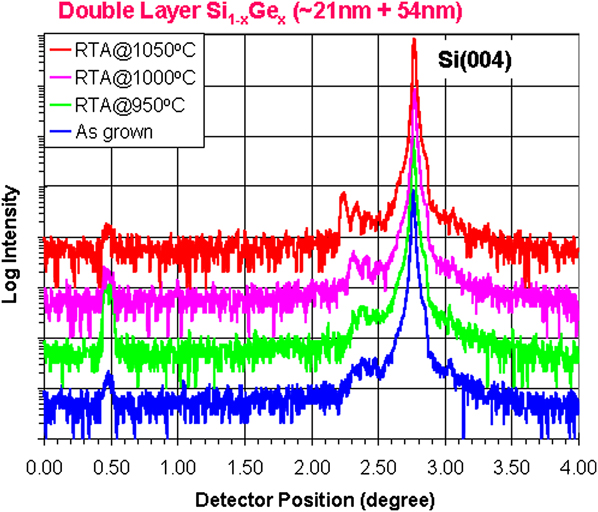
The sharpening of HRXRD fringes from double Si1−xGex epitaxial layers with the increase of annealing temperature was observed. It may be due to the interdiffusion between top and bottom Si1−xGex epitaxial layers during annealing. As the interdiffusion progresses, the boundary between two Si1−xGex epitaxial layers, with different Ge contents and B concentrations, becomes smeared. As a result, the two Si1−xGex epitaxial layers behave like one thick Si1−xGex epitaxial layer with large Ge content and B concentration variations. The disappearance of clear boundaries between two Si1−xGex epitaxial layers may have resulted in the sharpening of HRXRD fringes after high temperature annealing. The temperature dependence of the degree of sharpening supports the idea of interdiffusion. This also explains the poor double-layer modeling results after annealing.
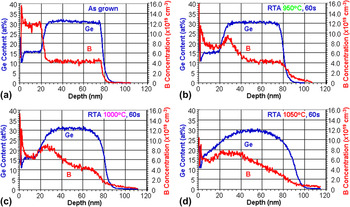
SIMS depth profiles for Ge and B of double Si1−xGex epitaxial layers, before and after RTA, are plotted in Figs. 6(a)–6(d). To show the change of Ge and B dopant profiles, before and after RTA, at various temperatures, the depth profiles were plotted in linear scale. The thicknesses of the as-grown top and bottom Si1−xGex epitaxial layers are ∼21 and ∼54 nm. The average Ge content of as-grown, double Si1−xGex epitaxial layers, estimated by SIMS depth profiles of the monitor pad A, were ∼15.5 and ∼30.8 at.%. The average B concentration of as-grown double Si1−xGex epitaxial layers is 1.2 × 10²⁰ and 4.3 × 1019 cm−3.
Secondary ion mass spectroscopy depth profiles of Ge and B for ∼75 nm (21 + 54 nm) thick, B-doped double epitaxial Si1−xGex layers with different Ge contents, at monitoring pad A, before and after RTA under various temperatures.

The Ge content of as-grown, double Si1−xGex epitaxial layers estimated by Raman and SIMS showed similar results, within measurement error. They are close to the nominal Ge contents of 15 at.% for the top layer and 30 at.% for the bottom layer. At the same time, the Ge content (indicated as 8.5 at.%) of the top layer estimated by HRXRD gives very different results from the nominal Ge content of 15 at.%, and the Ge content of the bottom layer was estimated to be 4.2–5.5 at.% higher than the nominal Ge content indicated by both Raman and SIMS analysis results. The large discrepancy of the estimated Ge contents of both top and bottom Si1−xGex epitaxial layers casts doubt on the usefulness of HRXRD as an in-line Ge content monitoring technique.
The as-grown Ge and B depth profiles are abrupt. As RTA temperature increases, Ge and B diffuse faster and the abruptness of B-doped double Si1−xGex epitaxial layers quickly disappears, even at 950 °C. B diffuses much faster than Ge due to the atomic size and diffusivity differences. The B initially segregates at the surface, by diffusion, and the boundary between double Si1−xGex epitaxial layers then averages out throughout the total thickness of the Si1−xGex epitaxial layers. Because of diffusion, the boundary between the two Si1−xGex epitaxial layers is no longer recognizable after RTA at 1050 °C. The total thickness of Si1−xGex epitaxial layer after RTA at 1050 °C has increased by approximately 20 nm (from ∼80 to ∼100 nm). No B was detected in the Si substrate before RTA, but a significant amount of B was detected in the Si substrate region after the RTA step. The tail of B depth profiles is extended deeper, and the slope of the B tails into the Si substrate as the RTA temperature is increased. It is well known that B is one of the fastest diffusing elements in Si and Si1−xGex,Reference Fahey, Griffin and Plummer31–Reference Christensen34 and so, the SIMS depth profiling results are not surprising at all.
C. Discussions
One of two Si–Si Raman peaks from the bottom Si1−xGex layer of the double-layer Si1−xGex/Si (100) wafers showed systematic upward shifts of the Si–Si peak with increasing RTA temperature, regardless of excitation wavelength (Fig. 4). This upward Si–Si shift implies that the bottom Si1−xGex layer thickness increased, while Ge concentration was lowered through Ge diffusion into Si during RTA. Since the Si–Si peak from the top Si1−xGex layer stayed constant after RTA, the Ge content change of the top Si1−xGex layers is considered to be negligible, if there is any at all. SIMS depth profiles [Figs. 6(a)–6(d)] verified the increase of total Si1−xGex layer thickness and slight decrease of Ge content of the bottom Si1−xGex layer after the RTA speculated from multiwavelength Raman spectra (Fig. 4).
HRXRD rocking curves from the double-layer Si1−xGex/Si (100) (Fig. 5) showed complex envelopes and interference fringes which make reliable interpretation of the HRXRD data more difficult. The double-layer model used in the HRXRD rocking curve assumes abrupt boundaries between layers and constant Ge content within Si1−xGex epitaxial layers. The Ge content of as-grown, abrupt double Si1−xGex epitaxial layers estimated by HRXRD showed significant discrepancy with SIMS depth profiles (top layer: 8.5 at.% versus 15.6 at.%, bottom layer: 35.6 at.% versus 30.9 at.%). Unfortunately, the Ge content estimation, by HRXRD, of diffused double Si1−xGex epitaxial layers after RTA is almost meaningless because HRXRD is not sensitive enough to B concentration below 2.7 × 1019 cm−3.Reference Tzeng, Ku, Chang, Yang, Chern, Lin, Hasuike, Harima, Ueda, Ishigaki, Kang and Yoo19, Reference Hikavyy, Nguyen, Loo, Ryan, Wormington and Hopkins35 Furthermore, it is impractical to estimate both Ge content and B concentration from the very weak signal from double-Si1−xGex epitaxial layers (<100 counts and 3–4 orders weaker than the Si(004) substrate peak).
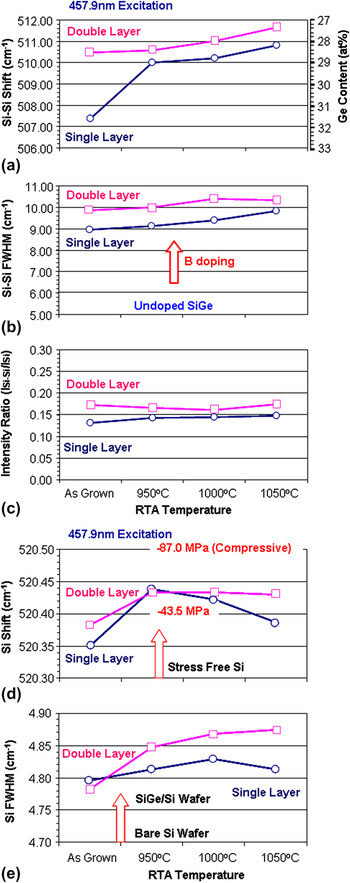
Figure 7 shows a summary of 457.9 nm excitation Raman characterization of the B-doped single epitaxial Si1−xGex layer and B-doped double epitaxial Si1−xGex layers with different Ge contents from monitoring pad A on Si (100), before and after RTA, under various temperatures. The Si–Si peak(s) of the single and double Si1−xGex epitaxial layer(s) were fitted as a single Lorentzian peak for simplicity.
457.9 nm excitation Raman characterization summary of B-doped single epitaxial Si1−xGex layers and B-doped double epitaxial Si1−xGex layers, with different Ge contents, at monitoring pad A, on Si (100), before and after RTA under various temperatures.

The interpretation of Raman shifts and FWHM values of single Si1−xGex epitaxial layer is straight forward. The Raman shift value provides the Ge content of the Si1−xGex epitaxial layer. The FWHM value indicates B dopant concentration in the Si1−xGex epitaxial layer. The increase of B concentration in the Si1−xGex epitaxial layers results in broadening of the FWHM of the Si–Si peak.Reference Tzeng, Ku, Chang, Yang, Chern, Lin, Hasuike, Harima, Ueda, Ishigaki, Kang and Yoo19, Reference Yoo, Ueda, Ishigaki and Kang24 The FWHM for the undoped Si1−xGex epitaxial layer, with a Ge content of ∼30 at.%, is measured to be ∼5.0 cm−1 using the MRS-300 system with 457.9 nm excitation. In contrast, the interpretation of Raman shift and FWHM of the single Lorentzian fitted Si–Si peaks from the double layer is a little more complex. The Raman shift can generally be interpreted as the indication of average Ge content of the double Si1−xGex epitaxial layers. Since the FWHM of single Lorentzian fitted double Si–Si peaks always comes out to be wider than the two FWHM values of the individually Lorentzian fitted Si–Si peaks, B dopant concentration may tend to be estimated as greater than any of the double Si1−xGex epitaxial layers.
As seen in Fig. 7(a), Raman shift values of a single Lorentzian fitted Si–Si peak for both single and double Si1−xGex epitaxial layers showed an upward shift after RTA, indicating monotonic Ge content reduction with increasing RTA temperature, due to Ge diffusion into the Si. The Ge concentration was determined from Raman peaks assuming the both single-layer and double-layer Si1−xGex films are fully strained. The FWHM values of the single Lorentzian fitted Si–Si peak, for both single and double Si1−xGex epitaxial layers, showed 9.0–10.4 cm−1, which is significantly larger than that of undoped Si1−xGex epitaxial layers with Ge content ∼30 at.% [Fig. 7(b)]. An average B concentration of >5.0 × 1019 cm−3 in both single and double Si1−xGex epitaxial layers is expected. These Raman measurements do not distinguish between B outdiffusion and change of Ge content. The intensity ratio of the Si–Si peak to the Si substrate peak (ISi−Si/ISi) of ∼75-nm-thick double Si1−xGex epitaxial layers was slightly larger than that of ∼54-nm-thick single Si1−xGex epitaxial layer, regardless of RTA [Fig. 7(c)]. This intensity ratio of ISi−Si/ISi is as expected. Raman spectroscopy is very promising as a nondestructive in-line monitoring technique for single and double Si1−xGex epitaxial layers, with or without B doping.
The Raman peaks from the Si substrate of all wafers are summarized in Figs. 7(d) and 7(e). The measurements were done at the center of the monitoring pad A (50 × 80 μm2) shown in Fig. 2(a). Since the probing beam size is in the order of <1 μmφ, the geometric effect from the edge of pad is negligible. The Si interface of the as-grown single- and double-layer Si1−xGex/Si was slightly compressive. The Si interface becomes more compressive after RTA at 950 °C. The Si interface stress of a single-layer Si1−xGex/Si became slightly relaxed with increased RTA temperature due to the Ge diffusion indicated in Fig. 7(a). The Si interface stress of the double-layer Si1−xGex/Si stayed constant around −60 MPa after RTA from 950 to 1050 °C. Ge diffuses at the interface of double-layer Si1−xGex/Si, but the ∼21-nm-thick top Si1−xGex layer helped Si stress remain constant even at higher RTA temperatures. The Si stress was simply converted from the Raman peak position of Si. Since the total variation among all wafers is less than 0.1 cm−1, which is equivalent to the resolution (0.105 cm−1/pixel) of measurement under 457.9 nm excitation, it is inconclusive. The FWHM values (4.78–4.88 cm−1) of Si were broader than the value (∼4.70 cm−1) of blanket Si wafers, measured using the MRS-300 system under 457.9 nm excitation [Fig. 7(e)]. The FWHM difference of 0.05 cm−1 is still statistically significant because the spectral resolution of the system, under 457.9 nm excitation, before curve fitting, is 0.105 cm−1.Reference Yoo, Kang, Ueda and Ishigaki26 After curve fitting, a Raman shift of 0.01 cm−1 becomes resolvable. The FWHM of Si of single-layer Si1−xGex/Si was narrower than that of double-layer Si1−xGex/Si after RTA. It indicates the increase of Si stress with the thick Si1−xGex layer and agrees well with behavior of the Si Raman shift.
Multiwavelength, high spectral resolution, micro-Raman spectroscopy has demonstrated the capability for nondestructive characterization of single- and double-layer Si1−xGex/Si in terms of Si stress, Si crystallinity, Ge content, and B concentration of monitoring pads on device wafers. Ge interdiffusion was also detected. The monitoring pad with dimensions of 50 × 80 μm2 can be considered to be wide enough to have biaxial strain, for easy Ge interdiffusion.
As excitation wavelength of the Raman probing light becomes shorter (higher photon energy), the absorption coefficient increases significantly and probing depth becomes shallower.Reference De Wolf15, Reference De Wolf16, Reference Tzeng, Ku, Chang, Yang, Chern, Lin, Hasuike, Harima, Ueda, Ishigaki, Kang and Yoo19–Reference Trigg, Yu, Cheng, Kumar, Kwong, Ueda, Ishigaki, Kang and Yoo28 For improving depth profiling resolution in double Si1−xGex/Si epitaxial layers with thickness below 100 nm, UV and near UV excitation wavelength may be used. One or more of the following candidate wavelengths of 325.0, 363.8, 407.6, and 441.6 nm can be added, depending on the film structures (i.e., thickness, number of layers, Ge contents, B concentration, etc.), to obtain more information.
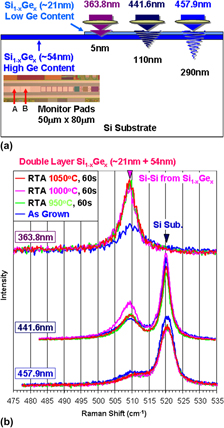
To enhance sensitivity of Raman signals from Si1−xGex/Si epitaxial layers, additional Raman measurements were made under 363.8 and 441.6 nm excitation. Probing depths of 363.8 and 441.6 nm in Si are ∼5 and ∼110 nm, respectively. Figures 8(a) and 8(b) show the probing depths and Raman spectra of double Si1−xGex epitaxial layers on Si under 363.8, 441.6, and 457.9 nm excitation. Under 363.8 nm excitation, Raman spectra show slightly asymmetric peaks around 510 cm−1. Since the penetration depth is too shallow, the excitation laser beam did not reach the Si substrate. Under 441.6 nm excitation, strong Raman peaks from Si substrates, and relatively strong asymmetric peaks from double Si1−xGex/Si epitaxial layers, were measured. Strong excitation wavelength dependence of the probing depth is observed. For high sensitivity depth profiling of Si1−xGex/Si epitaxial layers with thickness to 75 nm, UV to near UV excitation wavelengths (363.8–457.9 nm) seemed to be appropriate.
Excitation wavelength dependence of (a) probing depth and (b) Raman spectra of double Si1−xGex layers on Si under 363.8, 441.6, and 457.9 nm excitation before and after annealing under various temperatures.

UV (363.8 nm) Raman signals, from as-grown double Si1−xGex epitaxial layers on Si, showed a broad and weak asymmetric Si–Si peak due to the high B concentration in the top Si1−xGex epitaxial layer, with low Ge content, and low B concentration in the bottom Si1−xGex epitaxial layer (with high Ge content). After RTA, as low as 950 °C for 60 s, the Si–Si peak became very sharp and strong due to B concentration reduction by thermal diffusion, as verified by SIMS (Fig. 6). However, the intensity and FWHM of Si–Si peak from all annealed wafers are almost identical. This is because the average B concentrations of all annealed wafers within the UV probing depths are equivalent, regardless of RTA temperatures.
Near UV (441.6 nm) Raman spectra showed signals from all Si1−xGex epitaxial layers and Si substrates. As-grown double Si1−xGex epitaxial layers on Si showed a broad and weak asymmetric Si–Si peak. However, the significant variations in Si–Si peaks between annealed wafers were measured. The wafer annealed at 1000 °C for 60 s showed the strongest Si–Si signal, indicating significant dopant redistribution and the resulting overall crystal quality improvement of Si1−xGex epitaxial layers. The wafer annealed at 1050 °C for 60 s showed a weak Si–Si peak with improved symmetry as a result of severe interdiffusion of Ge and B atoms between Si1−xGex epitaxial layers, as indicated by SIMS [Fig. 6(d)].
Longer wavelength excitation Raman measurements also show the same trends, but the Raman signal is less sensitive to the change in between Si1−xGex epitaxial layers (Figs. 4 and 8). Depending on the thickness, structure, and materials of interest, suitable excitation wavelengths can be chosen and integrated into the polychromator-based Raman system design.
From the point of view of practical, in-line monitoring applications, multiwavelength Raman spectroscopy is significantly quicker (seconds per point) than HRXRD (minutes/points) and provides accurate and more valuable insights on single- and double-layer Si1−xGex/Si at various process steps, including RTA. It is extremely important to monitor the process and material properties to optimize and control process conditions in a timely fashion, nondestructively, and in line. Small unexpected variations can have a significant negative impact on device yield in advanced devices. Polychromator-based, high-resolution, multiwavelength micro-Raman spectroscopy is very promising as an in-line Si1−xGex/Si process and material property characterization and monitoring technique.
Raman spectroscopy, HRXRD, and SIMS measure different physical quantities. Raman spectroscopy measures the degree of phonon deformation potential of the lattice. HRXRD measures lattice parameters determined by lattice atoms. SIMS counts the number of secondary ions, after mass separation. For proper characterization of physical properties and proper understanding of mechanisms, a combination of appropriate characterization should be used.
IV. SUMMARY
Boron-doped, single (∼54 nm) or double (∼21 + 54 nm) Si1−xGex epitaxial layers on 300-mm-diameter p−-Si(100) device wafers (20 nm technology node) were prepared, and the effect of RTA in the temperature range of 950–1050 °C for 60 s was studied. The effect of RTA temperature on possible changes of Ge content and Si stress near the Si1−xGex/Si microstructure interface was investigated using high spectral resolution, multiwavelength, micro-Raman spectroscopy as a nondestructive characterization technique. Five excitation wavelengths of 363.8, 441.6, 457.9, 488.0, and 514.5 nm were used for the backscattering configuration. The reduction of Ge content by Ge diffusion at the Si1−xGex/Si interface and the generation of compressive stress at the Si1−xGex/Si interface was measured. The Ge content decrease with RTA, due to Ge interdiffusion, was observed from all Si1−xGex/Si wafers. The accumulation of compressive Si stress showed different behaviors between single- and double-layer Si1−xGex/Si wafers. Raman characterization results were compared with SIMS and HRXRD results. Raman characterization generally agreed well with SIMS results, while significant discrepancies between HRXRD and SIMS results were observed, perhaps due to the large difference, of up to four orders of magnitude, in measurement area. Multiwavelength micro-Raman spectroscopy is very promising as a nondestructive, in-line physical property monitoring technique for microstructures of single- and multilayer Si1−xGex/Si wafers.
ACKNOWLEDGMENTS
The authors thank Chih-Mou Huang, Ruey-Lian Hwang, and Fu-Yuan Tseng of the Taiwan Semiconductor Manufacturing Company (TSMC) Failure Analysis Division (FAND) Department of HRXRD and SIMS analysis.