I. INTRODUCTION
Liver cancer is one of the most common cancers in the world, and the majority of patients with liver cancer will die within one year as a result of the cancer. There is substantial interest in developing therapeutic options for treatment of liver cancer.Reference Ryerson, Eheman, Altekruse, Ward, Jemal, Sherman and Anderson1
At present, chemotherapy plays an important role in dealing with liver tumor, which is mainly based on platinum drugs including cisplatin, carboplatin, and lobaplatin (LBP). The third-generation platinum drug, LBP, has demonstrated its potential in treatment of cancer owing to its high efficiency, no cross-resistance, and low toxicity.Reference Ke, Xia, Qiu, Huang, Yang, Yu and Guo2 The treatment of LBP toward tumor cells is based on the formation of cross-links between DNA double helix and LBP, which destroys the replication function of the DNA template and further inhibits the replication of DNA, leading to the killing of tumor cells.Reference Mukherjee, Mitra, Mahata, Linert and Moi3 However, long-term use of LBP could induce abnormalities of the blood system.Reference Huang, Wei, Huo, Wang, Lu, Wu and Feng4 Therefore, it has been one of the research hotspots to develop a targeted and controlled drug release system to treat patients with malignant tumors,Reference Kanamala, Wilson, Yang, Palmer and Wu5 which can improve local drug concentration, decrease chemotherapy dose, and reduce side effects.
The rapid development of nanodrug has been providing new methods and technologies to solve the above-mentioned problems, thus attracting a great deal of attention from researchers in medicine and materials.Reference Vardharajula, Ali, Tiwari, Eroğlu, Vig, Dennis and Singh6 Nanomaterials, especially those used for the drug delivery in vivo to improve the targeted and drug efficiency and reduce the drug toxicity, have become the breakthrough point toward the development of modern medicine.Reference Kruss, Hilmer, Zhang, Reuel, Mu and Strano7 Carbon nanotubes (CNTs) have been developed as a kind of drug carrier owing to their hollow structure, large specific surface area, outstanding biocompatibility, and excellent cell penetration.Reference Dineshkumar, Krishnakumar, Bhatt, Paul, Cherian, John and Suresh8,Reference Al Faraj, Shaik and Shaik9 However, CNTs are hardly soluble in buffered saline, which induces immunogenicity of CNTs in vivo, and consequently limit the application of CNTs as drug carrier in the biological area.Reference Liu, Wang, Wang, Wang, Cheng, Li and Liu10
Polyethylene glycol (PEG), with superior biocompatibility, was selected to modify CNTs to obtain PEG-grafted CNTs (PEG–CNTs) with improved biocompatibility, solubility, and drug delivery properties.Reference Zhang, He, Liu, Ni and Zhu11–Reference Moghimi, Hunter and Murray13 The grafting of PEG not only reduces the clearance of CNTs by the nonspecific uptake system including liver and spleen but also increases the blood circulation time of CNTs in vivo, and further indirectly increases the duration time of CNTs against targeted tumor cells.Reference Prakash, Malhotra, Shao, Tomaro-Duchesneau and Abbasi14,Reference Lee, Chiou and Wong15 In addition, PEG–CNTs can be metabolized in vivo and excluded from body via urinary system. Therefore, PEG–CNTs showed potential in facilitating the application of CNTs in biomedical domain.Reference Yu, Yuan, Gao, Wei and Xu16
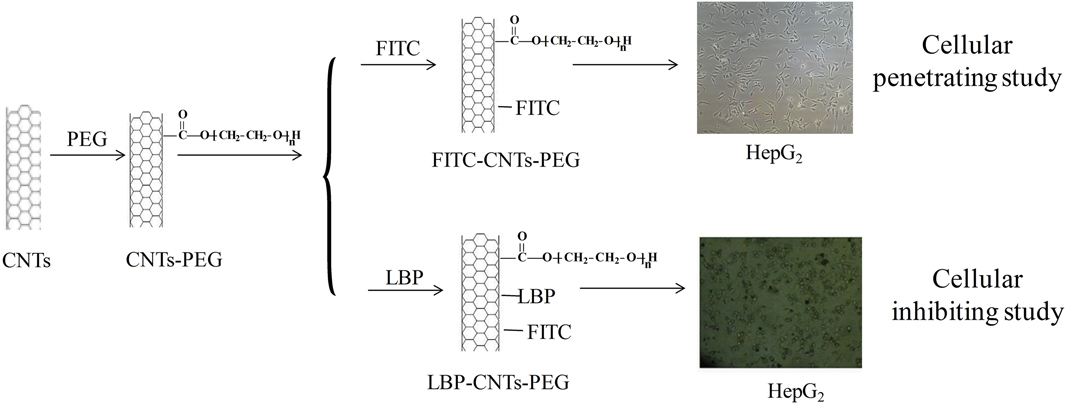
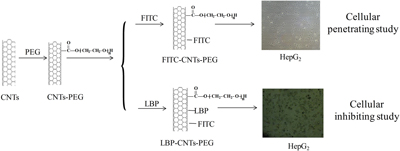
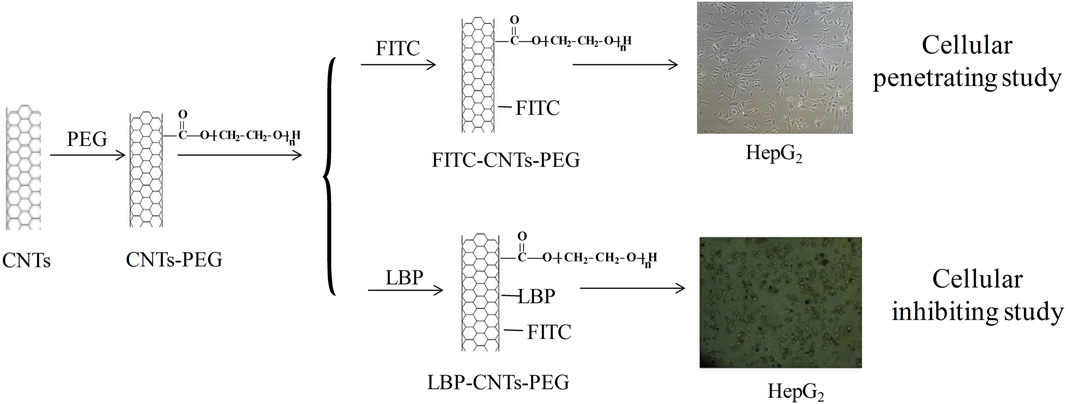
To solve nonspecific targeting and nonselective damage from traditional drug on patients in tumor chemotherapy, PEG–CNTs, with superior histocompatibility, high stability, and low toxicity, were used as the drug carrier in the present study. Fluorescein isothiocyanate (FITC) was used as the fluorescence probe to label PEG–CNTs for observing the cellular uptake of PEG–CNTs and obtaining direct evidence of PEG–CNTs penetrating cytomembrane. Furthermore, by combining LBP with PEG–CNTs, a CNT-based drug delivery system (LBP–PEG–CNTs) was constructed and investigated in terms of its drug loading and releasing capacity and inhibiting effect against tumor. The detailed research scheme is shown in Fig. 1.
Schematic of preparation of LBP–PEG–CNTs along with cellular penetrating of PEG–CNTs and inhibiting of LBP–PEG–CNTs on HepG2.
II. EXPERIMENTAL
A. Materials
CNTs, with the inner diameter of 8–15 nm, length of 0.5–2 μm, specific surface area >233 m2/g, and purity (wt%) >95%, were purchased from Chengdu Organic Chemistry Co., Ltd., China Academy of Sciences (Chengdu, China). N,N-Dimethylformamide (DMF) was obtained from Amresco Company in America and FITC was provided by Shanghai Covet Biological Co., Ltd. (Shanghai, China). Concentrated hydrochloric acid (HCl), concentrated nitric acid (HNO3), concentrated sulfuric acid (H2SO4), and sodium hydroxide (NaOH) were offered by Pharmaceutical Shanghai Reagent Co., Ltd. (Shanghai, China). LBP (purity = 95 wt%) was provided by Zhejiang Haizheng Pharmaceutical Co., Ltd. (Zhejiang, China). DMEM/high glucose medium, penicillin-streptomycin solution, 0.25% trypsin, fetal bovine serum, and human liver cancer cells (HepG2) were obtained from Wuhan Boster Biological Technology Co., Ltd. (Wuhan, China).
B. Preparation of LBP–PEG–CNTs
1. Modification of CNTs by PEG
First, carboxyl groups were introduced onto CNTs: 0.2 g of CNTs were reacted with concentrated HNO3 for 24 h under ultrasonication, and then treated in mixed acid consisting of concentrated HNO3 and H2SO4 (v/v = 3/1) for 4 h. Subsequently, black materials precipitated after standing. The supernatant was removed and the black materials were washed with distilled water, followed by drying under vacuum for 8 h to obtain CNTs containing –COOH, being denoted as CNTs–COOH.
Then, hydrophilic PEG was grafted onto CNTs–COOH by two steps: (i) Acyl chlorination. CNTs–COOH (300 mg) was added into moderate DMF and thionyl chloride. After heated for 10 h with reflux at 60 °C, the reaction system was cooled down to room temperature. The mixtures were filtered by using a 0.48 μm filter membrane, followed by the removal of sulfoxide chloride residues through washing with chloroform (CHCl3) and drying under vacuum at 100 °C to obtain acyl chlorinated CNTs. (ii) Grafting PEG. The acyl chlorinated CNTs were successively reacted with 15 mL of CHCl3, 0.1 mL of PEG, and 40 mL of DMF for 10 h. Then, the reaction system was cooled to room temperature and filtered with a filter membrane. The filter residue was washed with CHCl3 and dried under vacuum at room temperature to obtain PEG–CNTs.
2. Preparation of LBP–PEG–CNTs
First, LBP was purified: A certain amount of LBP was dissolved in ethanol to remove the impurities, followed by distilling to remove ethanol. The purified LBP (250 μg) was dissolved in tridistilled water (50 mL) to prepare 50 μg/mL LBP solution and then reserved at −20 °C after filtration rid of bacterium.
Then, LBP–PEG–CNTs were prepared as follows: PEG–CNTs were dispersed in phosphate buffer solution (PBS, pH = 9.0), which was prepared by adding pH 9.0 NaOH into pH 7.4 PBS. Subsequently, 5 mg/mL LBP was mixed with PEG–CNTs in water bath under ultrasonication for 2 h. After being centrifuged at 5000 rpm for 10 min and washed 10 times with ultrapure water, the supernatant was dried under vacuum at room temperature and the product was obtained, being denoted as LBP–PEG–CNTs. The drug loading (DL) capacity was calculated as follows:
 $${\rm{DL}}\% = \left[ {{{\left( {{m_1} - {m_2}} \right)} / {\left( {{m_3} + {m_1} - {m_2}} \right)}}} \right] \times 100\% \quad ,$$
where m 1 is the mass of total LBP, m 2 is the mass of free LBP, and m 3 is the mass of PEG–CNTs. The LBP–PEG–CNTs were added into PBS solution with diverse pH (pH = 5.0, 6.0, 7.4, and 9.0), and the sample was kept in a shaking incubator. After a while, the ultraviolet-visible (UV-vis) absorption spectrum of the supernatant was tested, and the release curve was drawn according to the accumulate release percentage.
C. Cells penetrability
As a commonly used highly sensitive fluorescent material, FITC was used as the fluorescence probe to label prepared PEG–CNTs (FITC–PEG–CNTs) to further observe the cellular uptake of PEG–CNTs. The penetrability of cells was evaluated using HepG2 cells as the model. The uptake of HepG2 cells on FITC–PEG–CNTs was studied using the flow cytometry (FCM) quantitative method and confocal laser scanning microscopy (LSCM).
1. Preparation of solution
The preparation of FITC DMF solution: 40 mg of FITC was dissolved in 4 mL of DMF to prepare 10 mg/mL of solution. This process was performed without light at room temperature.
The preparation of PBS solution (pH = 5.0): HCl was slowly dropped into PBS solution (pH = 7.4) with buret, and the titration end point was monitored using a pH value detector.
2. Preparation and leakage testing of FITC–PEG–CNTs
In the dark at room temperature, 0.2 g of PEG–CNTs were dispersed into PBS solution (pH = 5.0), followed by dropping into 0.1 mL of FITC DMF solution with a concentration of 10 mg/mL under ultrasonication for 2 h. The as-obtained solution was transferred into ultrafiltration tube and centrifuged at 5000 rpm for 10 min, followed by washing 10 times with ultrapure water to obtain the supernatant and dried. The dried product was denoted as FITC–PEG–CNTs. Afterward, free FITC in the bottom of the tube was collected to measure DL according to the following equation:
 $${\rm{DL}}\% = {\rm{\ }}\left[ {{{\left( {{M_1} - {M_2}} \right)} / {\left( {{M_3} + {M_1} - {M_2}} \right)}}} \right] \times 100\% \quad ,$$
where M 1 is the mass of total FITC, M 2 is the mass of free FITC, and M 3 is the mass of PEG–CNTs.
Leakage testing is carried out as follows: FITC–PEG–CNTs were dispersed into PBS solution (pH = 7.4), which was deposited at 4 °C for two weeks. No obvious change and precipitate were observed. After being transferred into the ultrafiltration tube, the solution was centrifuged at 5000 rpm for 5 min and filtered to obtain filter liquor for measuring the FITC content in it.
FITC–PEG–CNTs were dissolved into PBS solution (pH = 7.4) in water bath under ultrasonication at room temperature. At different time intervals, 1 mL of the solution was taken out and the same amount of FITC–PEG–CNT solution was added. FITC leakage was calculated by measuring the photoluminescence intensity of solution with a luminescence spectrometer.
3. Penetration of FITC–PEG–CNTs on HepG2 liver cells
The average fluorescence intensity of HepG2 at different times was detected by FCM. First, HepG2 liver cells were normally seeded in the nutrient medium in vitro. Once the cells had proliferated to 90% confluence, they were harvested with 0.25% trypsin and dispersed to prepare cell suspension. Then, the cell suspension was centrifuged at 1000 rpm for 5 min to remove nutrient solution and was diluted with the fresh nutrient medium to prepare cell suspension with a density of 1 × 10⁶/mL. They were packaged into 8 centrifuge tubes with 2 mL of cell suspension in each, which were randomly divided into 4 groups. After then, 10 µL of FITC–PEG–CNTs with a concentration of 5 µmol/mL was added into 8 centrifuge tubes containing HepG2 cells, which were incubated at 37 °C at 5% CO2 atmosphere for 0.5, 1, 2, and 4 h, separately. Then, the centrifuge tubes were washed with PBS buffer solution three times. In the end, 100 µL of the PBS buffer solution was added for FCM detection. The test was repeated for 10 times.
The combination of HepG2 and FITC–PEG–CNTs and the average fluorescence intensity of FITC were detected by LSCM. HepG2 liver cells in the logarithmic growth phase were harvested by 0.25% trypsin, seeded in a 35 mm confocal dish with the number of 2 × 10⁵, and cultured at constant temperature incubation (37 °C at 5% CO2) over night. When climbing the half height of slice, the cells were washed with PBS solution three times. Then, the cells were fixed by 4% paraformaldehyde for 20 min, followed by removing paraformaldehyde and washing with PBS solution 2–3 times at room temperature. Then, 1 µmol/L FITC–PEG–CNTs (2 mL) was added into the culture dish for incubation for 20 min, followed by removing the solution with the probe and washing with PBS 2–3 times. After that, phenylindole (DAPI) was added for staining again for 5 min and washed with PBS solution 2–3 times after removing DAPI solution. At last, 100 µL of PBS was added, and the average fluorescence intensity was obtained by observing the images collected from LSCM.
D. Inhibition of LBP–PEG–CNTs on HepG2 cells in vitro
HepG2 liver cells were chosen as the model cell to study the inhibition of LBP–PEG–CNTs on tumor cells and analyze the targeting ability of LBP–PEG–CNTs by the MTT method.
1. Preparation of solutions
a. Preparation of PBS solution
First, KCl (0.2 g), NaCl (8.0 g), KH2PO4 (0.24 g), and Na2HPO4 (1.44 g) were added into a 1000 mL volumetric flask to form mixture. Then, distilled water was added to fully dissolve the mixture. At last, the solution was stored at a refrigerator (4 °C) after sterilization.
b. Preparation of cell culture fluid
DMEM/high glucose culture medium (1 mL), double-anti-body (1 mL), and fetal calf serum (10 mL) were mixed and stored at a refrigerator (4 °C).
c. Preparation of cell cryopreservation liquid
DMEM/high glucose culture medium, fetal calf serum, and sterilized DMSO were mixed at 7:2:1 (v:v:v).
d. Preparation of FITC–PEG–CNT solution
5 mg of FITC–PEG–CNTs were dissolved into 1 mL of deionized water to prepare 5 mg/mL solution, which was stored in a refrigerator at 4 °C in the dark. The solution was diluted 200 times to form 25 μg/mL solution with water before using.
e. Preparation of LBP and LBP–PEG–CNT solution
A certain amount of LBP and LBP–PEG–CNTs were added into PBS buffer solution to form LBP–PEG–CNT solution with LBP concentrations of 0.05, 0.5, 5, and 50 μg/mL, which were labeled and stored in a refrigerator at 4 °C.
2. Inhibition of LBP–PEG–CNTs on HepG2 cells
The density of HepG2 liver cells in the logarithmic phase was adjusted to 2 × 10⁴/mL and coated on a 96-well flat bottom plate (200 μL/well), which was incubated at 37 °C at 5% CO2 atmosphere over the night to make cells growing against the wall. The cells were observed under an inverted microscope. When adherent cells grew to the logarithmic phase, they were cultured in a serum-free medium for 1 day, and then a certain amount of LBP and LBP–PEG–CNTs were added in the normal culture medium to ensure that the concentration of LBP was 0.05, 0.5, 5, and 50 μg/mL. By contrast, the cells of control groups were grown in normal well and black well. Each group had 5 wells. They were again cultured at 37 °C at 5% CO2 atmosphere for 24, 48, and 72 h. MTT solution (20 μL, 5 mg/mL) was added into every well for culturing for 4 h in the dark. After removing nutrient solution from each of the wells, 100 μL of DMSO was added to each of the wells, which were vibrated for 10 min to ensure complete dissolution of the crystal substance. The optical density (OD) was detected by using a microplate reader, and the inhibition rates of LBP with diverse concentration on HepG2 cells at different times were calculated according to the following equation:
 $${\rm{Inhibition}}\;{\rm{ratio}} = \left( {{{1 - {\rm{O}}{{\rm{D}}_{{\rm{experiment}}\;{\rm{group}}}}} / {{\rm{O}}{{\rm{D}}_{{\rm{control}}\;{\rm{group}}}}}}} \right) \times 100\% \quad ,$$
where OD is the OD value, and subscripts stand for the experiment group and control group.
E. Statistical analysis
All the data in this study were analyzed by the statistic package SPSS20.0. The data met normal distribution and were expressed as mean value ± standard deviation. The comparison between two groups and multiple groups was conducted by t-test and variance analysis, respectively. The results were considered to be significant at P < 0.05.
F. Characterization
The transmission electron microscopy (TEM) image was taken on a JEM-2010 microscope (JEOL, Tokyo, Japan). The field emission scanning electron microscopy (FESEM) image was obtained from the JSM-6700F microscope (JEOL, Tokyo, Japan). Fourier transform infrared (FT-IR) spectra were obtained from a TENSOR 27 spectrometer (BRUKER, Karlsruhe, Germany) in the form of KBr pellets.
III. RESULTS AND DISCUSSION
A. Water-solublility of CNTs
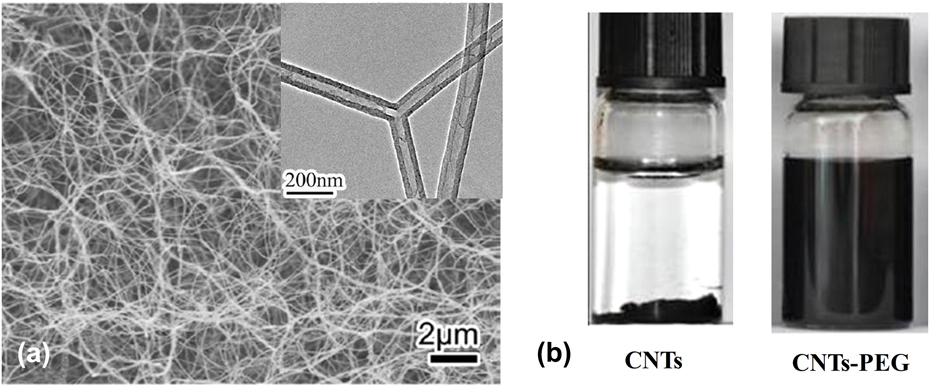
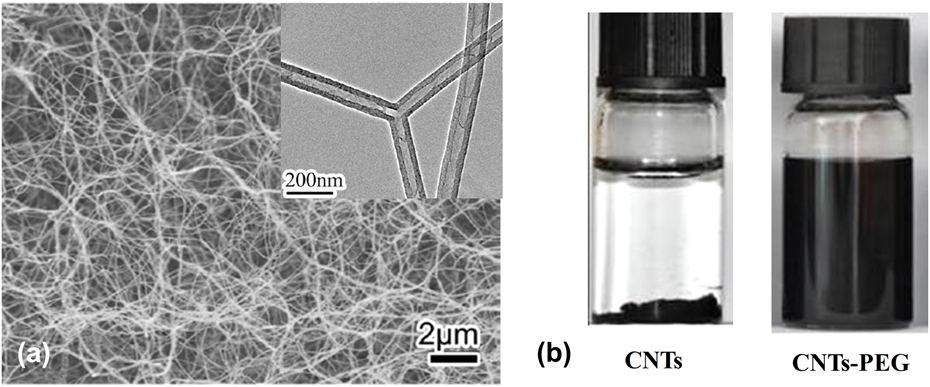
The CNTs were modified by hydrophilic PEG to improve the biological solubility and targeted sustained drug release property of drug-loading CNT composites. The morphology of CNTs was characterized by FESEM and TEM [Fig. 2(a)]. It can be seen that CNTs have a coiling shape with a diameter of about 60 nm and length of several microns. To evaluate the effect of grafting PEG on the dispersibility of CNTs in deionized water, PEG–CNTs and CNTs were separately dispersed in deionized water and held standing for 48 h. The original CNTs aggregated and precipitated in the bottom of container [Fig. 2(b), left], while PEG–CNTs dispersed well in water. The result demonstrates that grafting PEG on CNTs can greatly improve the dispersibility of CNTs.
(a) FESEM and TEM images of CNTs; (b) Photographs of CNTs and PEG–CNTs dispersed in deionized water for 48 h.
B. Penetrability of FITC–PEG–CNTs on HepG2 liver cells
1. Culture of HepG2 liver cells
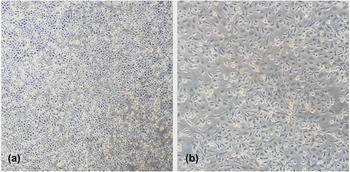
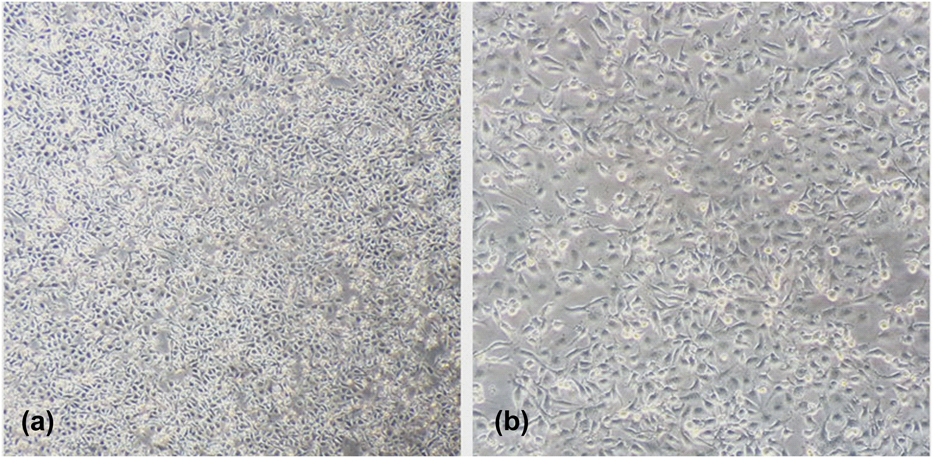
HepG2 liver cells were cultured in the DMEM nutrient medium with 10% fetal calf serum and 1% double antibody for 2 days. The morphology of the cells was observed under an inverted microscope. As shown in Fig. 3, the cells grow against wall with strong transparency in shuttle shape or polygon array.
The morphology of HepG2 observed with inverted microscope: (a) ×100 and (b) ×200.
2. Penetration of FITC–PEG–CNTs on HepG2 liver cells
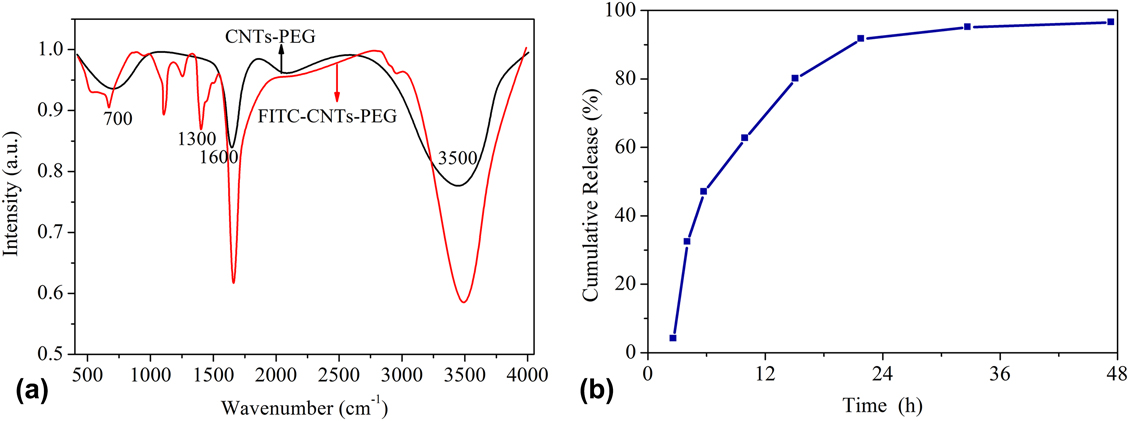
The FT-IR spectra of PEG–CNTs and FITC–PEG–CNTs were compared to verify the grafting of FTTC, as given in Fig. 4(a). FT-IR spectra of PEG–CNTs show characteristic bands at 1600 and 3500 cm−1. A new stretching vibration at 750–1000 cm−1 occurs in FITC–PEG–CNTs, showing the combination between PEG–CNTs and FITC. In addition, small differences between PEG–CNTs and FITC–PEG–CNTs indicate the negligible influence of FITC on the structure of PEG–CNTs.
(a) FT-IR spectra of PEG–CNTs and FITC–PEG–CNTs and (b) cumulative release rate of FITC–PEG–CNTs.
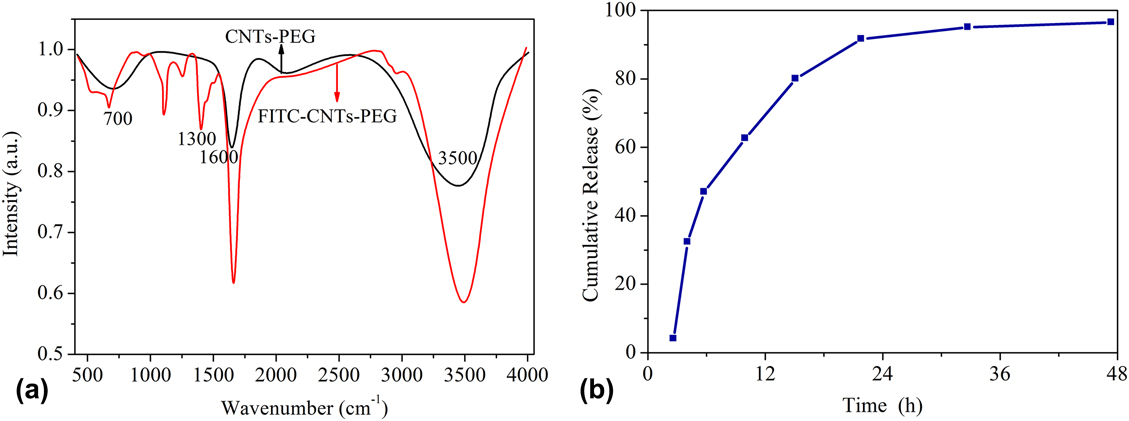
FITC was not detected in filter liquor. As given in Fig. 4(b), the leakage of FITC in PBS (pH = 7.4) is less than 2.0% for 36 h. According to Eq. (2), DL of FITC is calculated to be 43.2%. FITC can be used to label PEG–CNTs by π–π stacking interaction. FT-IR spectra along with leakage test results reveal that PEG–CNTs are labeled by FITC. In addition, FITC is stable in FITC–PEG–CNTs, and it is confirmed that FITC can be used for fluorescence labeling on cells.
FITC, with thiocyanic acid groups, is a kind of green fluorescent material with high sensitivity and can combine with CNTs by π–π stacking. By virtue of this property, FITC was combined with water soluble and stable PEG–CNTs, as demonstrated by FT-IR [Fig. 4(a)] and accumulate release of FITC [Fig. 4(b)]. Furthermore, the fluorescence intensity of FITC–PEG–CNT solution was detected by fluorescence spectrometry, showing that the leakage rate of FITC is below 2.0% for 36 h. The results demonstrate the strong combination between FITC and PEG–CNTs.
As given in Table I, FCM detection results show that the average fluorescence intensity of HepG2 is time-dependent, that is, it gradually increases with the prolonged incubating time of HepG2 with FITC.
Comparison of average fluorescence intensity from HepG2 incubated with FITC for different times  $\left( {\bar{x} \pm S} \right)$.

a Compared with the group with an incubating time of 0.5 h, P < 0.05.
b Compared with the group with an incubating time of 1 h, P < 0.05.
c Compared with the group with an incubating time of 2 h, P < 0.05.
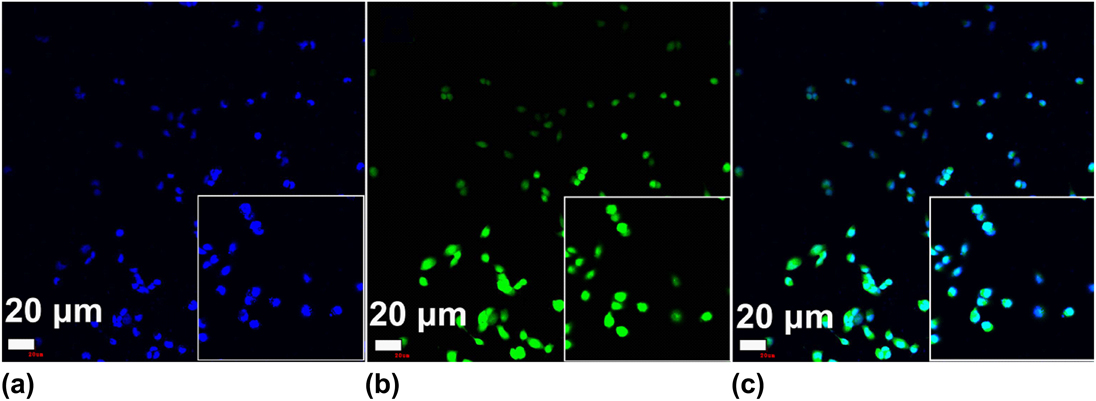
LSCM was used to observe the uptake of the cells on FITC–PEG–CNTs, as shown in Fig. 5. DAPI and FITC emit bright blue and green fluorescence, respectively [Figs. 5(a) and 5(b)]. The overlay of DAPI and FITC is shown in Fig. 5(c). It can be seen from Fig. 5(c) that about 85% of the cells fuse and the average fluorescence intensity of the cells reaches 743.41 ± 121.36, indicating that FITC-modified PEG–CNTs is easy to be internalized by cells and thus can be used as a drug carrier for inhibiting tumor.
(a) Blue-fluorescence of DAPI; (b) Green-fluorescence of FITC; (c) Stacking of fluorescence from DAPI and FITC (×200).

C. Release and inhibition ability of LBP–PEG–CNTs
1. Controlled-release of LBP–PEG–CNTs in tumor cells
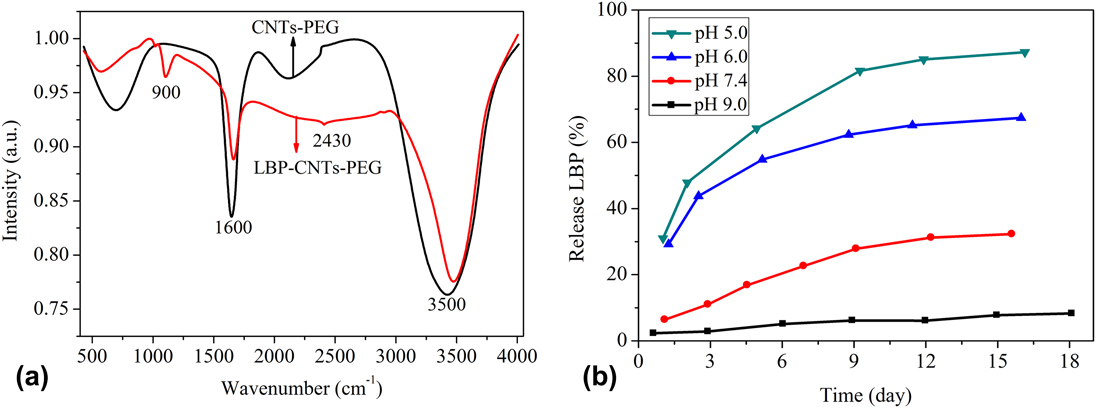
To verify the combination between PEG–CNTs and LBP–PEG–CNTs, FT-IR spectra were obtained to explore their surface functional groups, as shown in Fig. 6(a). FT-IR spectra of PEG–CNTs show characteristic bands at 1600 and 3500 cm−1. Moreover, new vibrations at 900 and 2430 cm−1 appear in FT-IR spectra of LBP–PEG–CNTs, which demonstrate that LBP is loaded onto PEG–CNTs.
(a) FT-IR spectra of PEG–CNTs and LBP–PEG–CNTs and (b) release curves of LBP from LBP–PEG–CNTs in PBS with different pH.
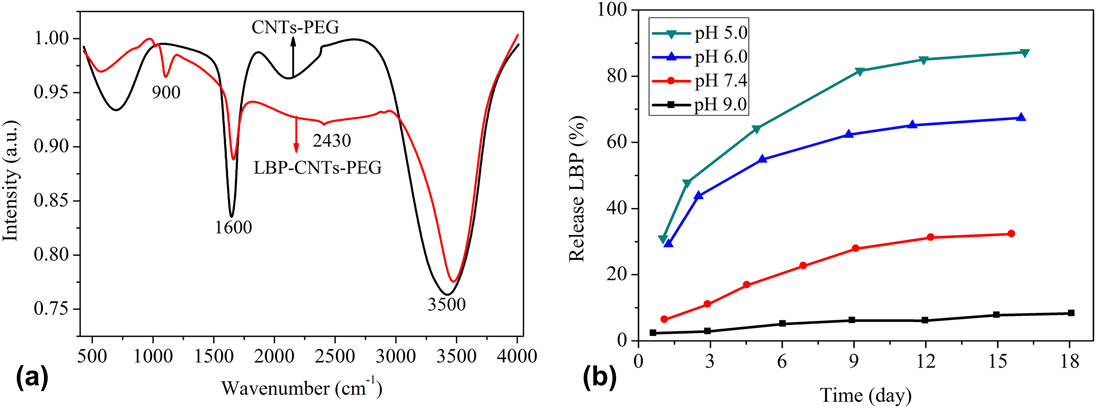
Figure 6(b) exhibits the release curves of LBP from LBP–PEG–CNTs in vitro. It can be seen that the release amount and rate of LPB depend on the pH value of the PBS buffer solution. LBP is easier to release in pH 5.0 PBS than in pH 7.4 PBS. At a moderate interval of 9 days, a cumulative release amount of LBP is up to 80% at pH 5.0, while that of LBP is less than 5% at pH 9.0, indicating that the release of LBP decreases with the increase of the pH value. In one word, LBP is easy to release under acidic conditions and slow to release under neutral conditions, but difficult to release under basic conditions.
2. Inhibition of LBP–PEG–CNTs against HepG2 liver cells
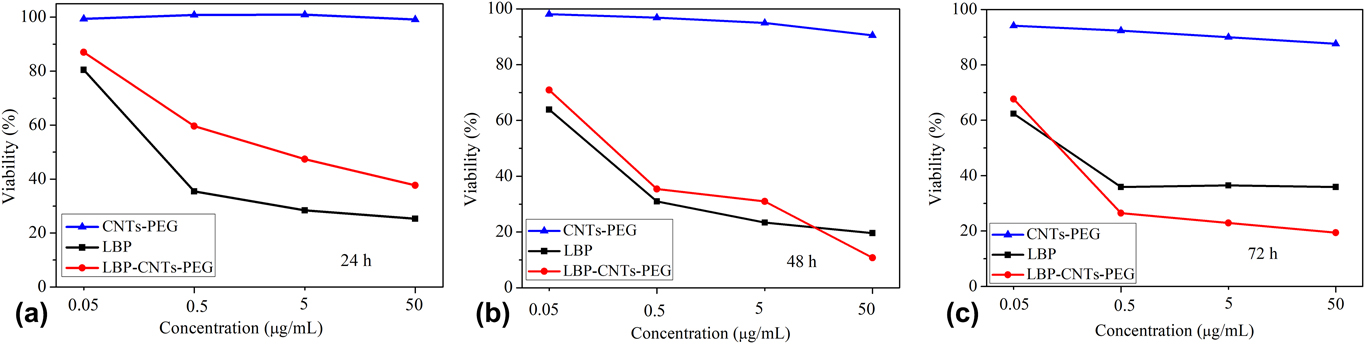
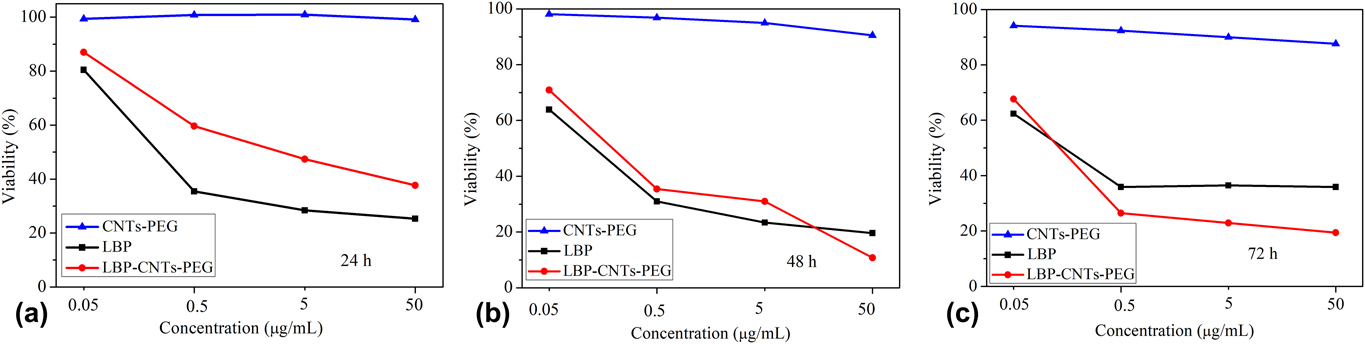
Figure 7 presents the inhibition abilities of LBP and LBP–PEG–CNTs with concentrations of 0.05, 0.5, 5, and 50 μg/mL on HepG2 cells at different exposed times. The inhibiting effect of LBP on HepG2 liver cells is higher than that of LBP–PEG–CNTs at 24 h of exposed time. As exposed time increases to 48 h and LBP concentration increases to 50 μg/mL, the inhibition ratio of LBP–PEG–CNTs is higher than that of LBP. With the exposed time further extends to 72 h, the inhibition ratio of LBP–PEG–CNTs is higher than that of LBP with concentrations of 0.5, 5, and 50 μg/mL.
Comparison in the inhibition ratios of LBP, PEG–CNTs, and LBP–PEG–CNTs on HepG2 at different reaction times (a) 24 h, (b) 48 h, and (c) 72 h.
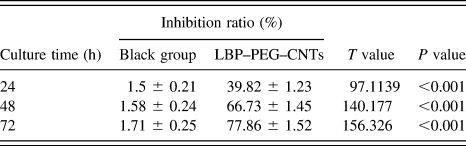
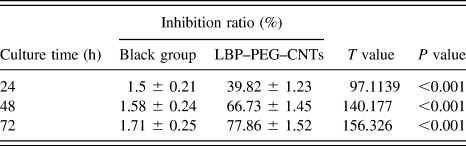
As given in Table II, the inhibition rate of LBP–PEG–CNTs is higher than that of the black group at 5 μg/mL LBP at different times (P < 0.01). Table SI gives the inhibition ratios of LBP and LBP–PEG–CNTs on HepG2 liver cells at different exposed times at 5 μg/mL LBP. It can be seen from Table SI that the inhibiting effect of LBP on HepG2 liver cells is higher than that of LBP–PEG–CNTs on HepG2 liver cells at 24 h of exposed time; while there is no obvious differences between them when exposed time increases to 48 h. With further increasing exposed time, the inhibiting effect of LBP–PEG–CNTs on HepG2 liver cells further increases but that of LBP on HepG2 liver cells hardly changes. From Table SI, it can be also found that the group of LBP–PEG–CNTs, compared with the group of LBP, is considered to be statistically significant (P < 0.01) in differences in the inhibition rate at different times.
Comparison of inhibition ratio between blank group and LBP–PEG–CNTs at different times (n = 10, LBP is 5 µg/mL).
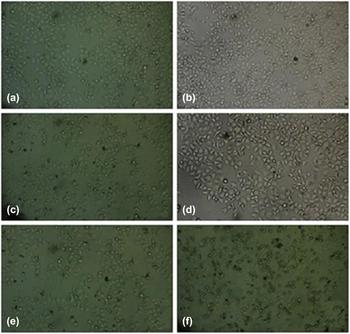
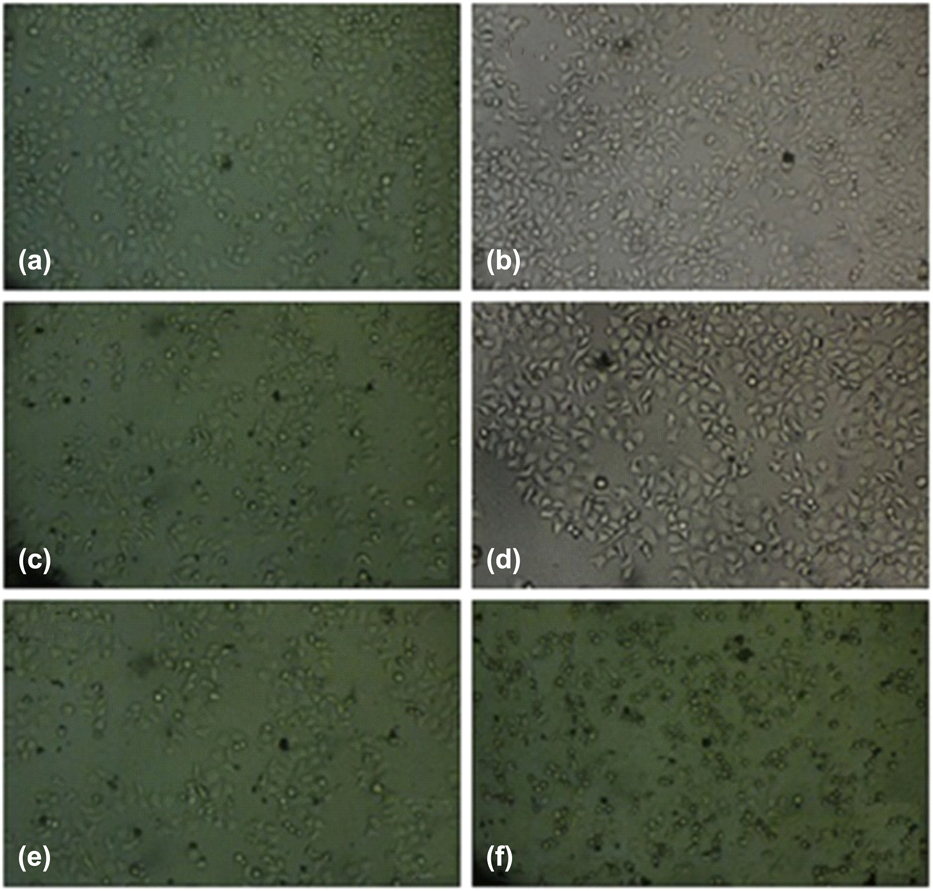
The cell morphology was observed on an inverted microscope, as shown in Fig. 8. When cultured with LBP [Figs. 8(a), 8(c), and 8(e)], obvious apoptosis of HepG2 cells are observed. The died cells are aggregated, and the live cells are changed in morphologies, which do not show obvious variation with the prolongation of time. By contrast, as shown in Figs. 8(b), 8(d), and 8(f), more cells tend to die and obvious morphological changes of cells appear with the increase of time when cultured with LBP–PEG–CNTs.
Morphological change of cells cultured with LBP (left) and LBP–PEG–CNTs (right) for different times (a and b: 24 h; c and d: 48 h; e and f: 72 h) (×100).
The cell penetrability is essential to realize the targeting of the drug carrier. David et al.Reference Davis, Chen and Shin17 grafted fluorescent protein to the surface of CNTs by nonspecific adsorption and used fluorescein as the tracer to observe cellular uptake of CNTs by endocytosis. Feazell et al. reportedReference Feazell, Nakayama-Ratchford and Dai18 the loading of antitumor drug Pt(IV) on single-walled CNTs by covalent bond to form CNTs–Pt(IV), and the combination of fluorescein with CNTs by noncovalent bond for the tracer transporting mode study. Their results showed that the concentration of Pt in cells cultured with CNTs–Pt(IV) is 6–8 times higher than that cultured with Pt(IV). Some reports proposed that the CNT carrier enters the cells across cell membranes by diffusion and insertion,Reference Gao, Nie, Wang, Qin, Guo, Yang and Yan19 while others stated that the modified CNTs enter cells in the way of endocytosis.Reference Dumortier, Lacotte and Pastorin20 In this work, LSCM was used to investigate the cell uptake behavior. The intracellular fluorescence intensity is 743.41 ± 121.36, indicating that the prepared CNT carriers have good ability to penetrate biomembranes. The quantitative FCM determination demonstrates the cellular fluorescence intensity is time-dependent, indicating that endocytosis is the main way of CNTs entering into cells.
In recent years, there is great progress in the application of modified CNTs as the drug carrier in cells and in vivo. Tripisciano et al. combined antitumor drug cisplatin with multiwalled CNTs by making use of the characteristics of capillary.Reference Tripisciano, Rümmeli and Chen21 Bhirde et al. grafted cisplatin on single-walled CNTs for the application of targeted therapy in vivo.Reference Bhirde, Patel, Gavard, Zhang, Sousa, Masedunskas and Rusling22 Wu et al.Reference Wu, Man, Wang, Lu, Ma, Cai and Ma23 used amphotericin B (AmB) and fluorescein to functionalize CNTs by using different groups from AmB and fluorescein. They used LSCM to observe fluorescein labeling and further to study the cellular uptake of the materials. Antibiotics, a kind of active micromolecule, combine with CNTs mainly by the covalent bond. Compared with free-standing antibiotics, antibiotics combined with CNTs show increased cell penetration and reduced toxicity and side effects. At present, LBP, the third-generation anticancer platinum drug, has gradually replaced cisplatin in clinic and become the pharmacy of first choice for many kinds of malignant tumor. In this work, LBP was graft to PEG–CNTs by the covalent bond, as verified by the FT-IR measurement. Meanwhile, the release of LBP in diverse solution with different pH shows that LBP-CNTs are sensitive to acid, as shown in Fig. 8. It can be seen from the slow release rate of LBP from LBP–PEG–CNTs in vitro that the cumulative release rate of LBP is pH-dependent. The release rate of LBP–PEG–CNTs is just below 20% at pH 7.4 through a continuous release for 7 days. The MTT extracellular culture fluid is prepared by simulating conditions in vivo, where pH is about 7.4, so LBP rarely releases from LBP–PEG–CNTs in extracellular culture fluid. The pH value in cellular internal environment is low owing to the effect of proton pump, especially pH in lysosome is only 5.0. From release test in vitro, it can be seen that the release rate of LBP from LBP–PEG–CNTs is fast and the release amount is large in PBS solution at pH 5.0. The cumulative release amount is up to 80% in PBS solution at pH 5.0 but below 5% in PBS solution at pH 9.0 through a continuous release for 9 days, indicating that the prepared drug carrier has pH-controlled release performance and is sensitive to acid, which is consistent with the report of Mu et al.Reference Bhirde, Patel, Gavard, Zhang, Sousa, Masedunskas and Rusling22 Therefore, once LBP–PEG–CNTs enter cells, especially lysosome, LBP releases fast. By comparing the inhibition ratio of cell proliferation in two groups at different point-in-times by MTT, it can be seen that the concentration of LBP entering cells in the form of LBP–PEG–CNTs is different from that of free LBP, which is attributed to different absorbing forms of tumor cells between two kinds of drugs. The main form of free LBP to pass through the cell membranes is diffusion, which is determined by differential concentration of LBP between intercellular and extracellular fluid, so free LBP diffuses in cells fast at first and slowly at last. On the other hand, uptake is the main form of LBP–PEG–CNTs to pass through the cell membranes, which is related to surface charge in the drug carrier and tumor cells. The surfaces of nanocarriers have positive charge while tumor cells have more negative charge than normal cells, which make them form conjugates simply by electrostatic interactions. In addition, nanocarriers have strong adsorption capability, and tumor cells have stronger macromolecular phagocytosis than normal cells. Therefore, LBP–PEG–CNTs have stronger adsorption and phagocytosis than free LBP on the surface of tumor cells, which results in effective uptake of LBP–PEG–CNTs into tumor cells. Moreover, LBP–PEG–CNTs rarely biodegrade in the neutral cell culture medium, which can promote the continuous uptake of LBP for long time.
The diffusion of free LBP is quick in cells, while the cellular uptake of LBP–PEG–CNTs is slow owing to the releasing process in lysosome and other organelles, which leads to the stronger inhibition effect of free LBP on tumor cells than LBP–PEG–CNTs in an early medication. The result becomes reverse during long-time drug implanting because of larger total uptake and longer action time of LBP–PEG–CNTs than those of free LBP.
IV. CONCLUSIONS
In summary, water soluble PEG–CNTs were used as a drug carrier to load antitumor drug LBP and to further obtain water soluble CNT-drug complex (LBP–PEG–CNTs). The cell penetrability and effective inhibition proliferation of LBP–PEG–CNTs on HepG2 were evaluated. The results show that the slow release of antitumor drug and inhibition against tumor cells were realized by increasing the time of LBP–PEG–CNTs in the blood circulation system in vivo and indirectly increasing the action time between LBP–PEG–CNTs and tumor. The specific conclusions are as follows:
(1) The cellular uptake results of PEG–CNTs indicate that FITC–PEG–CNTs can get into HepG2 cells. The leakage test shows that the leak rate of FITC–PEG–CNTs is below 2.0% in PBS at pH 7.4 for 36 h, which demonstrates the excellent cell penetrability of FITC–PEG–CNTs.
(2) The amount of LBP loaded onto PEG–CNTs was calculated to be 72%. The release amount of LBP is up to 80% at pH 5.0 but below 10% at pH 9.0, which indicates the release amount of LBP is pH-dependent. LBP can be favorably released at acid environment and slowly released at neutral environment, but rarely released at alkaline condition.
(3) MTT results show that the inhibition ability of LBP–PEG–CNTs increases with exposed time. When the time further increases to 72 h, the inhibition of free LBP hardly changes but that of LBP–PEG–CNTs further increases and reaches up to 77.86% ± 1.52%.
Therefore, the CNT-based drug carrier complex has strong inhibition effect on HepG2 cells. This study provides theoretical and practical foundation for the application of CNT as a drug carrier in effective targeted therapy of liver cancer.
Supplementary Material
To view supplementary material for this article, please visit https://doi.org/10.1557/jmr.2018.197.
ACKNOWLEDGMENTS
This study was financially supported by Shanxi Provincial Key Research and Development Program (201703D321015-1) and the Shanxi Provincial Key Innovative Research Team in Science and Technology (2015013002-10 and 201605D131045-10).