Introduction
Unmanned aerial vehicles (UAV), also referred to as unmanned aerial systems (UAS), remotely piloted aircraft (RPA) or drones, are becoming more widely used in military, government, private sector, and research applications. Research applications of UAVs have focused on a wide range of topics including atmospheric, biological, and glaciological studies, with Antarctic examples of these UAV uses given below.
The first use of UAVs in the Antarctic occurred between October and December 2007 when scientists with the British Antarctic Survey completed 20 science flights of up to 40 min duration and 45 km length over the Brunt Ice Shelf and adjacent Weddell Sea (http://www.antarctica.ac.uk/press/press_releases/press_release.php?id=352, P. Anderson, personal communication 2013). These science flights used a UAV from the Technical University of Braunschweig (2 m wingspan, 6 kg) and focused on atmospheric boundary layer processes over the Brunt Ice Shelf and adjacent Weddell Sea. Observations made during these flights included atmospheric state (temperature, pressure, humidity, and winds) as well as high frequency turbulence measurements.
In September 2009 and September 2012 Aerosonde UAVs (3.6 m wingspan, ∼20 kg) were used to study air-sea coupling over the Terra Nova Bay polynya (Cassano et al. Reference Cassano, Maslanik, Zappa, Gordon, Cullather and Knuth2010, Knuth et al. Reference Knuth, Cassano, Maslanik, Herrmann, Kernebone, Crocker and Logan2013). The UAV flights originated at the Pegasus ice runway, near McMurdo Station, before flying 300 km north to Terra Nova Bay to conduct the scientific sampling. The duration of these science flights ranged from 12–19 hours and covered up to 1000 km per flight. A total of 30 flights (17 science flights) and 298 flight hours were completed during these two field campaigns. Observations made during all of the flights included atmospheric temperature, pressure, humidity, and winds and surface temperature. On some flights net shortwave and longwave radiation were measured, digital photographs of the surface were acquired, and laser altimeter data were collected.
Test flights of a much larger UAV were conducted by the University of Kansas Center for Remote Sensing of Ice Sheets (CRESIS) during the 2009 and 2011 summer seasons. Two flights with a 499 kg Meridian UAS (Lan et al. Reference Lan, Keshmiri and Hale2012) and seven flights with a 33% scale Yak UAS (Garcia & Keshmiri Reference Garcia and Keshmiri2013) were flown during these two field seasons, accumulating 173 flight minutes. The Meridian UAS carried an ice penetrating radar for glaciological studies while the Yak UAS was used as a training aircraft. To date the CRESIS UAS flights have focused on aircraft testing in the Antarctic environment (R. Hale, personal communication 2013).
During summer 2012–13 the University of Tasmania completed the first successful flight of their Skyjib OktoKopter at Casey Station (A. Lucieer, personal communication 2013). This UAV carried a hyperspectral imager and was used to study moss bed topography (Turner et al. Reference Turner, Lucieer and Watson2012).
The Finnish Meteorological Institute completed 26 flights with the Small Unmanned Meteorological Observer (SUMO) UAV at the Aboa Research Station in Dronning Maud Land, Antarctica during the 2010–11 summer (P. Tisler, personal communication 2013). The goal of these flights was to observe atmospheric boundary layer temperature, pressure, humidity, and winds. The SUMO UAV used for these flights is described in greater detail below, and is the same UAV used for the research flights described in this paper.
As shown by this overview, over the past five years there is increasing interest in the use of UAVs for Antarctic research. Despite the number of UAV missions already completed there is almost no scientific results from these flights in the peer-reviewed scientific literature. The purpose of this paper is to demonstrate the utility of small UAVs for studying the near surface atmospheric state in the Antarctic.
The SUMO UAV used for this research is substantially smaller, less expensive, and easier to operate than many of the other UAVs previously operated in the Antarctic (CRESIS UAS, Aerosonde UAVs, Technical University of Braunschweig UAV) and as such can be more easily deployed to remote field locations in the Antarctic. This paper will demonstrate the scientific potential of small UAVs by presenting example boundary layer temperature profiles acquired during summer (January 2012) and late winter (September 2012), although detailed analysis of the processes leading to the observed boundary layer structures will not be discussed here. The results will highlight the benefit of performing repeat boundary layer profile flights over the period of tens of minutes to hours to study rapid changes in boundary layer structure.
A description of the SUMO UAV, details of the UAV-based observing strategy, and other meteorological observations used in this research are described in the next section. Sample boundary layer profiles that illustrate both “classic” boundary layer behaviour as well as more unusual behaviour are presented next. This paper concludes with a brief discussion of the advantages and limitations of small UAVs for Antarctic research and prospects for future UAV use in Antarctic science.
Observations
Small Unmanned Meteorological Observer (SUMO)
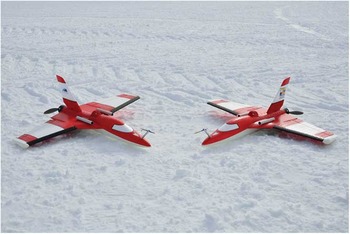
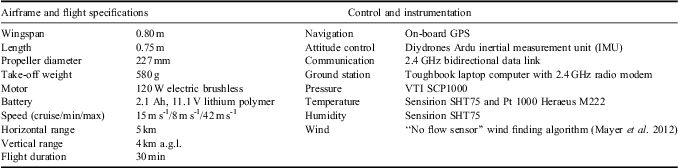
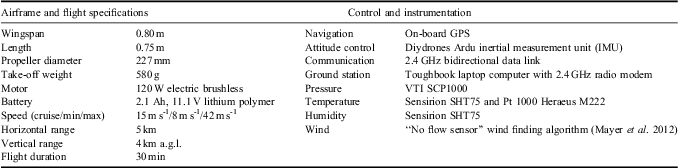
The SUMO UAV is a small (0.80 m wingspan, 580 g take-off weight) UAV based on a commercially available model remote control airplane airframe (Multiplex Funjet) paired with the Paparazzi open source autopilot system (ENAC 2008). The airframe is constructed from high-density foam and uses a pusher prop design (Fig. 1). The aircraft uses an electric engine and is powered with a rechargeable lithium polymer (LiPo) battery. Additional specifications of the SUMO UAV are provided in Table I and Reuder et al. (Reference Reuder, Jonassen and Ólafsson2012).
Small Unmanned Meteorological Observer (SUMO) unmanned aerial vehicles (UAVs) at Williams Field, Antarctica.

Small Unmanned Meteorological Observer (SUMO) unmanned aerial vehicle (UAV) specifications (after Reuder et al. Reference Reuder, Jonassen and Ólafsson2012).
The SUMO UAV is hand launched and lands on its underside on any smooth surface, making it ideal for use at remote field locations. The UAV can be controlled manually using a standard model airplane remote control but is typically operated in an autonomous or semi-autonomous mode using the onboard Paparazzi autopilot and ground control software. Bi-directional communication between the UAV and the ground control software is through a 2.4 GHz radio modem. This communication link allows UAV observations to be relayed to the ground control computer in real time and allows the remote pilot to modify the pre-programmed flight plan at any time. Ideally, a two-person team is required to operate the SUMO, although flights can be conducted by a single person if needed. In fully autonomous mode the aircraft is launched, completes a pre-programmed flight plan, and lands with no user input.
For the boundary layer profile flights presented here the typical flight plan started with either a manual or fully automatic launch. Immediately after launch the aircraft would climb to a predetermined height (typically 50 m above ground level (a.g.l.)) and orbit until instructed to begin profiling the boundary layer. The profiling portion of the flight involved either a spiral ascent (at ∼5 m s-1) and descent (at ∼2.5 m s-1), with a spiral diameter of c. 250 m, or a stepped ascent and/or descent with the aircraft pre-programmed to orbit at several fixed heights through the depth of the profile. At each fixed height in the stepped ascent/descent profile pattern the flight plan involved completion of two complete 250 m diameter circular orbits at each height (over a period of roughly 65 s) before climbing or descending to the next fixed height orbit location. Once the profiling was completed the aircraft would return to a near ground fixed height orbit (typically 50 m a.g.l.) and would then land either manually or in fully autonomous mode. A direct spiral ascent and descent flight plan to 1000 m a.g.l. typically took 10 min to complete, so that two or three ascent/descent profile pairs could be completed in a single flight, while the stepped ascent or descent profiles took up to 30 min to complete, with the total time dependent on the number of fixed height orbits and the maximum height of the profile. In a 30 min flight it was possible to complete 18 fixed height orbits.
The SUMO is equipped with instruments to measure temperature, humidity, and pressure as well as aircraft location (Tables I & II). Wind can be derived using a no-flow sensor method described by Mayer et al. (Reference Mayer, Hattenberger, Brisset, Jonassen and Reuder2012). Meteorological data is logged at 2–4 Hz frequency. Temperature is observed by two sensors (Pt 1000 Heraeus M222 and Sensirion SHT 75) with accuracies of ±0.2 K (Pt 1000) and ±0.3 K (Sensirion). The reported time lag for the temperature sensors ranges from 3–30 s although comparison between the faster Pt 1000 and slower Sensirion indicate that both have a similar response time with a lag of 2–5 s.
Small Unmanned Meteorological Observer (SUMO) meteorological sensor specifications (after Reuder et al. Reference Reuder, Jonassen and Ólafsson2012).

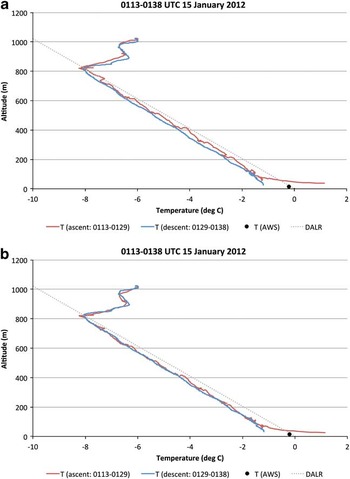
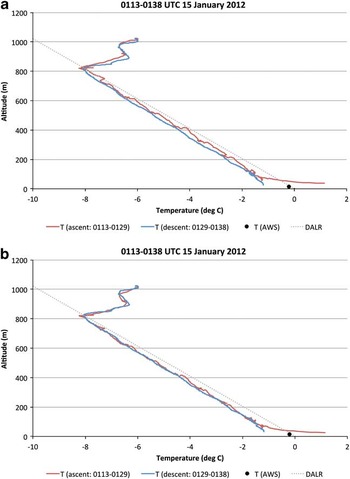
For flights consisting of a spiral ascent and descent the sensor lag was evident as an offset between the ascending and descending temperature profiles. This is clearly illustrated by the boundary layer temperature profiles measured on 15 January 2012 (Fig. 2a). To account for this lag the temperatures in all subsequent figures are plotted using the UAV recorded heights from 2–5 s prior to the time of the temperature observation. The amount of time lag used was visually determined by finding the time lag that gave the most overlap between the ascending and descending profiles. For the observations from 15 January the optimal lag was found to be 2.5 s (Fig. 2b). For other flights presented in this paper the optimal time lag varied from 2.5–5 s. A more robust method for dealing with the sensor lag was to perform stepped ascent or descent profiles with the UAV orbiting at a fixed height. At each fixed height in the stepped ascent the UAV completed two circular orbits over a period of roughly 65 s, with the temperature data averaged over the entire period the UAV flew the fixed height orbit. Plots of temperature versus time for the fixed height orbits (not shown) support the previous assessment that the temperature sensor lag was of the order of several seconds.
Temperature profiles observed at Williams Field from 01h13–01h38 coordinated universal time (UTC) 15 January 2012. The temperature observed during the unmanned aerial vehicles (UAV) ascent (01h13–01h29 UTC) is shown in red, the temperature observed during the UAV descent (01h29–01h38 UTC) is shown in blue, and the Williams Field automatic weather station observed temperature is shown with a black circle. The dry adiabatic lapse rate (DALR) is shown by the dotted grey line. a. Shows the uncorrected ascent and descent profiles. b. Shows the time lagged profiles with UAV observed temperature plotted at the UAV height 2.5 s prior to the temperature measurement.
Surface weather data
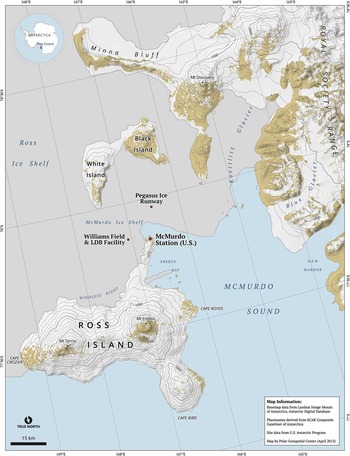
Observations from nearby automatic weather stations (AWS) are used in the analysis presented below to document the meteorological conditions (temperature, pressure, winds) during the UAV flights and to provide near surface (2 m a.g.l.) temperature observations to supplement the UAV observed temperature profiles. The AWS used in this paper are part of a network of AWS maintained as part of a collaborative project between the University of Wisconsin and the University of Colorado (Lazzara et al. Reference Lazzara, Weidner, Keller, Thom and Cassano2012). The two AWS used for this work are located within 2 km of the UAV flight locations at Williams Field and the Pegasus ice runway (Fig. 3).
Map of Small Unmanned Meteorological Observer (SUMO) unmanned aerial vehicle (UAV) flight region in the vicinity of Ross Island, Antarctica. The location of McMurdo Station, Williams Field, and the Pegasus ice runway are marked with red circles.

Synoptic surface weather observations from McMurdo Station (Fig. 3) were also used to assess the meteorological conditions during each UAV flight. These observations were retrieved from the University of Wisconsin Antarctic Meteorological Research Center.
Results
Observations from five days of UAV flights in the vicinity of McMurdo Station, Antarctica exhibited a variety of boundary layer temperature profiles ranging from deep, well-mixed conditions to strong, shallow inversions. Repeat UAV profiles over short periods of time (tens of minutes to several hours) revealed rapid changes in boundary layer structure. Examples of the range of boundary layer profiles observed are presented below.
Well-mixed boundary layer
On 15 January 2012 a single SUMO flight was conducted from 01h13–01h38 coordinated universal time (UTC) (13h13–13h38 local standard time (LST)) on the Ross Ice Shelf (77.8619°S, 167.0722°E) at the Williams Field Long Duration Balloon facility 9.5 km east of McMurdo Station (Fig. 3). The surface weather observations from McMurdo Station at the time of the flight indicated clear to scattered cloud cover. The nearby Williams Field automatic weather station reported winds of 2–3 m s-1 from the north-west with little pressure change for the 24 hour period centred on the UAV flight time.
The flight plan for this flight consisted of a stepped ascent, with steps every 100 m a.g.l. from 100–1000 m a.g.l., followed by a continuous descent. For each step during the ascent the UAV completed two circular orbits with a diameter of 230 m. A well-mixed convective boundary layer was present at this time, with negligible changes between the ascending and descending portions of the flight (Fig. 2b). The temperature was observed to decrease at nearly the dry adiabatic lapse rate from the surface to 800 m a.g.l. A dry adiabatic temperature profile is consistent with vertical mixing in the atmosphere and is often referred to as a well-mixed layer. A 1.6 K capping inversion marked the top of the well-mixed layer. The Williams Field AWS observations at the same time indicated a surface air temperature of -0.2°C. This temperature was consistent with the UAV observed temperature immediately after take-off and was indicative of a superadiabatic lapse rate near the surface. A surface based air parcel with this temperature would rise buoyantly to the capping inversion, consistent with surface based convection driving the well-mixed boundary layer observed at this time (e.g. Stull Reference Stull1988).
Stable boundary layer
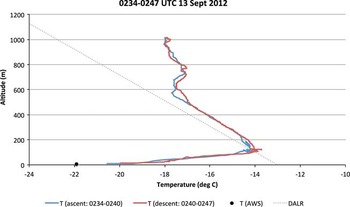
On 13 January 2012 a single SUMO flight was conducted from 02h34–02h47 UTC (14h34–14h47 LST) on the Ross Ice Shelf (77.9651°S, 166.5098°E) at the Pegasus ice runway 13.5 km south-south-east of McMurdo Station (Fig. 3). The surface weather observations from McMurdo Station at this time indicated clear to scattered cloud cover. The Pegasus North AWS, immediately adjacent to the UAV flight path, reported light winds of 2–3 m s-1 from the south-south-east, with the surface pressure falling 3 hPa during the eight hours leading up to the flight.
The flight plan for this flight consisted of a spiral ascent to 1000 m a.g.l. followed by a spiral descent to the surface. The diameter of the UAV spiral for both the ascent and descent was 243 m. Immediately after take-off and just before landing the UAV orbited at 100 m a.g.l. while aircraft operations were confirmed as being normal.
On this day a stable boundary layer was present. An 8 K temperature inversion extended from the surface to 140 m a.g.l. (Fig. 4). The temperature decreased at nearly the dry adiabatic lapse rate above the surface inversion, cooling c. 3 K from 200–500 m a.g.l., with only a slight decrease in temperature with height from 500–1000 m a.g.l. The boundary layer temperature profile observed at this time was consistent with a classic stable boundary layer driven by radiative cooling at the surface below a well-mixed residual layer (e.g. Stull Reference Stull1988).
Temperature profiles observed at the Pegasus ice runway from 02h34–02h47 coordinated universal time (UTC) 13 September 2012. The temperature observed during the unmanned aerial vehicle (UAV) ascent (02h34–02h40 UTC) is shown in blue, the temperature observed during the UAV descent (02h40–02h47 UTC) is shown in red, and the Pegasus North automatic weather station observed temperature is shown with a black circle. The dry adiabatic lapse rate (DALR) is shown by the dotted grey line. The UAV observed temperature is plotted at the UAV height 2.5 s prior to the temperature measurement.

Stable to well-mixed boundary layer evolution
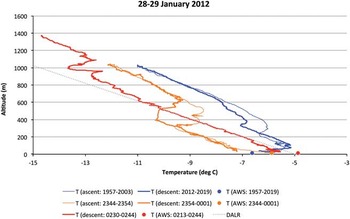
Three SUMO flights were conducted between 19h57 UTC 28 January 2012 and 02h44 UTC 29 January 2012 (07h57–14h44 LST 29 January 2012) on the Ross Ice Shelf (77.8619°S, 167.0722°E) at the Williams Field Long Duration Balloon facility (Fig. 3). During this nearly seven hour period the boundary layer transitioned from a stable boundary layer, with a surface based inversion, to a deep, well-mixed boundary layer (Fig. 5). During this time the surface observations at McMurdo Station indicated mostly cloud skies with a cloud ceiling between 2100 and 3000 m. The winds at the Williams Field AWS decreased from 5 m s-1 from the east-south-east at the time of the first SUMO flight to 2.5 m s-1 from the east-north-east at the time of the final SUMO flight.
Temperature profiles observed at Williams Field from 19h57 coordinated universal time (UTC) 28 January to 02h44 UTC 29 January 2012 (thin blue line = unmanned aerial vehicle (UAV) ascent from 19h57–20h03 UTC, thick blue line = UAV descent from 20h12–20h19 UTC, thin orange line = UAV ascent from 23h44–23h54 UTC, thick orange line = UAV descent from 23h54–00h01 UTC, thick red line = UAV descent from 02h30–02h44 UTC). The Williams Field automatic weather station observed temperature is shown by blue (19h57–20h19 UTC), orange (23h44–00h01 UTC), and red (02h13–02h44 UTC) filled circles. The dry adiabatic lapse rate (DALR) is shown by the dotted grey line. The UAV observed temperature is plotted at the UAV height 4 to 5 s prior to the temperature measurement.

From 19h57–20h19 UTC 28 January a single SUMO flight consisting of two 260 m diameter spiral ascent/descent pairs from the surface to 1000 m a.g.l. were completed. At this time a 100 m deep 1.4 K surface based inversion was present. Above the inversion the temperature decreased at the dry adiabatic lapse rate over the next 100–250 m and a shallow inversion capped the dry adiabatic layer. A second well mixed, nearly dry adiabatic, layer was present above the second inversion layer to the top of the UAV profiles. The two well-mixed layers are probably remnants of convective boundary layers from the previous days or that had advected over the site from adjacent regions. In the layer from 100–600 m a.g.l. the temperature was observed to vary by up to 0.8 K between the four profiles collected during the two ascent/descent flights completed by the SUMO. Only the initial ascending profile and final descending profile are shown in Fig. 5, but these capture the range of temperatures observed during the four profile flights.
A second SUMO flight was completed between 23h44 UTC 28 January and 00h01 UTC 29 January. The flight profile for this flight consisted of a stepped ascent, with 230 m diameter orbits at 100, 200, 300, and 400 m a.g.l., followed by a spiral ascent to 1000 m a.g.l. and a spiral descent to the surface. At this time a dry adiabatic temperature profile was observed from the surface to 310–400 m a.g.l. This well-mixed layer was capped by a 0.9 K inversion. A second nearly well-mixed layer was present from the top of this inversion to the top of the UAV profile at 1000 m a.g.l. The ascending and descending UAV profiles for this flight show nearly identical temperatures in the lowest 310 m and the top 400 m of the profiles, with temperature differences of up to 1.5 K between 310 and 600 m a.g.l. The temperature difference between 310 and 600 m a.g.l. is due to a deepening of the bottom well-mixed layer from 310 to 400 m and a lifting of the capping inversion during the ten minutes that elapsed between the ascent and descent profiles. In the four hours that elapsed between the first and second SUMO flights on this day the temperature over the lowest 1000 m of the atmosphere decreased by 1–3 K. Since the first SUMO flight was made in the early morning, with a low sun angle, and the second flight was made near local noon, the decrease in temperature is not due to typical diurnal temperature evolution. Instead, this temperature change probably reflects cold air advection, which is slightly stronger below 500 m a.g.l. than above given the weaker cooling observed in the top half of the profile.
A final SUMO flight of the day was flown between 02h13 and 02h44 UTC 29 January. This flight consisted of a stepped 220 m diameter spiral ascent, with steps every 100 m from 100–1000 m a.g.l., followed by a spiral descent to the surface. The temperature was observed to decrease at the dry adiabatic lapse rate from the surface to c. 1000 m a.g.l. (Fig. 5). A 0.8 K capping inversion was present at the top of the mixed layer with a second dry adiabatic layer extending above the capping inversion to the top of the UAV flight at 1350 m a.g.l. The well-mixed layer between the surface and 1000 m a.g.l. has a mean temperature that is nearly equal to the layer mean temperature observed during the second set of UAV flights from 23h54–00h01 UTC. This suggests that the mixing responsible for deepening the boundary layer from 400 m (as observed between 23h54 and 00h01 UTC) to 1000 m was due primarily to mechanical mixing rather than convective mixing, as little additional heat appears to have been added to the boundary layer during the 2.5 hours that elapsed between the second and third set of SUMO flights. The well-mixed layer above 1100 m appears to be an extension of the upper mixed layer observed during the second SUMO flight and may be a remnant convective boundary layer from previous days or that had been advected over the observational site.
This series of three SUMO flights illustrates the rapid changes that occur in the boundary layer but that can be missed by standard radiosonde observations conducted at 12 hour intervals. Even during dedicated boundary layer field campaigns radiosonde profiles are often taken at most every three hours and would miss many of the sub-hourly changes documented above. Tethered balloons or instrumented towers have sufficient temporal resolution to observe the boundary layer changes described above but are typically limited to lower observing heights.
Stable boundary layer evolution
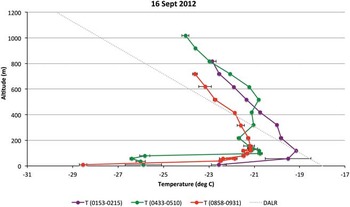
Three SUMO flights were completed between 01h53 and 09h31 UTC (13h53–21h31 LST) 16 September 2012 at the Pegasus ice runway (Fig. 3). Observations from these flights captured the evolution of a stable boundary layer over a nearly eight hour period (Fig. 6). During these UAV flights the cloud cover reported at McMurdo Station increased from scattered clouds between 01h55 and 05h55 UTC to broken clouds with a cloud ceiling at 1500 m by 08h55 UTC. The winds observed at the Pegasus North AWS increased from 2 m s-1 from the north-north-east to 5 m s-1 from the north-east over the duration of the SUMO flights.
Temperature profiles observed at Pegasus ice runway from 01h53–09h31 coordinated universal time (UTC) 16 September 2012 (purple line = 01h53–02h15 UTC, green line = 04h33–05h10 UTC, red line = 08h58–09h31 UTC). Error bars show ± 1 standard deviation of the temperature at each fixed height unmanned aerial vehicle (UAV) orbit. The Pegasus North automatic weather station observed temperature is shown by the coloured circle at the bottom of each profile and the error bars for this point show ± 1 standard deviation of the temperature observed during the UAV flight. The dry adiabatic lapse rate (DALR) is shown by the dotted grey line.

The first SUMO flight of the day (01h53–02h15 UTC) consisted of a stepped ascent with 260 m diameter orbits at 50 and 100 m a.g.l. and then orbits every 100 m from 200–800 m a.g.l. For these flights the mean temperature at each orbit is shown in Fig. 6 by a coloured dot. The ±1 standard deviation range is shown at each orbit height by the error bars in the figure. A 3.4 K surface based temperature inversion extended up to 110 m a.g.l. Above this the temperature decreased by 3.8 K to a height of 810 m a.g.l. The largest temperature variability of all fixed height orbits was found at 50 m a.g.l., with a standard deviation of 1 K. Above this level the temperature standard deviation was generally less than 0.1 K.
The second SUMO flight of the day (04h33–05h10 UTC) consisted of a stepped ascent with 260 m diameter orbits every 20 m from 30–150 m a.g.l., an orbit at 210 m a.g.l., and then orbits every 100 m from 210–1010 m a.g.l. The surface air temperature, as measured by the Pegasus North AWS, decreased 3.3 K from the time of the first UAV flight to the time of the second UAV flight. The most pronounced feature of the observed temperature profile from the second SUMO flight was a strong, shallow inversion with a temperature increase of 5.7 K between 50 and 90 m a.g.l. The temperatures below 400 m a.g.l. during the second SUMO flight were cooler by 1–6 K compared to those observed during the first SUMO flight, while the temperatures above 400 m a.g.l. were similar to those observed during the first SUMO flight of the day. The temperature variability observed during each orbit was small, with a mean standard deviation over all fixed height orbits of 0.1 K and a maximum orbit standard deviation of 0.2 K.
The final SUMO flight (08h58–09h31 UTC) of the day consisted of a stepped ascent with an initial 260 m diameter orbit at 50 m a.g.l. and then orbits every 100 m from 110–710 m a.g.l. followed by a stepped descent with orbits every 20 m from 150–30 m a.g.l. The temperature profile for this SUMO flight reveals a strong, 7.3 K, surface based inversion extending up to c. 150 m a.g.l. and then a temperature decrease of 2.5 K from 150–710 m a.g.l. The surface air temperature observed by the Pegasus North AWS decreased 2.6 K between the second and final SUMO flights of the day. Between 30 and 90 m a.g.l. the air temperature observed during the final SUMO flight was up to 3 K warmer than during the previous flight. The temperatures between 90 and 210 m a.g.l. were similar for the second and third UAV flights, with cooler temperatures observed during the third SUMO flight above 300 m a.g.l. The warming between 30 and 90 m a.g.l. is due to the sharp temperature inversion observed during the second SUMO flight, between 50 and 90 m a.g.l., moving down to the surface by the time of the third SUMO flight. The observed cooling above 300 m a.g.l. could be due to advective or radiative processes.
This series of three SUMO flights reveals the pronounced changes in stable boundary layer profiles that can occur over a period of several hours. The SUMO observations are also shown to be able to resolve sharp temperature inversions when using stepped ascent/descent profile flight plans.
Discussion and conclusions
SUMO UAV observations of boundary layer temperature profiles from three flight days in January 2012 and two flight days in September 2012 reveal a rich range of boundary layer behaviours. Classic well-mixed and stable boundary layers were observed (Figs 2 & 4). Rapid changes in boundary layer depth were also observed, with a surface based mixed layer observed to deepen by nearly 90 m in ten minutes (Fig. 5). The observations suggest that on 15 January (Fig. 2) the surface mixed layer was driven by surface heating while on 28–29 January (Fig. 5) deepening of the mixed layer appears to be driven by mechanical mixing rather than surface driven free convection. The SUMO UAV was able to resolve sharp, shallow inversion layers (Fig. 6) when using carefully designed stepped ascent/descent profiles.
The SUMO is an ideal tool for remote, deep field Antarctic atmospheric observations given its simple operation and thus limited logistic support requirements. Larger UAVs such as the Aerosonde or CRESIS UAVs require groomed runways for take-off and landing and this limits their suitability for deep field use. Of course, these larger UAVs have greater endurance and range than the SUMO UAV and can thus sample deep field locations through longer transit flights as was done with the Aerosonde flights in September 2009 and 2012, which transited nearly 300 km between Pegasus runway and Terra Nova Bay.
The simplicity of the SUMO UAV means that a small field team can successfully deploy this observing platform. Ideally SUMO UAV operations should be conducted by a two-person field team but this is a much smaller field team than the five or more personnel required to operate the larger UAVs mentioned in the introduction.
The SUMO costs less than Euro 5000 and thus can be viewed as a nearly disposable system. With this low cost the SUMO can be used in high risk situations where loss of the aircraft is possible or even likely. In comparison the Aerosonde UAVs cost more than US$ 50 000 and thus require greater care to avoid unnecessary risk and potential loss of the aircraft.
While the low cost and ease of use of the SUMOs provide significant advantages for Antarctic research applications the small size of the SUMO results in significant limitations in terms of payload and endurance. The total SUMO UAV weighs < 600 g with the science payload comprising less than half of this weight. This limitation can be overcome through the use of multiple SUMOs conducting co-ordinated flight plans, with each SUMO carrying a unique instrument. The SUMO's battery lifetime during flight is just 30 min, although surprisingly this endurance was not noticeably reduced during the late winter flights with temperatures down to -30°C. The short endurance of the SUMO limits the range of SUMO flights, with a useful maximum range of 5–10 km from the launch and landing site.
As shown in this paper the SUMO UAV is capable of making high quality boundary layer observations. Data of this type can help improve our understanding of polar boundary layer processes and can be used to critically evaluate numerical weather prediction and climate model boundary layer simulations, which have consistently been shown to be deficient (e.g. Tjernström et al. Reference Tjernström, Žagar, Svensson, Cassano, Pfeifer, Rinke, Wyser, Dethloff, Jones, Semmler and Shaw2005). The small size of the SUMO and the ease of deployment to remote locations makes the SUMO, or a fleet of SUMOs, ideal for studying atmospheric processes in regions of complex terrain, such as the McMurdo Dry Valleys. SUMOs could be used for other science applications as well. As an example, the addition of small web cameras on the SUMO could allow this platform to conduct aerial surveys of wildlife or sea ice conditions.
Plans are being developed for several additional SUMO campaigns in the Antarctic. A dedicated two-week SUMO observing campaign is scheduled for January 2014 on the Ross Ice Shelf at the site of the Alexander 30 m AWS tower (Lazarra et al. 2012). This campaign will be located in the climatological path of the Ross Ice Shelf airstream (RAS, Parish et al. Reference Parish, Cassano and Seefeldt2006) and will provide some of the first vertical profiles through this dominant feature of the Ross Ice Shelf climate. In addition to the SUMO UAV profiles and the observations from five levels on the 30 m AWS, surface radiative and turbulent heat fluxes will also be observed during this field campaign. Horizontal SUMO flights and a temporary AWS network of four stations at a distance of 10 km from the 30 m AWS will be used to assess advective processes which may explain some of the observed changes in boundary layer depth and structure, as discussed in Jones et al. (Reference Jones, Anderson, Wolff, Roscoe, Marshall, Richter, Brough and Colwell2010). Additional SUMO UAV campaigns have been proposed to study near surface ozone and aerosol chemistry over McMurdo Sound and to observe the spring boundary layer in the western Ross Sea and Terra Nova Bay as part of a ship based field campaign.
Acknowledgements
This work was funded by US National Science Foundation grants ANT-0943952 and ANT-1043657. The author thanks Martin Müller and Christian Lindenberg for providing the SUMO UAVs and the training necessary to successfully operate these UAVs, Alice DuVivier, Shelley Knuth, and Lee Welhouse for their assistance in conducting the SUMO flights, Brad Herried of the University of Minnesota Polar Geospatial Center for providing the map in Fig. 3, and the many people affiliated with the United States Antarctic Program that provided the logistic support for this effort. The constructive comments of the reviewers are gratefully acknowledged.