INTRODUCTION
One of the cornerstones of species conservation is the development of a network of protected areas that supports as many threatened species as possible (Zimmerer et al. Reference Zimmerer, Galt and Buck2004; Gaston et al. Reference Gaston, Jackson, Cantú-Salazar and Cruz-Piñón2008). However, even the extensive publicly-owned networks that have emerged over the last century have failed to capture most of the species threatened with extinction (Scott et al. Reference Scott, Davis, McGhie, Wright, Groves and Estes2001; Langpap Reference Langpap2004; Gallo et al. Reference Gallo, Pasquini, Reyers and Cowling2009; Jackson et al. Reference Jackson, Walker and Gaston2009). In recognition of this shortfall, biologists and policy-makers in the USA began to focus on research and policy tools that would increase the conservation value of privately-owned lands (Hilty & Merenlender Reference Hilty and Merenlender2003; Langpap Reference Langpap2006). These efforts have led to the creation of a robust toolbox and several dedicated funding streams for increasing the conservation value of private lands. This effort more fully balances the portfolio of conservation options in the USA so that it encompasses all landownership types (Bowers Reference Bowers1999; Matta et al. Reference Matta, Alavalapati and Tanner2007). We suggest that the next hurdle is to determine when and where to apply these tools, while explicitly recognizing that most conservation decisions are made at regional or smaller spatial scales (Beaudry et al. Reference Beaudry, Pidgeon, Mladenoff, Howe, Bartelt and Radeloff2011).
In an ideal world, sufficient protected habitat would be devoted to species conservation across a representative sample of all major ecosystem types, thereby ensuring that a broad swath of taxa would persist into the future (Gaston et al. Reference Gaston, Jackson, Cantú-Salazar and Cruz-Piñón2008). There are several reasons (both biological and sociopolitical) as to why this ideal is unlikely (Gaston et al. Reference Gaston, Jackson, Cantú-Salazar and Cruz-Piñón2008), one of the key reasons being that historic human land use and settlement patterns largely determine the availability of land for acquisition into protected areas. Lands that have sparse human settlement patterns are far more likely to be in a protected status than are lands that are heavily settled (Scott et al. Reference Scott, Davis, McGhie, Wright, Groves and Estes2001). For example, in the USA, over 80% of arctic, alpine and boreal forest bird habitat is under federal and state ownership, whereas less than 20% of eastern deciduous forest habitat is protected. If conservation actions are restricted only to the acquisition and management of protected lands (NABCI [North American Bird Conservation Initiative] 2011), this underlying pattern of land availability will greatly restrict the species that can be supported (Gaston et al. Reference Gaston, Jackson, Cantú-Salazar and Cruz-Piñón2008).
Conserving species on private lands requires encouragement of individual landowners to adopt biodiversity-friendly land management practices (Langpap Reference Langpap2004). Such efforts have achieved varying levels of success, with positive results hinging on the landowners’ interest in managing their land for the benefit of native species (Brook et al. Reference Brook, Zint and De Young2003; Mir & Dick Reference Mir and Dick2012). Even when landowners specifically acquire land for the purpose of conservation, the impact on conservation can be limited. For example, the largest private lands trust in the USA, The Nature Conservancy, manages less than 0.1% of the USA's land area (Groves et al. Reference Groves, Kutner, Stoms, Murray, Scott, Schafale, Weakley, Pressey, Stein, Kutner and Adams2000). Incentive programmes aimed at achieving a balance between conservation and landowner economic interests have the potential to transform relatively large amounts of land area (Langpap Reference Langpap2006; Norris Reference Norris2008). However, these programmes do not guarantee species protection and likely require the enrolment of many adjacent land parcels to be truly effective (Bowers Reference Bowers1999; Dutton et al. Reference Dutton, Edwards-Jones, Strachan and Macdonald2008). Private lands are often highly fragmented, small in size, and must still function to the satisfaction of the landowner (for example agricultural production or recreation) while also serving a conservation goal (Bowers Reference Bowers1999; Langpap Reference Langpap2006; Matta et al. Reference Matta, Alavalapati and Tanner2007).
Given the limitations of any single approach to conserving native species, it is critical to understand patterns of species occurrence across the wide variety of landownership types that exist across any given region (Kautz & Cox Reference Kautz and Cox2001). Because the policy tools that are available and likely to be successful vary by ownership, knowing which species are found on public lands and which on private lands can influence the appropriate integration of land acquisition, regulatory measures, and incentive-based approaches (Bowers Reference Bowers1999; Matta et al. Reference Matta, Alavalapati and Tanner2007). Particularly in extensively urbanized areas, where economic land values are high and remnant habitats are small and fragmented, collective conservation gains are usually driven by parcel-scale land management decisions (Guerrero et al. Reference Guerrero, Knight, Grantham, Cowling and Wilson2010). Despite this, very few examples of associations between regional landownership patterns and threatened species occurrence exist in the literature (see for example Kautz & Cox Reference Kautz and Cox2001; Thogmartin & Rohweder Reference Thogmartin, Rohweder, Rich, Arizmendi, Demarest and Thompson2009). The few that have occurred tend to lump landownership types into just a few broad categories (such as public versus private). These surveys are informative but do not allow policy makers to tightly connect the occurrence of threatened species with particular landownership types. This gap prevents the tailoring of policy tools to the realities of conservation planning (Bengston et al. Reference Bengston, Fletcher and Nelson2004).
Here we associate landownership patterns to the predicted occurrence of 18 declining forest bird species found in the deciduous forests of New Jersey (USA), a highly urbanized area that makes a surprisingly significant contribution to the regional persistence of several imperilled bird species. We combine three commonly available data sources to document which regionally imperilled forest bird species are found on landownership types within a deciduous forest in north-eastern USA. Our results demonstrate that such knowledge serves to match the appropriate suite of conservation tools to the species that need them, elevating the likelihood of efficient conservation outcomes. Our approach of marrying commonly collected geographic information system (GIS) and biological data to create a regional framework for structuring conservation planning and policy decisions can be readily applied across a variety of ecosystems.
METHODS
The region
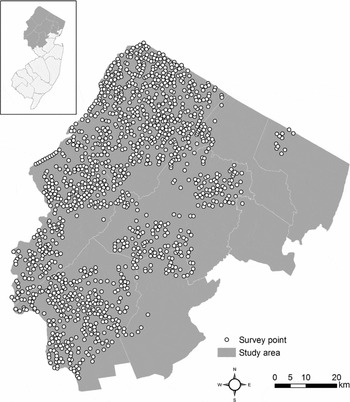
Our study area traverses the Ridge-and-Valley, Highlands and Piedmont physiographic provinces of northern New Jersey, including the counties of Bergen, Essex, Hunterdon, Morris, Passaic, Somerset, Sussex, and Warren (Fig. 1; 6982 km2). Elevation peaks at just over 549 m in the Kittantinny Mountains in the west, falling to near sea level along the Passaic River in the east (Lathrop Reference Lathrop2011). Although heavily urbanized in sections, land development over much of this region is regulated, with a central goal being the preservation of natural resources (Lathrop Reference Lathrop2011). The study area exemplifies a common North American ecological legacy, with intense urbanization occurring along the mouth of the Passaic River, agriculture concentrated in the fertile river valley, and large tracts of federally- and state-protected lands comprising the non-farmable mountain ridges. Much of the undeveloped extent of the study area has returned to approximately 100-year-old second-growth forest (Kittredge et al. Reference Kittredge, Finley and Foster2003; Askins et al. Reference Askins, Zuckerberg and Novak2007; Lathrop Reference Lathrop2011), a reflection of the decline of active logging and farming over the past century (Kittredge et al. Reference Kittredge, Finley and Foster2003; Askins et al. Reference Askins, Zuckerberg and Novak2007). However, the extent of reforestation is patchier in our study area than in the other northern USA states, reflecting more complex land ownership patterns (more and smaller parcels) and the predominance of private land ownership (Hasse & Lathrop Reference Hasse and Lathrop2003).
Diagrammatic map of study area, comprising the nine north-western counties of New Jersey (USA), as shown in the inset. White circles indicate the 1316 avian point count locations used for the species occurrence data.

The species
We selected species identified in a 2002 systematic survey of forest birds conducted by two highly trained biologists employed by the New Jersey Endangered and Nongame Species Program (Dey Reference Dey2005). In mild weather conditions in late spring, these individuals conducted pre-dawn/dawn (A. D. Dey, personal communication, Reference Dey2005), unlimited radius on- and off-road fixed site, timed point-counts across >80% of our study area and documented all individuals of any bird species seen or heard within a three-minute interval at 1316 locations (Fig. 1). Survey locations were determined by randomly selecting approximately 90 points within each quadrangle of relevant 7.5-minute USGS topographic maps, and were proportional to the total area of each land use and land ownership type within the study area (Dey Reference Dey2005). Highly urbanized areas were avoided. Survey efforts focused predominantly on forest passerines and piciformes and resulted in 2464 individual records for our focal species (1370 records for mature forest birds, and 1094 for early successional birds).
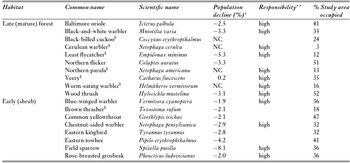
We extracted from this dataset the records for 18 focal bird species, which were selected based upon their regional (and state) conservation status and habitat requirements. The species we selected breed within our study area and have declined in population size within the Breeding Bird Survey New England/Mid-Atlantic region by a minimum of 1.5% per year since 2001, both within New Jersey and across the north-eastern USA (Table 1; Sauer et al. Reference Sauer, HInes, Fallon, Pardieck, Ziolkowski and Link2012). Most of these species have been formally recognized as in need of conservation action by the State of New Jersey or by national non-profit conservation organizations (Table 1; Dettmers & Rosenberg Reference Dettmers and Rosenberg2000). We selected species that vary in the extent to which they rely on the forests within our study area for their continued persistence to incorporate approximately equal numbers of mature forest birds and early successional forest birds (Table 1). For example, the cerulean warbler (Dendroica cerulea) and field sparrow (Spizella pusilla) are highly dependent on conservation efforts within our study area because substantive portions of their globally restricted distribution occur here (Table 1; Dettmers & Rosenberg Reference Dettmers and Rosenberg2000). In contrast, the eastern towhee (Pipilo erythrophthalmus) and blue-winged warbler (Vermivora cyanoptera) are experiencing sharp population declines in New Jersey (as well as across the north-eastern USA), but are well represented in forests outside of our study area (Table 1). We excluded excessively common or human commensal species (such as the American crow, Corvus brachyrhynchos) or species that were observed at <10 survey locations.
The species included in our analysis are forest-dependent species, differing in their preference for early (shrub) or late (mature) forest successional habitats. The percentage area occupied is the fraction of the study area that was identified as suitable habitat using Maxent (see text for details). *Annual population declines (2001–2010) as a percentage of the total population within the north-eastern coastal USA region, as calculated from the Breeding Bird Survey (Sauer et al. Reference Sauer, HInes, Fallon, Pardieck, Ziolkowski and Link2012), NC = no change. **A species has a high responsibility ranking if a substantial portion of its geographical range is restricted to the north-eastern USA (as according to Partners in Flight; Dettmers & Rosenberg Reference Dettmers and Rosenberg2000), or at least 50% of its current geographical range within New Jersey is located in the study area. §Listed as of ‘special concern’ by the New Jersey Endangered and Nongame Species Program (http://www.njfishandwildlife).

We divided our 18 species into two guilds reflecting their reliance on the successional state of deciduous forests. Mature forest species rely on the stand structures that accompany tall trees (> 200 m), with a well-developed sub-canopy and some understorey vegetation. Early successional birds rely on early successional forests, which are characterized by smaller trees, no clear canopy stratification, and a dense woody and herbaceous understorey. Both bird guilds are recognized as being of conservation concern; however, there are more early successional birds in decline in the north-eastern USA than mature forest birds (Dettmers Reference Dettmers2003). Our primary objective was to identify land ownership patterns underlying the distribution of these 18 forest birds. To accomplish this we created two sets of maps for our study area. The first set depicted the geographical distribution of each focal forest species, and the second depicted landownership categories.
Species’ distribution maps
To create distribution maps for each species, we used occurrence data for the 18 species from the New Jersey Endangered and Nongame Species 2002 dataset (Dey Reference Dey2005). State biologists only visited survey points once and in a single year (2002), and did not record the distances at which individuals were observed, preventing calculation of a detection probability for each species (Witmer Reference Witmer2005). We were thus unable to distinguish between a zero-count due to the true absence of a species at a point count location versus a zero-count due to failure to observe an individual of a species that was actually there. Therefore, we collapsed the information from these point counts into a presence-only database. For each species, if ≥ 1 individual was observed at a survey location, it was counted as ‘present’ at that location.
We used maximum entropy modelling software (MAXENT version 3.3.3k; Phillips et al. Reference Phillips, Anderson and Schapire2006) to predict species occurrence across our study area for each species. Maxent is a widely employed species distribution modelling platform that uses a deterministic, maximum-likelihood framework to efficiently analyse presence-only datasets (Hernandez et al. Reference Hernandez, Graham, Master and Albert2006; Buermann et al. Reference Buermann, Saatchi, Smith, Zutta, Chaves, Milá and Graham2008; Elith et al. Reference Elith, Phillips, Hastie, Dudík, Chee and Yates2011). Recent literature has identified the potential for dilution of species’ probability of occurrence in Maxent (see Royle et al. Reference Royle, Chandler, Yackulic and Nichols2012). We carefully optimized our analytical methodology to minimize potential biases in accordance with Elith et al. (Reference Elith, Phillips, Hastie, Dudík, Chee and Yates2011), however, we recognize the uncertainty associated with presence-only data (Royle et al. Reference Royle, Chandler, Yackulic and Nichols2012). We fit a Maxent model for each species using the default model parameters, which have been shown to perform well in multiple studies (Phillips & Dudík Reference Phillips and Dudík2008). We have no reason to assume sampling protocols were biased (for example because of easily accessible sample locations; Phillips et al. Reference Phillips, Dudík, Elith, Graham, Lehmann, Leathwick and Ferrier2009), therefore we considered all species as equally likely to occur across the target-background group (Merow et al. Reference Merow, Smith and Silander2013). We evaluated the models by using 10-fold cross validation and averaging the resultant area under the curve (AUC) values, which were the sum of the area under the receiver operating curve (ROC) for each iteration (Phillips et al. Reference Phillips, Anderson and Schapire2006). Models with AUCs ≥ 0.7 were considered to have performed well (Phillips & Dudík Reference Phillips and Dudík2008).
We formulated 10 predictor variables for use in our Maxent models, which included temporally relevant, spatially-explicit and publicly-available information on elevation, land use and land cover, levels of forest fragmentation, and distance to major features such as roadways and water bodies (see Supplementary material, Table S1). We acquired temporally relevant digital elevation and land cover data from the United States Geological Survey (USGS) and condensed the original 16 land-cover types from this data set into eight relevant, but broader categories, including agriculture, urban, forest, shrubland, herbaceous, wetlands, water bodies, and barren lands (see Supplementary material, Table S1). To capture the potential importance of finer-scaled species-specific habitat preferences, we also compiled information on detailed land use from existing New Jersey Department of Environmental Protection (NJDEP) data (NJDEP 2002), which categorized each cell within our study area as one of 39 land-use types (see Supplementary material, Table S1). We mapped the major rivers and roadways within the study area from existing NJDEP data and calculated the Euclidean distance from each raster cell to these features.
Because our target species rely on either mature or early successional forests, the total amount of contiguous forest may influence species distribution differently. Therefore, we examined the level of forest fragmentation with data acquired from the National Atlas of the United States (http://nationalatlas.gov/index.html), qualifying raster cells as edge, interior, perforated, patch, transitional, undetermined, non-forest, and water. In addition, using FRAGSTATS 4 (McGarigal et al. Reference McGarigal, Cushman and Ene2012), we calculated the contagion index, which is a measure of both patch type interspersion and dispersion (Riitters et al. Reference Riitters, O'Neill, Wickham and Jones1996), and also the shape index, which is a metric describing the area-perimeter ratio while accounting for patch size (Forman & Godron Reference Forman and Godron1986). We prepared all data layers at a 100-m resolution for subsequent habitat suitability modelling using ArcMap 10.1 (ESRI [Environmental Systems Research Institute] 2012).
We mapped the probability of occurrence of each species as a function of our environmental variables. To determine the influence of each predictor variable on our species-specific distribution models, we examined the permutation importance values generated by the Maxent analysis. These values are calculated as the normalized percentage of the drop in AUC resulting from the random permutation of the values of each predictor variable. When predictor variables are correlated, the permutation importance provides a robust indication of a variable's explanatory power. We then transformed our continuous Maxent output maps into binary maps displaying high and low probability of occurrence using the 10-percentile training presence of the Maxent outputs as a cut-off threshold (Phillips & Dudík Reference Phillips and Dudík2008; Rödder et al. Reference Rödder, Kielgast, Bielby, Schmidtlein, Bosch, Garner, Veith, Walker, Fisher and Lötters2009). We make no assumptions about the quality of the habitats identified in the models.
Land ownership map
A key component of our approach is the creation of a map depicting landownership categories across our study area. Our goal was not to identify the landowners themselves, but rather to group landownership types into socioecologically relevant categories (sensu Groves et al. Reference Groves, Kutner, Stoms, Murray, Scott, Schafale, Weakley, Pressey, Stein, Kutner and Adams2000). We designated federally-owned lands as national parks, scenic areas, wildlife refuges, and monuments. We considered state-owned lands to include state parks, forests, recreation areas, and wildlife management units. We classified open space and recreation areas as county- or municipally-owned. We used GIS layers provided by NJDEP and the New Jersey Department of Agriculture (NJDA) to create these maps (see Supplementary material, Table S2). All cells within the boundaries of these areas were designated as ‘publicly owned’, although we retained the identities of each cell under this category, creating sub-categories of federal, state, county and municipal ownership.
All cells not designated as publicly owned were designated as ‘privately owned’. We further subdivided privately-owned cells into land-use categories using NJDEP land cover and land use maps (see Supplementary material, Table S2). These categories included agriculture, storm water basins, utility rights-of-way, residential, commercial and services, industrial, airports, golf courses, non-profit conservation land, private forests (namely undeveloped, privately-owned woodland), and conservation and farmland preservation easements. The percentages of coverage for commercial and services, industrial, airports, golf courses, non-profit conservation land, utility rights-of-way, private forests and storm water basins were quite low (each < 2%); therefore, we grouped these categories into ‘other’ for all further analyses.
Extent of species occurrence across landownership categories
We overlaid our binary species occurrence maps onto the land ownership map and calculated the proportion of each species’ distribution that fell into each land ownership category. We then calculated the percentage of each species’ total distribution occurring on public versus private land, as well as occurring on our detailed land ownership subcategories.
Following Groves et al. (Reference Groves, Kutner, Stoms, Murray, Scott, Schafale, Weakley, Pressey, Stein, Kutner and Adams2000), we noted when over two-thirds of a species’ distribution occurred predominantly on public or private land. We also noted when more than one-third of a species’ distribution occurred in a public/private land ownership subcategory. However, it is entirely likely that distribution patterns of our focal species were primarily influenced by the unequal distribution of land ownership categories within our study area (for example, a field sparrow may occur predominantly on private land simply because the majority of our study area is private land). Therefore, we wanted to determine whether any species occurred on any land ownership category more than expected, given the total areal extent of that category within our study area. If we assume that there is no pattern to where species’ are found relative to land ownership, we should expect that the division of cells per landownership category for a species would largely reflect the overall division of land ownership across our study area. For example, if field sparrow was found at random with respect to land ownership, it should exhibit observed cell totals in public and private land ownership largely in proportion to the ratio of cells designated as publicly and privately owned overall.
We tested this prediction using a binomial distribution to generate random expectations per species of the number of cells in each ownership category (Zar Reference Zar1999). Let h(i,j) be the probability that cell (i,j) is suitable for habitat by Species A. If we assume that Species A is equally likely to occur in any of the cells within our study habitat, then this probability is equal to the percentage of our study area occupied by Species A. Let c(i,j) be the probability that cell (i,j) is owned by Category X. If we assume that Category X is equally likely to own any of the cells in our study area, then this probability is equal to the percentage of our study area owned by Category X.
This formulation enabled us to set up the following discrete random variable. Let Z be a random variable that denotes the number of cells that are owned by Category X which are also suitable habitat for Species A. We can assume that ownership category and suitability of habitat are independent variables, and that each cell is independent of any other cell, because parcels in the study area are small and land use is mixed. Therefore, Z can be cast as a Bernoulli trial that informs of the probability p of obtaining exactly k ‘successes’ in n coin flips. Thus the probability that the cell is both owned by Category X and suitable habitat for Species A (a ‘success’) is p = h(i,j) × c(i,j). Given this, the probability distribution of Z is:
 $P\left( {Z = k} \right) = \left( {\begin{array}{*{20}{c}} n\\ k \end{array}} \right){p^k}{\left( {1 - p} \right)^{n - k}}$
where n is the total number of cells. Since Z is a Bernoulli random variable, its expected value (or mean) is n × p, and the standard deviation is
 $\sqrt {np(1 - p)} $
.
Because p is known, we can calculate the probability of obtaining a value equal to the observed cells per ownership category (X) or more extreme for each species, using the binomial equation,
 $R = \left( {\frac{{n!}}{{X!\left( {n - X} \right)!}}} \right){p^X}~{\left( {1 - p} \right)^{n - x}}$
(Zar Reference Zar1999). This R-value can be compared to an alpha value of 0.05 to judge statistical significance, which in this case indicates that a species is more often found within a particular land ownership category than expected by chance alone (Zar Reference Zar1999). In such cases, we refer to these species as being dependent upon these landownership categories for their conservation needs.
Hotspots
As a final step, we combined the distribution maps for each species within a guild (mature forest and early successional forest) to create ‘hotspot’ maps to identify landownership categories that may be highly valued for their importance to an entire guild of forest birds. We first scaled each individual species’ probability of occurrence to 1 by dividing all probabilities by the highest probability obtained in that species’ map. We then added all the scaled individual species’ probabilities together within each guild, so that the maximum possible values were 10 for mature and 8 for early successional birds (the total number of species in each guild). We scaled these composite occurrence maps to 1 so that they were directly comparable to each other (thus the hottest spot for mature-forest birds had the same score as the hottest spot for early successional birds). We set a threshold composite probability of occurrence at 10% of the highest value and designated only those locations that exceeded this threshold as hotspots.
RESULTS
Species’ distribution models
All Maxent models performed well, with AUC values ranging from 0.70 (black-billed cuckoo, Coccyzus erythropthalmus) to 0.94 (cerulean warbler) (see Supplementary material, Table S3). The exception was the northern flicker (Colaptes auratus), with an AUC score of 0.66; however, this value was within one standard deviation of the 0.70 performance threshold, therefore we consider the model to be a reasonably accurate predictor of northern flicker occurrence. Variables with higher predictive value across most species included elevation, land use, and forest fragmentation (see Supplementary material, Table S3). Mature forest birds were predicted to occur at higher elevations than early successional birds. They were also associated with interior or forest patches, whereas early successional bird species were regularly associated with transitional forests. Mature forest birds were associated with land-use categories that represented forests with > 50% canopy closure, while early successional birds were associated with land-use categories that reflected more open canopy (10–50% canopy closure) mixed forest types or deciduous brush/shrublands (see Supplementary material, Table S3). According to our distribution models, species occupied between 3% (cerulean warbler) and 52% (wood thrush) of our study area, with the average being 31% (Table 1; see Supplementary material, Figs S1–S18).
Land ownership
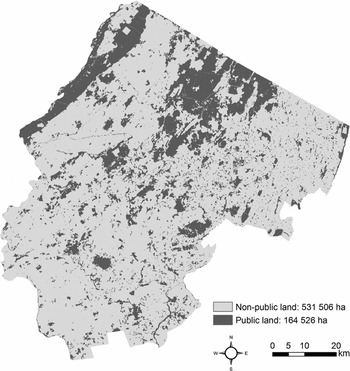
Roughly 23% of our study area was owned by public agencies (164 526 ha); of this, 45% was owned by the State of New Jersey (Fig. 2). Counties and municipalities owned 14% and 28% of public lands, respectively, and the USA federal government owned the remaining 13%. Of the 531 506 ha of privately-owned land in our study area, most was in residential development (40%) or agricultural production (31%).
Diagrammatic map of public ownership in the study area, indicating the large tracts of state- or federally-owned forests in the north-west and small, highly-fragmented parcels surrounded by urban land uses in the remainder of the area.

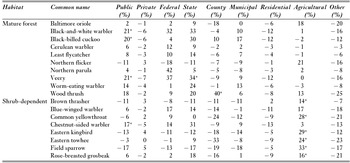
Only one species, the cerulean warbler, had more than two-thirds of its predicted distribution occurring on public lands, with most occurrences on state-owned lands. In contrast, 10 of our focal species had over two-thirds of their predicted distributions occurring on private lands. Of these, six early successional forest bird species and two mature forest birds had over a third of their distributions occurring on agricultural lands (Table 2).
Observed percentage of each species’ suitable habitat within each ownership category minus their expected percentage. *More of this species’ habitat is contained within that ownership category than statistically expected by chance alone (see text).

We identified nine species that were predicted to occur within various land ownership categories more often than expected by chance (Table 2). Three mature forest birds, the veery (Catharus fuscescens), black-billed cuckoo, and black-and-white warbler (Mniotilta varia), were found more often on public lands than expected by chance, with the veery occurring preferentially on state-owned lands (Table 2). Land ownership also significantly influenced predicted occurrence of six early successional bird species, including the blue-winged warbler, common yellowthroat (Geothlypis trichas), chestnut-sided warbler (Setophaga pensylvanica), eastern kingbird (Tyrannus tyrannus), field sparrow, and rose-breasted grosbeak (Pheucticus ludovicianus). Chestnut-sided warbler presence was biased toward public lands, while the remaining five early successional forest bird species occurred more often on agricultural lands than expected (Table 2). All other species appeared to have suitable habitat spread relatively randomly among land ownership categories.
Hotspots
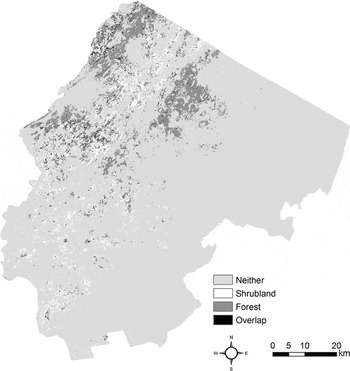
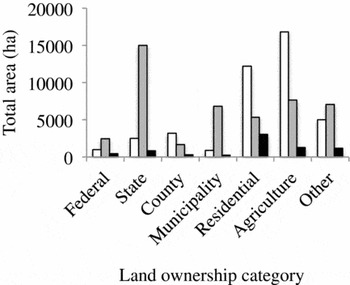
The threshold composite probabilities of occurrence for early successional and mature forest birds were 0.565 and 0.533, respectively. In total, we designated 87 762 ha as hotspots, with just over half of this total representing mature forest bird hotspots (Fig. 3). The vast majority of the mature forest bird hotspots fell within state-owned lands, with the remaining portions distributed primarily between municipal, residential and agricultural landownership types (Fig. 4). In contrast, early successional forest bird hotspots fell almost exclusively within residential or agricultural landownership categories (Fig. 4). Hotspots for each guild were geographically distinct, with only 7352 ha (8%) representing an overlapping hotspot for both mature forest and early successional forest birds. Locations with the greatest overlap occurred in lower elevation residential areas that lay adjacent to either privately-owned forested or agricultural land (Fig. 3).
Hotspots for mature-forest and early successional birds within our study area, as well as hotspots for both guilds.

Total hectares found within mature forest (grey bars) and early successional bird hotspots (white bars) according to land ownership categories. Black bars indicate the total area of hotspot overlap for both guilds.

DISCUSSION
Options for conservation actions are constrained to a large extent by who owns the land supporting imperilled species (Bengston et al. Reference Bengston, Fletcher and Nelson2004). Certainly there is a recognition in conservation planning that many threatened species rely to a great extent on privately-owned lands (Scott et al. Reference Scott, Davis, McGhie, Wright, Groves and Estes2001; Robles et al. Reference Robles, Flather, Stein, Nelson and Cutko2008; Mir & Dick Reference Mir and Dick2012), and therefore the need to engage landowners in management is considerable (Scott et al. Reference Scott, Davis, McGhie, Wright, Groves and Estes2001; Robles et al. Reference Robles, Flather, Stein, Nelson and Cutko2008; Mir & Dick Reference Mir and Dick2012). Our results are consistent with previous studies examining the ability of public lands to support imperilled species (see Groves et al. Reference Groves, Kutner, Stoms, Murray, Scott, Schafale, Weakley, Pressey, Stein, Kutner and Adams2000; Scott et al. Reference Scott, Davis, McGhie, Wright, Groves and Estes2001; Thogmartin & Rohweder Reference Thogmartin, Rohweder, Rich, Arizmendi, Demarest and Thompson2009). Four of our 18 species were heavily reliant upon publicly-owned land, and state-owned land in particular. In contrast, for 10 of our species, over two-thirds of the area where they were predicted to occur was located on privately-owned land. We also identified a clear dichotomy in landownership patterns between the two guilds of imperilled forest bird species. With the exception of chestnut-sided warblers, birds dependent on mature forests are preferentially found on state-owned lands, while birds dependent on early successional forest habitat are found preferentially on privately-owned lands currently used for agriculture. This pattern is also clearly present when considering who owned guild hotspots. State-owned land represented the largest fraction of hectares supporting mature forest bird hotspots, whereas privately-owned agricultural lands supported an equal number of hectares of early successional forest bird hotspots. Very few areas across the landscape were considered hotspots for both guilds, except in residential areas, which may reflect the highly varied vegetation types within this land use category.
There are historical land-use legacies and ecological reasons for this dichotomy. Ecologically, for forests to support both guilds of birds they must be internally heterogeneous, with expanses of mature forest intermixed with various-sized gaps that are in an early successional state (Kittredge et al. Reference Kittredge, Finley and Foster2003; Swanson et al. Reference Swanson, Franklin, Beschta, Crisafulli, DellaSala, Hutto, Lindenmayer and Swanson2010). Such situations were common in the north-eastern USA before the Industrial Revolution, but are now rare (Dettmers Reference Dettmers2003). State-owned forests tend to be high elevation, located in the north-west corner of the state, and represent the last remaining undeveloped large tracts of forest in the state (Lathrop Reference Lathrop2011). Like many publicly-owned forests in the north-eastern USA, these areas are rarely logged (Kittredge et al. Reference Kittredge, Finley and Foster2003). We suggest that these circumstances have led to state-owned forests housing large fractions of habitat for nearly all threatened birds that rely on the vegetation structure of mature forests. However, they do not include large fractions of habitat for birds dependent on early successional forests.
Much of the distribution of early successional forest birds occurs on privately-owned land that is managed predominantly for agriculture. These parcels tend to be lower elevation, spread throughout our study area, and highly fragmented. Not all agricultural practices result in the production of suitable habitat for early successional forest bird species. However, the field margins and small woodlands surrounding farm fields may be kept in an early successional forested state by landowners (Benton et al. Reference Benton, Vickery and Wilson2003). We show that a portion of these small habitat patches represent the largest fraction of remaining habitat for declining early successional forest birds. Given this pattern, it would be useful to know what differentiates agricultural parcels that represent suitable habitat for our target species from those parcels that do not (Norris Reference Norris2008). This effort can highlight on-site management actions that support our target species, greatly informing which best-practices to require within incentive-based conservation programmes (see Merckx et al. Reference Merckx, Feber, Riordan, Townsend, Bourn, Parsons and Macdonald2009). Factors likely to dictate the habitat suitability of agricultural lands for forest birds include the extent of non-productive forested habitats retained around actively farmed fields, the types of crops sown on farm land, the crop or tree harvest rotation used, the landscape context in which these areas sit (Benton et al. Reference Benton, Vickery and Wilson2003; Norris Reference Norris2008), and the degree to which habitat patches on adjoining parcels are aggregated to maximize total patch size. The landownership patterns we show here provide insight into the need for markedly different approaches to conservation for different species. Recovery of mature forest birds depends largely on the success of managing state-owned lands. Thus, state biologists and land managers can follow standard protocols for developing and executing comprehensive management plans for these threatened species. For example, existing state-owned forests could be made more heterogeneous via targeted timber harvests (Askins et al. Reference Askins, Zuckerberg and Novak2007). Current conservation efforts promote management practices to increase heterogeneity of both physical and age structure of second growth forests, primarily for the benefit of early successional forest birds. However, there are important trade-offs to consider when developing forest management plans. For example, a primary recommendation for golden-winged warbler (Vermivora chrysoptera) conservation is to maintain 15–20% of a forest landscape in an early successional state (Roth et al. Reference Roth, Rohrbaugh, Will and Buehler2012). This action likely comes at the expense of the veery, which requires core forest patch sizes > 400 ha in landscapes of 70% forest cover (Rosenberg et al. Reference Rosenberg, Hames, Rohrbaugh, Swarthout, Lowe and Dhondt2003) that may only exist on public lands. Our results provide the basis on which to evaluate such management trade-offs, and we suggest that similar efforts to ours, carried out at policy-relevant scales, are needed to better inform public forest best management practices.
In contrast, successful recovery efforts of early successional forest birds will clearly require the engagement and participation of farmers, particularly at larger scales (Thogmartin et al. Reference Thogmartin, Crimmins and Pearce2014). Several policy tools to protect farmlands are available, and many are actively used in New Jersey (Langpap Reference Langpap2006; Matta et al. Reference Matta, Alavalapati and Tanner2007). Such tools include farmland preservation, landowner incentive programmes, and private forest best management practices (Bengston et al. Reference Bengston, Fletcher and Nelson2004). These programmes typically take an ad hoc approach to conservation, enrolling individual farm parcels without a more unified vision of how all enrolled farms will function as an ecological ‘whole’ (Dutton et al. Reference Dutton, Edwards-Jones, Strachan and Macdonald2008). This is mostly due to the voluntary nature of incentive-based programmes; it is difficult to optimize incentive (or acquisition) programmes when the determining factor in enrolment is landowner willingness to participate (Dutton et al. Reference Dutton, Edwards-Jones, Strachan and Macdonald2008; Ciuzio et al. Reference Ciuzio, Hohman, Martin, Smith, Stephens, Strong and Vercauteren2013). We suggest that more cohesive regional strategies are made far easier by an explicit recognition of the subset of imperilled species that rely on agricultural lands, and a detailed understanding of where existing populations of these species can currently be found (Norris Reference Norris2008). It is important to note that the conservation status of species may vary across regions, therefore selecting the appropriate suite of species on which to focus conservation efforts forms the basis for any effective regional strategy. Because early successional habitat is ephemeral (it succeeds into mature forest, or is returned to production), there is the possibility that the ownership of early successional habitat will itself shift. Newly-created early successional forest may not to be owned by farmers, as we document here, but be instead owned by other entities. We did not address this possibility, but the extent to which ownership changes for early successional habitat (or for any land cover type) is a critical but understudied factor for devising effective private-land conservation measures.
Our analysis does not address where suitable habitat could be created for any of our target species. The trends identified through the integration of our species’ predicted distribution and landownership maps provide the basis for evaluating such options within the context of optimal reserve (or restoration) planning protocols (Crossman et al. Reference Crossman, Bryan, Ostendorf and Collins2007; Guerrero et al. Reference Guerrero, Knight, Grantham, Cowling and Wilson2010). Such efforts must take into account where suitable habitat exists now, who owns the lands that connect large segments of suitable habitat, and thus how readily these lands could be acquired or restored to satisfy conservation objectives; all of which we provide here (Guerrero et al. Reference Guerrero, Knight, Grantham, Cowling and Wilson2010). Targeting parcels for acquisition and then appropriately managing the private lands surrounding them through incentive-based programmes may overcome current conservation challenges by relaxing budgetary constraints and preserving adequate tracts of targeted ecological communities. Optimization models generated at a regional scale may guide decisions about how to manage particular parcels, providing the conservation practitioner with quantifiable conservation targets and the landowner with specific directives regarding how to manage the landscape.
ACKNOWLEDGEMENTS
This project was supported by the New Jersey Agricultural Experiment Station and by the USDA-National Institute for Food and Agriculture, McIntire Stennis project number NJ17317). We thank Sharon Petzinger and Amanda Dey of the New Jersey Endangered and Nongame Species Program for use of their bird survey data, and the Rutgers Center for Remote Sensing and Spatial Analysis for technical support. We appreciate the analytical input provided by Brad Greening, Curtis Burkhalter, and Kevin Aagaard.
Supplementary material
To view supplementary material for this article, please visit http://dx.doi.org/10.1017/S0376892915000041