INTRODUCTION
Approximately one thousand years ago, during the Medieval Climate Anomaly (AD 950–1250), the Thule spread throughout the American Arctic and “replaced” the existing Paleo-Eskimo populations. This represented the final ancient human migration into the American Arctic (Raghavan et al. Reference Raghavan, DeGiorgio, Albrechtsen, Moltke, Skoglund, Korneliussen, Grønnow, Appelt, Gulløv, Friesen, Fitzhugh, Malmström, Rasmussen, Olsen, Melchior, Fuller, Fahrni, Stafford, Grimes, Renouf, Cybulski, Lynnerup, Lahr, Britton, Knecht, Arneborg, Metspalu, Cornejo, Malaspinas, Wang, Rasmussen, Raghavan, Hansen, Khusnutdinova, Pierre, Dneprovsky, Andreasen, Lange, Hayes, Coltrain, Spitsyn, Götherström, Orlando, Kivisild, Villems, Crawford, Nielsen, Dissing, Heinemeier, Meldgaard, Bustamante, O’Rourke, Jakobsson, Gilbert, Nielsen and Willerslev2014). While earlier Paleo-Eskimo groups were predominantly seasonally mobile foragers, the Thule established networks of sedentary villages strategically placed in prime locations to hunt seal, whale, and avian populations. Thule success in these challenging environments has long been attributed to their effective means for transportation, specifically dog sleds and large skin boats, and their sophisticated harpoon float gear for hunting large whales (Maxwell Reference Maxwell1985; McGhee Reference McGhee1996).
The recent resurgence of radiocarbon (14C) dating in Arctic archaeology has revealed that the Point Barrow area at the northernmost tip of Alaska played a pivotal role in Thule emergence and later served as the origin point for Thule migrations into the eastern Arctic (Jensen Reference Jensen2009a, Reference Jensen2009b; McGhee Reference McGhee, Maschner, Mason and McGhee2009; Morrison Reference Morrison, Maschner, Mason and McGhee2009). Thus far, 238 14C measurements have been obtained on archaeological samples from this area; primarily from marine mammals, driftwood, and human skeletal remains.
Conversely, the level of chronological precision that has been achieved for the interpretation of this data has been quite coarse, because almost all of the 14C dated samples are either potentially residual or contain significant portions of marine-derived carbon (Jensen Reference Jensen2009a, Reference Jensen2009b, Reference Jensen, Auerbach, Hilton and Cowgil2014). Arctic MRE offsets can vary from several hundred to over a thousand years, depending on the extended residence time of 14C in local oceanic environments (McNeely et al. Reference McNeely, Dyke and Southon2006), which presents a challenge for producing accurate 14C calibrations. Point Barrow is located at the confluence of the Chukchi Sea and the Beaufort Sea, further complicating the issue due to marine creatures living in and across these two bodies of water.
ΔR values provide a local offset from the global MRE for surface waters (Queiroz-Alves et al. Reference Queiroz-Alves, Kita, Philippa and Christopher Bronk2018). In the case of Point Barrow, the ΔR value traditionally used for interpretation (506 ± 69 yr) is a weighted-mean of four values which have been calculated by dating known-age bivalves collected in 1913 from Point Barrow, the only ΔR values currently available for this study area (McNeely et al. Reference McNeely, Dyke and Southon2006). While these early 20th century MRE values are normally applied to correct offsets from the Point Barrow area, it is questionable how reflective more recent values are of those from the past. Changes in upwelling, climate, and ocean currents will inevitably result in changes in local MRE values through time (Russell et al. Reference Russell, Cook, Ascough and Dugmore2010), and estimating ancient MRE values is a research topic that so far has been overlooked in the Alaskan Arctic.
Numerous contexts are available in the study area with contemporaneously deposited samples of marine- and terrestrial-derived carbon for 14C dating, primarily from frozen in situ domestic Thule contexts with discarded, processed seal and caribou remains (Ford Reference Ford1959; Stanford Reference Stanford1976; Hall and Fullerton Reference Hall and Fullerton1990; Sheehan Reference Sheehan1997; Jensen Reference Jensen2009a). This study has followed the multiple pair approach of Ascough et al. (Reference Ascough, Cook and Dugmore2009) and Russell et al. (Reference Russell, Cook, Ascough and Dugmore2010), whereby paired terrestrial and marine samples (e.g. seal bone and caribou bone) have been utilized to assess the ΔR values directly from animals consumed by the Thule population.
Previous analysis of δ13C and δ15N values from Thule skeletons interred in the Point Barrow region suggests that seals were the most significant food in Thule diets (Coltrain et al. Reference Coltrain, Tackney and O’Rourke2016). Seals in Point Barrow regularly move throughout the coastal portions of the Chukchi Sea and Beaufort Sea during the open water season each year (Lowry et al. Reference Lowry, Frost, Davis, DeMaster and Suydam1998; Bengtson et al. Reference Bengtson, Hiruki-Raring, Simpkins and Boveng2005; Harwood et al. Reference Harwood, Smith and Auld2012) and adult ring seals tend to be more territorial during the rest of the year (Krafft et al. Reference Krafft, Kovacs and Lydersen2007; Kelly et al. Reference Kelly, Badajos, Kunnasranta, Moran, Martinez-Bakker, Wartzok and Boveng2010; Crawford et al. Reference Crawford, Frost, Quakenbush and Whiting2012; Harwood et al. Reference Harwood, Smith and Auld2012). The seal bones sampled for this project are all identified as likely ring seal (Phoca hispida) (Table 1) and so are likely to strongly reflect local marine reservoirs throughout the Chukchi Sea and Beaufort Sea. Thus, our ΔR for the Thule population is different than one based on measurements of sedentary marine organisms, which is not what local Thule communities were eating. Therefore, as it is derived directly from the foods that the Thule were eating, our suggested best-fit ΔR value based on paired samples of seal bone and caribou bone is more suitable for the correction of 14C measurements from Point Barrow’s human population.
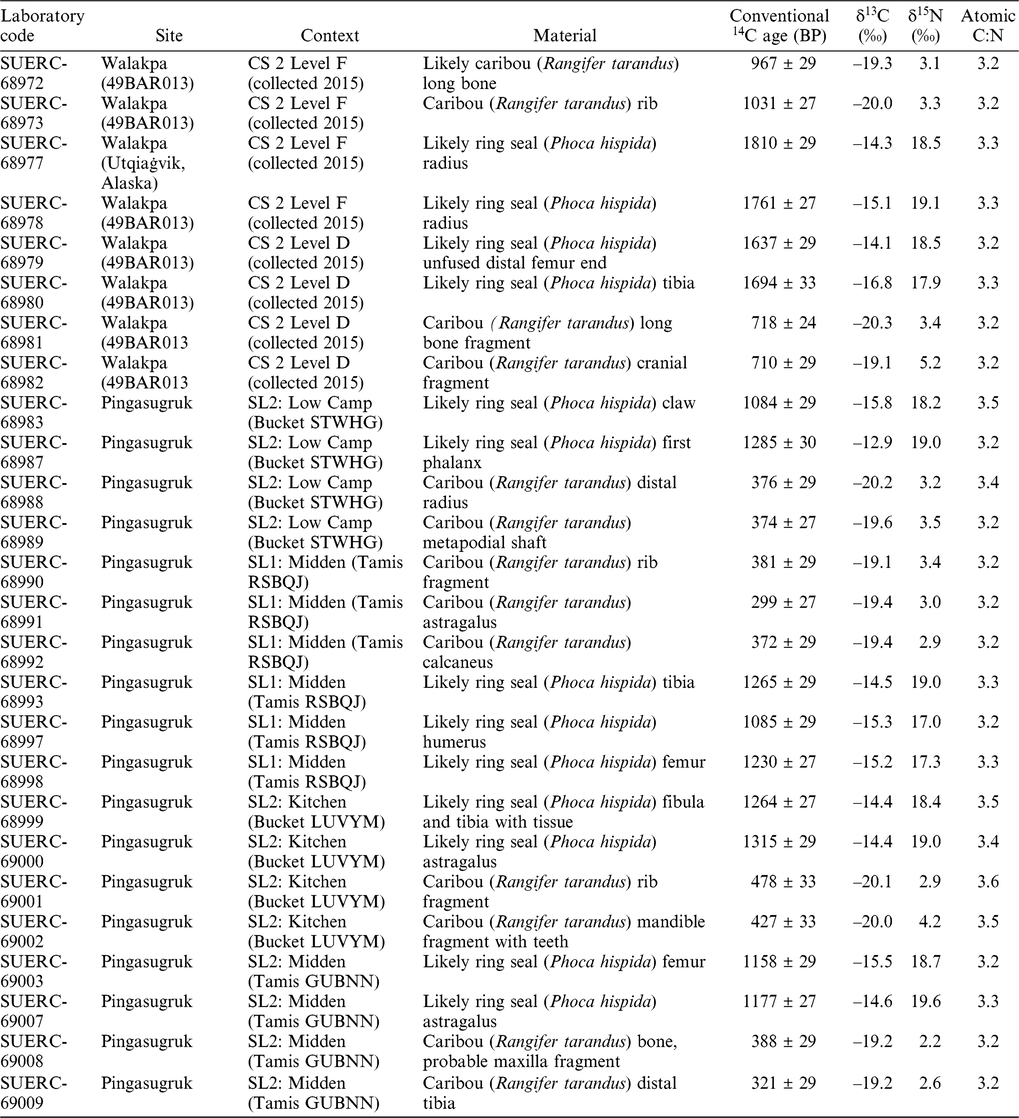
New 14C measurements collected for the estimation of ΔR values.

This best-fit ΔR approach further allows for the correction and Bayesian modeling of 14C data from human skeletons from the largest ancient cemetery in northwest Alaska (Nuvuk, Point Barrow). Advances in the statistical modeling of 14C dates and archaeological data within a Bayesian framework is enabling researchers to better understand similar mortuary chronologies and even produce date estimates at generational-levels (Bayliss Reference Bayliss2009; Bayliss et al. Reference Bayliss, Bronk Ramsey, van der Plicht and Whittle2007, Reference Bayliss, van der Plicht, Bronk Ramsey, McCormac, Healy, Whittle, Whittle, Healy and Bayliss2011).
METHODOLOGY
ΔR values, used to correct for local MRE 14C offsets, were calculated using an analysis of multiple paired marine and terrestrial samples following the methods described in Russell (Reference Russell2011) and Russell et al. (Reference Russell, Cook, Ascough and Scott2015). Twenty-six single-entity samples of paired caribou and seal bone were submitted for radiocarbon dating from eight secure archaeological contexts, specifically from contexts where such samples were frozen in situ (Table 1).
These samples were submitted to the Scottish Universities Environmental Research Centre (SUERC) to be measured by accelerator mass spectrometry (AMS). Since the samples were well-preserved in the frozen Arctic environment, they were pretreated following the protocols for forensic bone described in Dunbar et al. (Reference Dunbar, Cook, Naysmith, Tripney and Xu2016), where a lipid extraction process is employed prior to the standard collagen extraction method employed in the laboratory. Graphite targets were prepared and measured following Naysmith et al. (Reference Naysmith, Cook, Freeman, Scott, Anderson, Dunbar, Muir, Dougans, Wilcken, Schnabel, Russell, Ascough and Maden2010). SUERC maintains rigorous internal quality assurance procedures and participation in international inter-comparisons (Scott Reference Scott2003; Scott et al. Reference Scott, Bryant, Cook and Naysmith2003, Reference Scott, Cook, Naysmith, Bryant and O’Donnell2007, Reference Scott, Cook and Naysmith2010), thus validating the measurement precision quoted for the 14C ages. The C:N ratios suggest that bone preservation was sufficiently good to have confidence in the accuracy of the 14C determinations (Table 1; Masters Reference Masters1987; Tuross et al. Reference Tuross, Fogel and Hare1988). Conventional 14C ages (Stuiver and Polach Reference Stuiver and Polach1977) are presented in Table 1, quoted according to the international standard set at the Trondheim Convention (Stuiver and Kra Reference Stuiver and Kra1986). Calibrated date ranges were calculated using the relevant terrestrial or marine calibration curve of Reimer et al. (Reference Reimer, Bard, Bayliss, Beck, Blackwell, Ramsey, Buck, Cheng, Edwards, Friedrich, Grootes, Guilderson, Haflidason, Hajdas, Hatté, Heaton, Hoffmann, Hogg, Hughen, Kaiser, Kromer, Manning, Niu, Reimer, Richards, Scott, Southon, Staff, Turney and van der Plicht2013) and OxCal v4.3. Calibrations are cited in the text as 95% confidence intervals, with the end points rounded outwards to 10 years.
Carbon (δ13C) and nitrogen (δ15N) isotopic values were analyzed using a Thermo Scientific Delta V Advantage continuous-flow isotope ratio mass spectrometer (CF-IRMS) coupled via a Thermo Scientific ConfloIV to a Costech ECS 4010 elemental analyzer (EA) fitted with a pneumatic auto sampler. Samples were weighed into tin capsules (~600 µg) and combusted in the presence of oxygen in a single reactor containing tungstic oxide and copper wires at 1020°C to produce N2 and CO2. A magnesium perchlorate trap was used to eliminate water produced during the combustion process and the gases were separated in a 2-m stainless steel Porapak QS 50-80 mesh GC column heated to 70°C. Helium (100 mL/min) was used as a carrier gas throughout the procedure. N2 and CO2 entered the mass spectrometer via an open split arrangement within the ConfloIV and were analyzed against their corresponding reference gases. For every 10 unknown samples, in-house gelatin standards, which are calibrated to the International Atomic Energy Agency (IAEA) reference materials USGS40 (L-glutamic acid, δ13CV-PDB = –26.39‰), USGS41 (L-glutamic acid, δ13CV-PDB = +37.63‰), IAEA-CH-6 (sucrose, δ13CV-PDB = –10.45‰), USGS25 (ammonium sulfate, δ15NAIR = –30.41‰), IAEA-N-1 (ammonium sulfate, δ15NAIR = +0.43‰) and IAEA-N-2 (ammonium sulfate, δ15NAIR = +20.41‰), were run in duplicate. Results are reported as per mil (‰) relative to the internationally accepted standards VPDB and AIR, with 1σ precisions of ±0.2‰ and ±0.3‰ for δ13C and δ15N, respectively.
Following Cook et al. (Reference Cook, Ascough, Bonsall, Hamilton, Russell, Sayle, Scott and Bownes2015), 14C ages for material whose carbon has derived from both terrestrial and marine sources were corrected using a mixed terrestrial and marine calibration curve that combines the internationally agreed calibration curves of Reimer et al. (Reference Reimer, Bard, Bayliss, Beck, Blackwell, Ramsey, Buck, Cheng, Edwards, Friedrich, Grootes, Guilderson, Haflidason, Hajdas, Hatté, Heaton, Hoffmann, Hogg, Hughen, Kaiser, Kromer, Manning, Niu, Reimer, Richards, Scott, Southon, Staff, Turney and van der Plicht2013) for terrestrial/atmospheric samples (IntCal13) with the calibration curve used for marine samples (Marine13). It is a modeled calibration because there is more than one way to determine the percentage of diet that derived from terrestrial/marine resources. As such, the results will vary slightly depending on the method used.
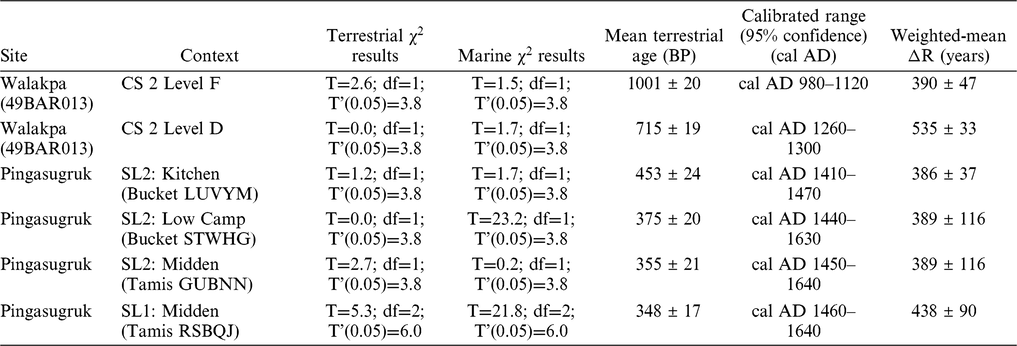
Paired terrestrial-terrestrial and marine-marine 14C measurements from individual contexts were subject to Ward and Wilson (Reference Ward and Wilson1978) χ2 tests to evaluate the independent contemporaneity of the samples within each of these two groups (Table 2). Where the pairs from the same context passed the χ2 test they were considered suitable for use in making the ΔR estimation. Following Russell (Reference Russell2011), ΔR values were calculated for every possible pairing of marine-terrestrial samples within individual contexts. The calculated weighted-mean ΔR was then used in calibration to correct for local reservoir effects from marine carbon.
Results of χ2 testing, calculated dates, and ΔR values for each context.

The Fortran/Unix ΔR calculation program described in Russell (Reference Russell2011) was used for analysis. This program calculates ΔR values through the conversion of the terrestrial 14C measurements to modeled marine 14C age bounds using interpolation between the IntCal13 atmospheric curve and the Marine13 curve (Reimer et al. Reference Reimer, Bard, Bayliss, Beck, Blackwell, Ramsey, Buck, Cheng, Edwards, Friedrich, Grootes, Guilderson, Haflidason, Hajdas, Hatté, Heaton, Hoffmann, Hogg, Hughen, Kaiser, Kromer, Manning, Niu, Reimer, Richards, Scott, Southon, Staff, Turney and van der Plicht2013). The difference between the modeled and the measured marine age is the ΔR value. The 1σ error on the ΔR values is calculated by a propagation of errors as shown in Equation 5.2 in Russell (Reference Russell2011). A weighted-mean ΔR was calculated to provide a single representative value for each context, placing more weight on the values with lower associated errors, as is commonplace in statistical manipulations. An additional weighted-mean of the weighted-mean values was calculated to provide a single representative ΔR value for the Point Barrow area during the Thule period. This ΔR value was then used in calibration to correct for local reservoir effects from marine carbon.
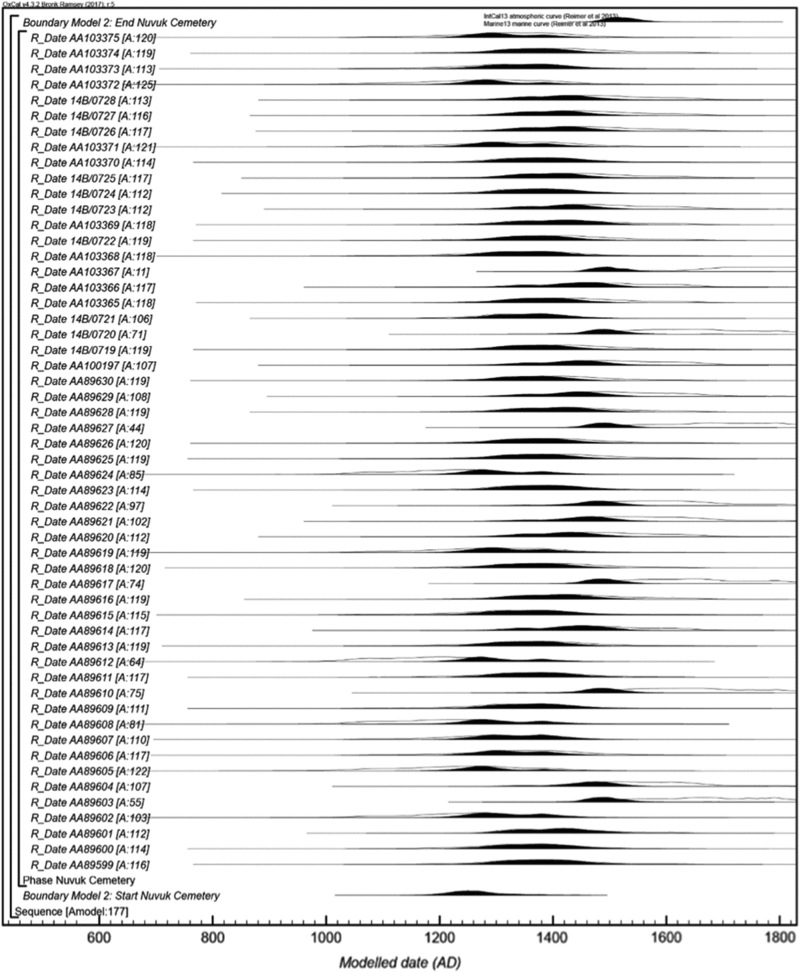
The technique used for Bayesian chronological modeling is a form of Markov Chain Monte Carlo sampling (Buck et al. Reference Buck, Kenworthy, Litton and Smith1991, Reference Buck, Cavanagh and Litton1996) and has been applied using the program OxCal v4.3 (http://c14.arch.ox.ac.uk/). Details of the algorithms employed by OxCal v4.3 are available in Bronk Ramsey (Reference Bronk Ramsey1995, Reference Bronk Ramsey1998, Reference Bronk Ramsey2001, Reference Bronk Ramsey2009) or from the online manual. The fit between the OxCal model and data is gauged with the Amodel agreement index, with values higher than 60 indicative of good agreement between the model parameters and the dates (Bronk Ramsey Reference Bronk Ramsey1995). Resulting posterior density estimates from OxCal are calendar years and presented in italics as probability ranges with end points rounded outward to the nearest five years. The algorithms used in the models can be derived from the OxCal keywords and bracket structure shown in the probability distribution plot (Figures 1–3; see supplementary materials for OxCal codes for Models 1 and 2). It should be emphasized that the posterior density estimates produced by modeling are not absolute. They are interpretative estimates, which can and will change as further data become available and as other researchers choose to model the existing data from different perspectives.
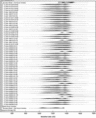
Results and structure of Model 1. The brackets and keywords define the model structure. The outlined distribution is the result of 14C calibration and the solid distributions are the chronological model results. The large square “brackets” along with the OxCal keywords define the overall model exactly.

Results and structure of Model 2. The brackets and keywords define the model structure. The format is as described in Figure 1.

Posterior probabilities for estimated mortuary activity span from the Bayesian models.

THE SAMPLES AND MODELS
Coltrain et al. (Reference Coltrain, Tackney and O’Rourke2016) report AMS 14C and stable isotope measurements from 54 Thule individuals buried in the Nuvuk cemetery. Following the linear dietary model of Arneborg et al. (Reference Arneborg, Heinemeier, Lynnerup, Nielsen, Rud and Sveinbjornsdottir1999), the percentage of terrestrial protein consumed (with an uncertainty of 10%) was calculated in Coltrain et al. (Reference Coltrain, Tackney and O’Rourke2016: Table 1) using –12.0‰ and –20.0‰ as δ13C end members, where –20.0‰ equated to a 100% terrestrial diet, and –12.0‰ represented a 100% marine diet. These dietary estimates are used in the first Bayesian chronological model (Model 1). The second model (Model 2) uses dietary estimates calculated with the same linear equation, but with different δ13C end members. Specifically, in Model 2 the average δ13C measured for caribou and seal bones sampled for this study (Table 1) is used to estimate the terrestrial and marine dietary end members, respectively, after adjustment for a trophic level shift of +1‰ (following DeNiro and Epstein Reference DeNiro and Epstein1978). 14C calibrations for this study were corrected using OxCal and “mixing” the two calibration curves at the calculated percentages for the two different models. Local reservoir effects from marine carbon were corrected with weighted-mean ΔR correction estimated in this study.
The 14C dates from human skeletons were modeled using the prior assumption that they are representative of a single, relatively uniform phase of mortuary activity and have been placed into unordered phases corresponding to their archaeological context. Boundaries were used in OxCal to estimate the start and end date of the overall unordered group.
RESULTS
The measured δ13C values of the terrestrial mammal bones used within this study (–19.1‰ to –22.8‰), are slightly more enriched when compared to the typical range for animals existing on purely terrestrial dietary resources in C3-dominated environments (e.g. DeNiro and Epstein Reference DeNiro and Epstein1978; Chisholm et al. Reference Chisholm, Nelson and Schwarcz1982; Schoeninger and DeNiro Reference Schoeninger and DeNiro1984; Peterson and Fry Reference Peterson and Fry1987; Post Reference Post2002) as caribou tend to have more enriched δ13C values when compared to other herbivores due to seasonal lichen consumption (Fizet et al. Reference Fizet, Mariotti, Bocherens, Lange-Badré, Vandermeersch, Borel and Bellon1995; Drucker et al. Reference Drucker, Hobson, Ouellet and Courtois2010; Britton et al. Reference Britton, Knecht, Nehlich, Hillerdal, Davis Richard and Richards Michael2013).
All terrestrial 14C measurements within paired contexts pass the Ward and Wilson (Reference Ward and Wilson1978) χ2 tests, ensuring confidence in the contemporaneity of the terrestrial samples (Table 2). Four of the six pairs of marine 14C measurements within paired contexts pass the Ward and Wilson (Reference Ward and Wilson1978) χ2 tests, ensuring confidence in the contemporaneity of those pairs (Table 2). ΔR values from each pairing are shown in Table 2 where they are sorted by the mean terrestrial calibration in each context. These values range from 389 ± 116 yr to 535 ± 33 yr. Excluding the two contexts that failed χ2 tests, the weighted-mean value for Point Barrow area during the Thule period is 450 ± 84 yr.
The average δ13C measured for seal and caribou bones sampled for this study is –14.8‰ and –19.6‰, respectively (Table 1). These mean values were adjusted by a trophic level shift of +1‰ (following DeNiro and Epstein Reference DeNiro and Epstein1978) to estimate the terrestrial and marine dietary end members for Model 2 (–13.8‰ and –18.6‰). When compared to the dietary estimates provided by Coltrain et al. (Reference Coltrain, Tackney and O’Rourke2016), the use of these δ13C end members results in lower estimates for the percentages of terrestrial protein consumed for the dated human skeletons from the Nuvuk cemetery.
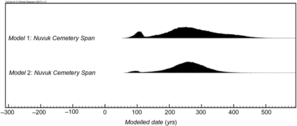
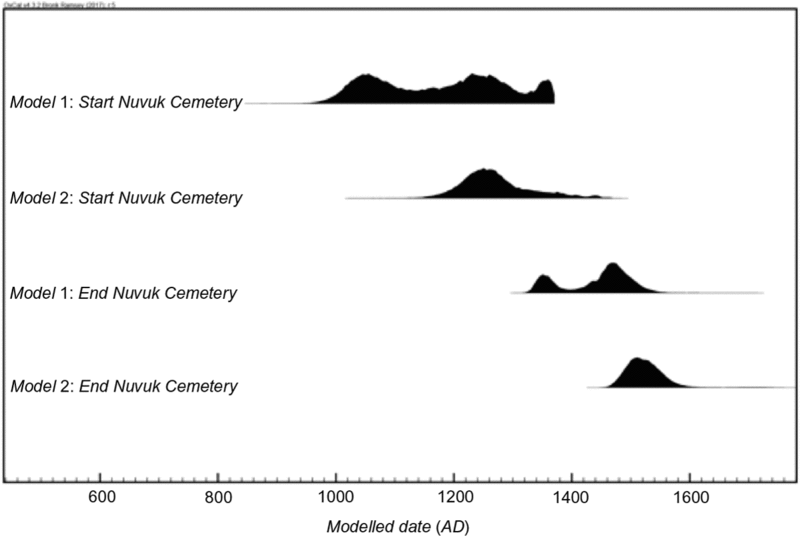
The 14C dates are in good agreement with the Bayesian model assumptions of both models (Amodel=189.6; Amodel=178.7). Modeling estimates that mortuary activity related to the directly dated human skeletons at the Nuvuk cemetery began in cal AD 1000–1370 (95% probability; Figure 1;Model 1: Boundary Start Nuvuk Cemetery) in Model 1 and cal AD 1165–1445 (95% probability; Figure 1;Model 2: Boundary Start Nuvuk Cemetery) in Model 2. This mortuary activity is estimated to have ended in cal AD 1330–1535 (95% probability; Figure 1;Model 1: Boundary End Nuvuk Cemetery) in Model 1 and cal AD 1465–1585 (95% probability; Figure 1;Model 2: Boundary End Nuvuk Cemetery) in Model 2. The estimated span of this mortuary activity is 80–440 years (95% probability; Figure 3;Model 1: Span of Nuvuk Cemetery) in Model 1 and 75–375 years (95% probability; Figure 3;Model 2: Span of Nuvuk Cemetery) in Model 2.
DISCUSSION AND CONCLUSION
This result of this study is three-fold. First, we have used 26 new 14C dates to explore the variation of how the local ΔR value in the Point Barrow region has changed throughout the Thule period (AD 1000–1750) (Table 2), and second, we have modeled dated human skeletons from the Nuvuk cemetery by applying our best ΔR estimate for the Thule period to a Bayesian chronological model to estimate the timing of mortuary activity (Figures 1–4). Third, we have derived end members using local, chronologically relevant samples in a best-fit approach towards estimating the percentage of terrestrial protein consumed in the dated human skeletons and have used these estimates within our chronological modeling.
The results suggest that the local marine reservoir offset varied by approximately 400–500 years throughout the second millennium AD (Table 2). Tentatively, the simplest explanation for these ΔR fluctuations is changes in the annual thawing patterns of Arctic Ocean sea ice. Another source of variability is the fluctuation in the annual discharge of riverine terrigenous carbon into the Beaufort Sea during the spring freshwater runoff (Coltrain et al. Reference Coltrain, Tackney and O’Rourke2016). We suggest using our weighted-mean value (450 ± 84 yr) as a best-fit local correction for the 14C dating of Thule period (AD 1000–1750) human populations in the Point Barrow area instead of the context-specific ΔR values shown in Table 2, because the sample of individual Thule period ΔR values for Point Barrow (Table 2) is too low to discern a clear temporal relationship (following Russell et al. Reference Russell, Cook, Ascough and Scott2015:40). Our weighted-mean ΔR value (450 ± 84 yr) is less than the weighted-mean ΔR value (506 ± 69 yr) for Point Barrow in the early 20th century put forth by McNeely et al. (Reference McNeely, Dyke and Southon2006), and it may be that global warming from industrialization led to increased melting of Arctic sea ice and the release of old carbon into the early 20th century Arctic oceansphere. However, it is also possible that the early 20th century bivalves collected from Point Barrow dated by McNeely et al. (Reference McNeely, Dyke and Southon2006) may have been frozen in place, leading to an overestimate in their ΔR correction.
Thule archaeological studies have yet to adopt the highly innovative new methodologies used by recent North Atlantic archaeological projects for interpreting isotopic data and 14C measurements in Bayesian frameworks to finely trace cultural changes through time (e.g. Cook et al. Reference Cook, Ascough, Bonsall, Hamilton, Russell, Sayle, Scott and Bownes2015; Hamilton and Sayle Reference Hamilton and Sayle2019). The combination of stable isotope analysis and chronological modeling in future research should allow for further generational-level insight into cultural and societal changes during the Birnirk to Thule transition. Further, isotopic considerations (e.g. δ34S) and Bayesian mixed modeling methods (Fernandes et al. Reference Fernandes, Millard, Brabec, Nadeau and Grootes2014) should allow for more accurate estimates of the proportion of terrestrial, marine, and freshwater protein in each 14C dated individual; which, could ultimately allow for even more accurate 14C calibrations and Bayesian modeling.
In this case, the application of our ΔR estimates in conjunction with Bayesian chronological modeling has led to an important new finding regarding the timing of the Nuvuk cemetery. Of the two Bayesian chronological models (Figure 4), Model 2 is preferred for interpretation because it utilizes a more accurate reflection of the stable isotope ratios of the human skeletons through using δ13C end members from fauna that are both geographically and temporally local (Table 1). At 95% probability, the results of Model 2 show that the mortuary activity in the Nuvuk cemetery related to the directly dated human skeletons began in the early or middle portions of the Thule period and continued for 75–375 years. Although, it is entirely possible that even earlier burials were present but destroyed from coastal erosion (MacCarthy Reference MacCarthy1953; Jensen Reference Jensen2009a) and it is feasible that activity at the cemetery began during the Birnirk period (AD 500–1000). In the mid-AD 1900s Wilburt Carter excavated human skeletons at Point Barrow from northern mortuary contexts that had eroded before modern excavations began in the 1990s (Jensen Reference Jensen2009a: 25). Even earlier, Captain Rochfort Maguire in HMS Plover spent the winters of 1852 and 1853 in the Elson Lagoon, where he learned from the Iñupiat Eskimos that the ground of Point Barrow had been eroding for generations (Maguire Reference Maguire1988). Maguire noted that people told him that they had been forced to move the village to the location where he encountered them due to erosion at the old site, which they indicated was now underwater. Additionally, two Sicco harpoon heads carved from antler (Rangifer tarandus) were recovered from one of the northernmost graves (Nuvuk-01) excavated at Nuvuk (Jensen Reference Jensen2007). Sicco harpoon heads are considered to be Early Thule index fossils (Jensen Reference Jensen2009a: 131) and a date from one of these harpoon heads (Beta-180329) has a conventional 14C age of 1110 ± 40 BP (Jensen Reference Jensen2009a: Table 5), calibrating to cal AD 770–1020 (95% confidence). Likewise, while the modeling estimates that mortuary activity related to the directly dated skeletons ceased by cal AD 1465–1585 (95% probability; Figure 1;Model 2: Boundary End Nuvuk Cemetery), it is quite possible that mortuary activity at the Nuvuk cemetery continued until the AD 1900s, as surface indications of burials continue along the Nuvuk ridge up to grave markers from the 1920s (Jensen Reference Jensen2009a: 208).
Posterior probability densities derived from Models 1–2 for the starting and ending boundaries for the mortuary activity related to the directly dated human skeletons at the Nuvuk cemetery.

There is a great (and so far unexploited) potential to provide a robust and much more accurate chronology for early human colonization and settlement in the Point Barrow region through further applications of Bayesian statistical modeling of 14C measurements corrected with best-fit ΔR values and paleodietary estimates. Moreover, around a dozen archaeological sites in the region contain ample numbers of archaeological contexts with in situ faunal remains ideal for archaeological 14C sampling (Ford Reference Ford1959; Stanford Reference Stanford1976; Hall and Fullerton Reference Hall and Fullerton1990; Sheehan Reference Sheehan1997; Jensen Reference Jensen2009a, Reference Jensen2009b). Ultimately, the Point Barrow chronology will further improve through the continuation of this type of research in the future to address questions about the timing, tempo, and duration of human activity that are of interest to the greater scientific and Native American community.
SUPPLEMENTARY MATERIAL
To view supplementary material for this article, please visit https://doi.org/10.1017/RDC.2019.20
ACKNOWLEDGMENTS
Our deep thanks to the Native Village of Barrow Iñupiat Traditional Government, the Ukpeaġvik Iñupiat Corporation, and the Barrow Senior Advisory Council. We would like to further thank Glenn Sheehan, colleagues, and students for excavation of Nuvuk and the other sites sampled for 14C dating. Portions of this research have been funded by the National Science Foundation (Award # OPP-0726253, OPP-1263848, OPP-1355975) and the Carnegie Trust for the Universities of Scotland.