I. INTRODUCTION
Super-austenitic stainless steel (SASS) used mainly for seawater cooled heat exchanger tubing, surface condenser, chemical processing equipment, etc. has exhibited excellent resistance to localized and stress corrosion as well as good mechanical properties. Reference Kim, Kim, Lee, Park, Shin and Kim1,Reference Mori and Bauernfeind2 Among the properties, its excellent resistance to localized corrosion is based on high concentrations of Cr (19–25 wt%), Mo (4–7 wt%), and N (0.18–0.6 wt%) in the steel. In particular, the Korean patented SR50A, corresponding to UNS S32050 classified as the SASS has a very high pitting resistance equivalent number (PREN = % Cr + 3.3% Mo + 30% N) of around 50. Reference Kim, Kim, Lee, Park, Shin and Kim1 Electrochemical corrosion experiments have demonstrated that SASS shows a significant increase in pitting potential (E P) and critical pitting temperature (CPT). Reference Mori and Bauernfeind2 For these reasons, SASS has been considered as one of the most cost-effective alternatives for titanium. However, its excellent resistance to the localized corrosion can be degraded significantly when the steel is subjected to autogenous gas tungsten arc welding (GTAW) at high heat input. Reference Kim, Kim, Lee, Park, Shin and Kim1 In general, welding of austenitic stainless steels results frequently in a weld metal (WM) with a dendritic and inhomogeneous microstructure, and significant microsegregation of major alloying elements such as Cr and Mo at the phase interfaces. Reference Kim, Kim, Lee, Park, Shin and Kim1,Reference Dupont3–Reference Banovic, Dupoint and Marder5 Moreover, a variety of intermetallic phases such as σ-phase, χ-phase, and Cr2N can also be precipitated in the WM. Reference Nam, Park, Na and Kang6–Reference Jang, Kim, Lee and Park8 Among the phases, σ-phase enriched by Cr and Mo has been the major intermetallic phase and it causes Cr and Mo depletion area around the phase. This results essentially in deterioration of both localized corrosion resistance and mechanical properties. Reference Jang, Kim, Lee and Park8–Reference Wilms, Gadgil, Krougmen and Ijsseling10
Recently, Kim et al. Reference Kim, Kim, Lee, Park, Shin and Kim1 has demonstrated from the crevice corrosion test that the alloying elements of Cr and Mo are enriched at the interdendritic region in SASS, leading to the depletion area at the dendrite core, and therefore the localized corrosion is selectively initiated at the dendrite core with smaller PREN value. However, the present authors have observed a different type of localized corrosion not in dendrite core, but in interdendritic region of SASS weld. Therefore, this study tries to clearly understand the exact mechanism of the localized corrosion of SASS weld under immersion in acid chloride environment by means of both electrochemical polarization measurement and transmission electron microscopy (TEM) analysis. With simple immersion test in reference to ASTM G48, 11 however, it is extremely difficult to clarify the corrosion mechanism of SASS weld since the damage by the localized corrosion is so severe that exact corrosion initiation site cannot be clearly identified. Even today, an efficient technique for identification of corrosion initiation site in SASS weld is still scarce and therefore the present authors have tried to clearly observe the corrosion initiation site in the WM employing an electrochemical polarization measurement.
II. EXPERIMENTAL DETAILS
A. Specimen preparations
The tested specimens are equivalent to UNS S32050 classified as SASS containing 23–25 wt% Cr–6∼7 wt% Mo–20–22 wt% Ni. The alloys were cold-rolled to 0.79 mm in thickness.
To simulate the GTAW without fillers, bead-on-plate welding was carried out on the specimens using tungsten inert gas (TIG) welding process with a constant heat input of 0.375 kJ/cm, and a shielding gas composed of Ar + 5% N2, and a pure Ar for the front and back bead, respectively. Welding current, voltage, and travel speed were 125 A, 10 V, and 200 cm/min, respectively.
B. Electrochemical corrosion tests and identification of corrosion initiation site
Firstly, to identify the corrosion initiation site in weld, an electrochemical polarization test was conducted. Prior to the immersion test, the specimen was ground to 2000 grit paper and polished with 0.25 μm diamond suspension. Before the polarization measurement, the polished specimen was initially immersed in 1 M NaCl + 0.5 M HCl solution at 70 °C for 10 min. This electrolyte was selected in reference to the previous study on localized corrosion of SASS. Reference Kim, Kim, Lee, Park, Shin and Kim1 The pre-exposure process performed prior to the polarization measurement has two advantages; one is that the process can lead easily to local breakdown of the passive film on the steel in the solution and the other is that the dendrite structure containing fine intermetallic phases can be somewhat etched since the structure is inferior to the base metal, making it possible to identify clearly the corrosion initiation site through the subsequent observation by field emission-scanning electron microscopy (FE-SEM). After the pre-exposure process, the potential was applied on the specimen from an initial potential of −0.65 VSCE toward more active potentials at a scan rate of 0.1 mV/s. The test solution used for the polarization test was not the one used in the pre-exposure test, but a fresh solution. When the current density reached 200 μA/cm, Reference Mori and Bauernfeind2 the measurement was stopped. Right at the moment the potential was stopped, the specimen was rinsed with distilled water and quickly disassembled from the specimen holder in just a few seconds and the specimen surface was then cleaned ultrasonically by ethanol. This procedure ensures that any corrosion products acting as a hindrance for clear observation of the microstructure were not precipitated on the surface. Making a clear distinction between the austenite matrix and 2nd phase particles, and identification of corrosion initiation site in the dendrite structure were supported by back-scattered electron (BSE) mode in FE-SEM. The cross-section of the corroded site was also observed by employing focused ion beam (FIB) and TEM. In particular, the distribution of Cr and Mo around 2nd phase particle was analyzed by the energy dispersive spectroscopy (EDS) line profile attached in TEM.
Secondly, to evaluate the localized corrosion resistance of the steel weld in highly concentrated chloride environment, a potentiodynamic polarization test was carried out. The test was conducted in deaerated 1 M NaCl + 0.5 M HCl solution at 70 °C. The disk type test specimen with an exposed area of 1 cm2 contains WM, heat affected zone, and base metal. WM with the bead width of 3 mm is located in the center of the specimen. Prior to each experiment, the specimens were polished mechanically up to 1200 grit and rinsed with distilled water and dried in air. Potential was applied and scanned potentiodynamically at a scan rate of 1 mV/s from an initial potential of −0.65 VSCE to the anodic potential at which the current density reached 5 mA/cm. Reference Mori and Bauernfeind2 Right after the polarization test, the sample surface was observed and checked whether the sample suffered from the crevice corrosion at the rubber in specimen holder. The CPT measurement was additionally conducted in 1 M NaCl solution based on ASTM G150. 12 To determine the CPT, an anodic potential of 750 mVSCE was applied and the solution temperature was then ramped at 1 °C/min. The CPT was determined when the current density reached 100 μA/cm2 and remained above this level for a minimum of 1 min.
III. RESULTS AND DISCUSSION
A. Observation of microstructure & identification of corrosion initiation site in weld
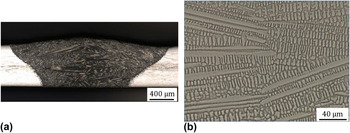
Figures 1(a) and 1(b) show the cross-sectional macro view of WM after the TIG welding and surface morphology of center region in weld, respectively. As expected, there is no discernable defect and typical dendrite structure is formed in weldment. According to the modified Schaeffler diagram Reference Espy13 indicating the relationship between Cr and Ni equivalent ratio (Creq/Nieq), and phase stability, the solidification mode of the alloy system used in this study can be considered as A mode. This solidification mode can be simply described as follows:
 $${\rm{L}} \to {\rm{L}} + \gamma \to \gamma \quad ,$$
where L and γ refer the phase of liquid and austenite, respectively.
(a) Cross-sectional macro view of WM, and (b) surface morphology of center region in weld, observed by optical microscope.

Previous literature studies Reference Garner14,Reference Brooks, Williams and Thompson15 have also indicated that high performance austenitic stainless steels such as SASS solidify primarily as a γ phase. Upon cooling below the solidus line, ferrite stabilizing elements of Cr and Mo are enriched in the melt remained between the primarily solidified γ dendrite, and the melt can eventually be solidified as pure α phase or mixture of α and γ phase. Upon further cooling, the interdendritic ferrite can be decomposed into the intermetallic phases enriched by Cr and Mo. Considering these facts, it is believed that the microstructure of the weld formed under this alloy system is composed of the dendrite cores and interdendritic region containing some intermetallic phases.
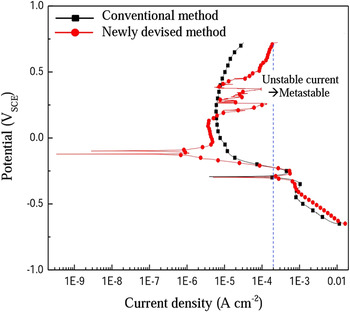
Figure 2 presents electrochemical data obtained from the conventional potentiodynamic polarization method, and newly applied method involving pre-exposure in the solution at open circuit potential and subsequent polarization measurement with much slower scan rate. Contrary to the case of the conventional method, the polarization data obtained by the newly applied method exhibits metastable pitting behavior in the form of current spike at the passivation potential region from 0.2 VSCE to 0.3 VSCE during the anodic scan. This suggests that the local breakdown of passive film during the anodic scan can be more facilitated by the pre-exposure process and slower scanning rate in polarization measurement, resulting in unstable current density. Slower scan rate in the polarization test could make the passive film formed on the specimen anodically polarized at high level of potential for longer time, and therefore local breakdown of passive film could be more facilitated. In our preliminary test, the metastable pitting appearing as a form of current spike has been rarely observed with faster scan rate in the polarization test. As for the metastable pit, it is typically considered to be those of micron size at most, and they can form at potentials below the pitting potential. Since most metastable pits grow for a limited time but are repassivated and stop growing, they are expressed as a form of current spike in the polarization curve. Reference Park, Rao and Kwon9,Reference Moayed and Newman17,Reference Frankel18
Comparison of polarization curves obtained by conventional method and newly devised method. Reference Kim and Hong16

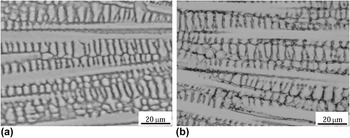
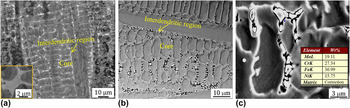
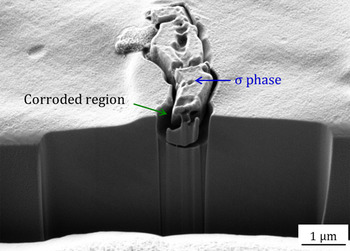
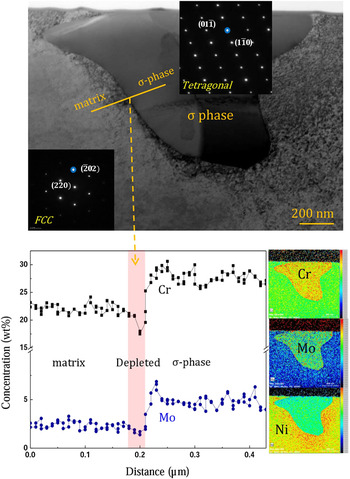
In addition, as there is increase in anodic potential above around 0.3 VSCE, the increase rate of current density is much higher for the specimen applied to the newly applied method. Based on the method, surface morphology of the specimen was firstly observed by an optical microscope, and this can be found in Figs. 3(a) and 3(b). It indicates that it is extremely difficult to identify the corrosion initiation site in dendrite structure by the conventional method, while the utilization of newly devised method makes it much easier to observe the corrosion site in dendrite structure. It appears from Fig. 3(b) that the corrosion is initiated along the interdendritic region in weld. For a clearer observation, the surface was analyzed employing the BSE mode in FE-SEM, which is identified in Fig. 4. In the BSE mode, since the difference in atomic weight between the steel matrix and 2nd phase particles is expressed as the difference in contrast between them, they are easily distinguished. Figure 4 clearly indicates that the localized corrosion is initiated around the 2nd phase particles identified as white color in the interdendritic region. From the EDS analysis, the 2nd phase particles are enriched by Cr and Mo. To clarify the nature of the particle and the corrosion mechanism, the cross-sectional morphology of the particle was additionally analyzed utilizing FIB and TEM, and this can be found in Figs. 5 and 6. From the analyses, it is evident that the particle is typical σ-phase with tetragonal structure, Reference Jang, Moon, Lim, Kim, Kim, Lee, Park and Koh19,Reference Glover20 and the localized corrosion is mainly attributed to the difference in composition of Cr and Mo between the matrix and σ-phase. This can be surely supported by EDS line profile from TEM, and this can be found in Fig. 6. The narrow depleted region of around 30–40 nm makes the steel weld susceptible to the localized corrosion. The fact that the depleted region is so narrow could be attributed to much lower diffusion coefficient of Cr and Mo in face-centered cubic (FCC) structure, i.e., the diffusivity of Cr in FCC structure is almost 10 times lower than that in body-centered cubic (BCC) structure. Reference John Sedriks21 One considering fact from Fig. 6 is that it seems that the depletion of Mo around σ-phase is negligible compared to that of Cr. This could be attributed to the following reasons. The content of Mo in this alloy is only around 6.5 wt% which is far less than that of Cr (over 23 wt%), and the depletion area is fairly narrow of around 30–40 nm. Under this situation, there are limitations for the depletion phenomenon to be accurately analyzed by the EDS line profile in TEM. Utilization of more advanced technique with higher resolution such as three-dimensional atom probe would be required for clearer analysis.
(a) and (b) Optical microscope showing surface morphology of specimens obtained by conventional method and newly devised method, respectively. Reference Kim and Hong16

FE-SEM photographs exhibiting surface morphology of specimen (a) before and (b) after the corrosion evaluation by newly devised method, and (c) magnified view of (b) and its EDS analysis.

Cross-sectional observation of 2nd phase particle utilizing FIB technique. Reference Kim and Hong16

TEM observation of 2nd phase particle, and line profile of Cr and Mo around the particle. Reference Kim and Hong16

B. Effect of heat treatment on fraction of σ-phase and consequent corrosion resistance
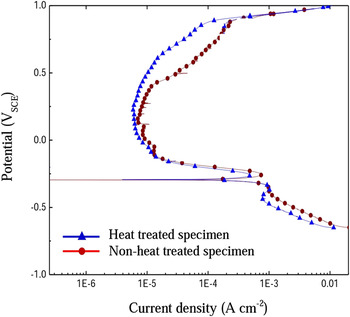
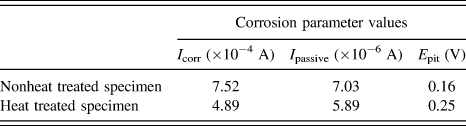
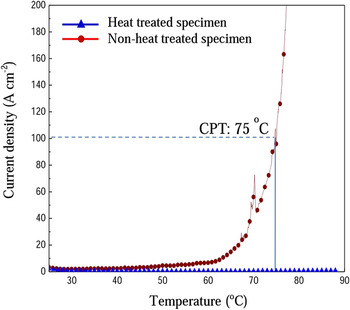
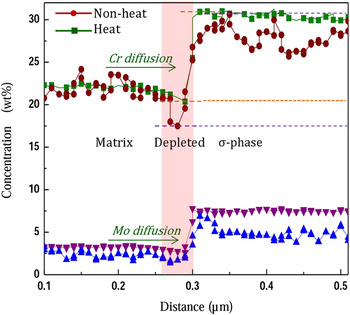
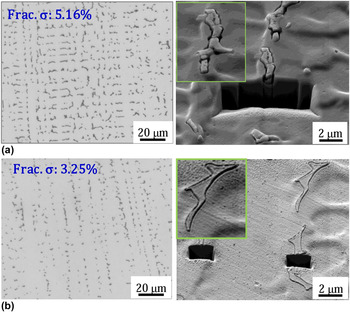
To gain further insight into the detrimental effect of σ-phase on such localized corrosion, the fraction of σ-phase was controlled by additional heat treatment of 1180 °C for 30 s. From Fig. 7, the heat treated specimen containing smaller fraction of σ-phase in the microstructure exhibits lower current density than nonheat treated specimen, suggesting that heat treated specimen has higher resistance to the localized corrosion. For a clearer understanding, several corrosion parameters are listed in Table I. The critical current density and the minimum passivation current density of the heat treated specimen are lower than those of nonheat treated specimen. In addition, the potential at which the current density starts to increase from the passivation current density is higher for the heat treated specimen. Although there have been a number of previous literature studies considering the influence of σ-phase on the degradation of mechanical properties, Reference Wang, Han, Wu, Yang and Wang22–Reference Paulraj and Garg24 this subject lies beyond the scope of our investigation. The relationship between the fraction of σ-phase and corrosion resistance can be additionally demonstrated in Fig. 8, which depicts current density versus temperature for the specimens during the CPT measurement. The CPT value of nonheat treated specimen is determined at around 75 °C while there is no discernable increase in current density of heat treated specimen even at 90 °C. High level of CPT in heat treated specimen is due mainly to high concentration of Cr, Mo, Ni and N in SASS, and partial dissolution of σ-phase by the additional heat treatment. It is generally known that the local breakdown of a passive film followed by the occurrence of metastable pit and growth into a stable pit leads to abrupt increase in current density. Reference Moayed and Newman17,Reference Frankel18 However, it is interesting to see the fact that the current density increases moderately during the anodic polarization scan. This moderate increase in the current density suggests that this type of localized corrosion is more like selective corrosion than typical pitting corrosion. Reference Deng, Wang, Jiang, Wang, Gao and Li25 As for the difference in polarization behavior between heat treated and nonheat treated specimen, two kinds of mechanism could be involved in the heat treatment; one is the local dissolution of σ-phase by the heat treatment, and the other is the replenishment of Cr and Mo at the depleted region around the σ-phase by the diffusion of the alloy elements. The significant reduction of σ-phase in weld after the heat treatment and the supplement of Cr and Mo at the depleted area, identified in Figs. 9 and 10, could be supporting evidence of the mechanism. It indicates that the heat treatment is effective to dissolve partially σ-phase in the microstructure, and contribute to the supplement of Cr and Mo to the depleted region by the diffusion of the elements from the matrix. However, since the diffusion length can be generally described by Eq. (2), the replenishment of Cr and Mo at the depleted region could be limited due to short diffusion length of the alloy elements by the lower diffusion coefficient of the elements in FCC structure and too short annealing time of 30 s.
 $$x = C\sqrt {Dt} \quad ,$$
where x denotes diffusion length, C is constant value slightly varied depending on the diffusion system, D is the diffusion coefficient of solute atom and t specifies the diffusion time.
Comparison of potentiodynamic polarization curves of heat treated and nonheat treated specimens. Reference Kim and Hong16

Several corrosion parameters of heat treated and nonheat treated specimen, obtained after potentiodynamic polarization test in 1 M NaCl + 0.5 M HCl solution at 70 °C (I crit: critical current density, I passive: minimum passive current density, E pit: critical potential at which passive current starts to increase).

CPT test for heat treated and nonheat treated specimens.

Comparison of line profile of Cr and Mo for heat treated and nonheat treated specimen.

Comparison of σ-phase and surface morphology after potentiodynamic polarization measurement for nonheat treated and heat treated specimen, respectively.

Nevertheless, the extent of localized corrosion around σ-phase can be less severe in heat treated specimen compared to the case of nonheat treated specimen, as identified at the right side of Figs. 10(a) and 10(b).
IV. CONCLUSION
The present authors have tried to clearly understand the corrosion mechanism of SASS weld by identifying the corrosion initiation site employing the potentiodynamic polarization measurement. Pre-exposure process and slow scan rate during the polarization measurement make it possible to clearly identify the corrosion initiation site in weld. Based on the method, it is clearly demonstrated that the corrosion is preferentially initiated around σ-phase precipitated in the interdendritic region in weld. The formation of σ-phase leads essentially to local depletion area of Cr and Mo around the phase, and consequently, the welded zone of the steel is still susceptible to the interdendritic corrosion despite its high concentration of 23–25 wt% Cr and 6–7 wt% Mo. The local depletion of Cr and Mo around σ-phase can be replenished by the diffusion of the elements into the depletion area during the subsequent heat treatment at 1180 °C for 30 s.
ACKNOWLEDGMENTS
This work was supported by Sunchon National University and Pohang Iron and Steel Co. Ltd (POSCO) in Korea.