I. INTRODUCTION
Alloying is commonly used to control structural and optoelectronic properties (e.g., bandgap, lattice constant) of compound semiconductors for specific device applications. The most common semiconductor alloys are pseudobinary alloys composed of isoelectronic elements that are relatively well matched in terms of atom size, ionicity, and electronegativity, e.g., SiGe, AlGaAs, GaAsP, etc. In these cases, the alloy properties can be approximated by the extrapolation of the properties of their corresponding binary end compounds (Vegard’s law). However, in the last decade, a new class of semiconductor alloys known as highly mismatched alloys (HMAs), formed by the isoelectronic substitution of elements with very different size and/or electronegativity in the anion sublattice, have attracted interest. In contrast to common semiconductor alloys, HMAs have very different electronic structures from their corresponding constituent compounds and therefore have properties that deviate significantly from virtual crystal approximation predictions but are well described by the band anticrossing (BAC) model.Reference Walukiewicz, Shan, Yu, Ager, Haller, Miotkowski, Seong, Alawadhi and Ramdas1 HMAs are generally difficult to synthesize due to large spinodal decomposition regions across the composition range and hence only dilute HMAs (e.g., As-rich or N-rich GaNAs HMAs) have been synthesized and well characterized. Unique and interesting optoelectronic properties have been demonstrated in these dilute HMAs.Reference Walukiewicz, Shan, Yu, Ager, Haller, Miotkowski, Seong, Alawadhi and Ramdas1, Reference Shan, Walukiewicz, Ager, Haller, Geisz, Friedman, Olson and Kurtz2
Dilute GaN1−xAsx (both As-rich and N-rich) and more recently As-rich GaAs1−xBix HMAs are well studied and it has been shown that the electronic bands are strongly restructured due to the substitution of the host anion with a mismatched isovalent element.Reference Alberi, Dubon, Walukiewicz, Yu, Bertulis and Krotkus3–Reference Huang, Oe, Feng and Yoshimoto9 However, growth of HMAs with high concentrations of the mismatched element without phase separation is still a challenging task. Recently, the growth of GaN1−xAsx alloys over the entire composition range has been demonstrated using low-temperature molecular beam epitaxy (LT-MBE).Reference Novikov, Staddon, Foxon, Yu, Broesler, Hawkridge, Liliental-Weber, Walukiewicz, Denlinger and Demchenko10, Reference Yu, Novikov, Broesler, Demchenko, Denlinger, Liliental-Weber, Luckert, Martin, Walukiewicz and Foxon11 It was found that the As content in GaN1−xAsx HMAs increases with decreasing growth temperature. For growth on glass substrates, the alloys are amorphous in the composition range of 0.10 < x < 0.75 and crystalline outside this range. The GaN1−xAsx amorphous films have a smooth morphology, homogeneous composition, and sharp, well-defined optical absorption edges. The bandgap energy varies in a broad energy range from ∼3.4 eV in GaN to ∼0.8 eV at x ∼0.85 and was found to be in agreement with the predictions of the BAC model.Reference Yu, Novikov, Broesler, Liliental-Weber, Levander, Kao, Dubon, Wu, Walukiewicz and Foxon12
In previous work on GaN epitaxial growth, bismuth has been used as a surfactant to improve surface morphology.Reference Foxon, Novikov, Li, Campion, Winser and Harrison13 The difference in electronegativity and atomic radii between N (3.0 eV; 75 pm) and Bi (1.8 eV; 155 pm) of 66 and 106%, respectively, is the largest among all group V elements, thus making a III–V alloy of GaNBi even more difficult to synthesize than GaNAs.Reference Gordy and Orville Thomas14 Because of the high electronegativity of nitrogen, the valence band (VB) of GaN is at a low energy with respect to vacuum. This causes difficulty for the p-type doping of nitride semiconductors.Reference Morkoç, Strite, Gao, Lin, Sverdlov and Burns15 It has been found recently that Bi introduces four primary and two spin-orbit split-off p-like defect levels located at approximately 0.4 and 2.6 eV below the valence band maximum (VBM) of GaAs, respectively.Reference Trumbore, Gershenzon and Thomas16 Although defect levels of Bi in GaN have not been determined, with the known band offset of GaN and GaP, the Bi energy level in GaP, and using the transitivity rule for the localized levels location with respect to semiconductor bands, the bismuth energy level is predicted to be near midgap in GaN.Reference Trumbore, Gershenzon and Thomas16, Reference Vurgaftman and Meyer17 When the bismuth concentration in GaN increases, VB anticrossing of the Bi levels and the VB of GaN will result in the formation of the new Bi-derived VB located in the midgap of the GaN matrix. This large upward shift of the valence band edge (VBE) is expected to make the alloy easier to dope p-type.
In our previous work,Reference Levander, Yu, Novikov, Tseng, Foxon, Dubon, Wu and Walukiewicz18 we reported the growth of GaNBi alloys by LT-MBE. Specifically, we found that by lowering the growth temperature the bismuth content in the alloy increases. The GaNBi films have some residual crystalline GaN, but exhibited a strong absorption shift, indicative of a chemical interaction between Bi and GaN. Although we expect the resulting GaNBi phase to be amorphous, amorphous GaN has been theoretically predicted to be a technologically useful electronic material due to the lack of deep gap states common in amorphous III–V semiconductors caused by metallic bonds.Reference Stumm and Drabold19 The amorphous nitride-based ternary alloys could also have technical potential. In this article, we discuss a systematic study on the growth of a homogeneous GaNBi phase as well as on the structural, optical, and electrical properties of GaNBi alloys.
II. METHODS
The GaNBi films were grown on 2-inch c-plane sapphire substrates using plasma-assisted molecular beam epitaxy in a MOD-GENII system. The growth temperature was ∼80–90 °C. The nitrogen (N2) beam equivalent pressure (BEP) was kept constant at ∼1.7 × 10⁻⁵ Torr with active nitrogen provided by a radio frequency plasma source. The Ga BEP was varied between 1.7 × 10⁻⁷ and 3.1 × 10⁻⁷ Torr and modified the III:V ratio. The Bi BEP was used to control the Bi content of the film and varied from 0 to 1.5 × 10⁻⁷ Torr for the highest Bi-content sample. Samples discussed were grown over a year and exhibit clear monotonic trends.
The composition, depth uniformity, and thickness of these films were characterized using Rutherford backscattering spectrometry (RBS) using a 3.04 MeV He2+ beam to detect oxygen contamination via the 16O(α,α)16O resonance reaction. The detectable limit of oxygen by this method is ∼1 at.%. Atomic percentages of bismuth are used in this article due to the ambiguity of the bonding environment of the Bi atoms (e.g., possible Bi clusters), especially at high Bi concentrations. As a first test of the chemical interaction between Bi and GaN, the optical absorption of the films was investigated using a Perkin-Elmer Lambda 950 UV/Vis/NIR Spectrophotometer (Waltham, MA).
The structure of the low-temperature grown films was examined by x-ray diffraction (XRD) using a Siemens D5000 powder x-ray diffractometer (Munich, Germany). The microstructure of the GaNBi films was investigated using cross-sectional transmission electron microscopy (TEM), selected area diffraction (SAD), and high-resolution transmission electron microscopy imaging (HRTEM). For low-magnification imaging and diffraction, a JEOL 3010 (Tokyo, Japan) with 300 keV accelerating voltage and resolution of 2.4 Å was used. For HRTEM, a JEOL CM300 with 300 keV accelerating voltage was used.
The direct current conductivity was measured using the four-point Van der Pauw method and pressed indium contacts made after a brief HCl dip to remove any surface oxide layer. The contacts were determined to be ohmic from the linear relationship between current and voltage. The temperature dependence of the conductivity was investigated using a liquid helium cryostat. Thermopower (Seebeck coefficient) measurements were used to determine the majority carrier type instead of the Hall effect since it is the preferred method for characterizing carrier type in disordered systems.Reference Mott and Davis20 The thermopower was measured using a home-built setup with pressed indium contacts and a temperature gradient of 2 °C produced by local heaters while the sample was inside a liquid nitrogen cryostat. Further details of the thermopower setup are described in Ref. Reference Ager, Miller, Jones, Yu, Wu, Schaff and Walukiewicz21.
The nitrogen partial density of states (DOS) of the VB and conduction band (CB) can be determined using soft x-ray emission (SXE) spectroscopy and x-ray absorption spectroscopy (XAS). In addition, overlapping and aligning the spectra with respect to core energy levels allow for the direct measurement of the absolute positions of the VB and CB edges. To investigate the effect of bismuth incorporation on the DOS of GaNBi, the nitrogen K-edge (near 400 eV) was examined at the Advanced Light Source on beamline 8.0.1. The SXE was measured using a Tennessee/Tulane grating spectrometer with an energy resolution of ∼0.6 eV; the XAS was measured in total fluorescence yield detection mode with an energy resolution of ∼0.2 eV.
III. RESULTS AND DISCUSSION
A. Optimization of growth conditions
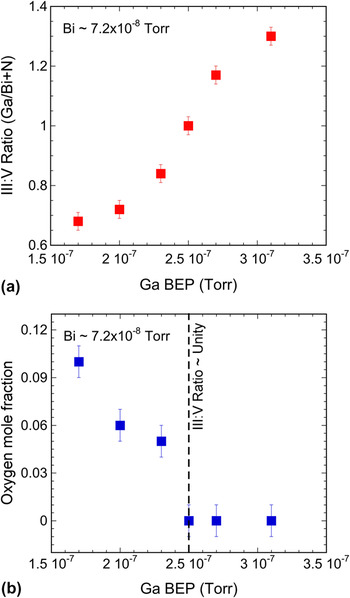
In our previous work, we examined the effect of decreasing the growth temperature on the structural and optical properties of GaNBi.Reference Levander, Yu, Novikov, Tseng, Foxon, Dubon, Wu and Walukiewicz18 As the growth temperature was decreased from 600 to 100 °C, there was a monotonic increase in the Bi content and shift of the optical absorption to lower energy. Crystalline GaN remained visible in the XRD although the peak intensity decreased with decreasing temperature. TEM studies revealed a microstructure changing from columnar growth to small grains of GaN embedded in amorphous material as the temperature decreased. In this work, we continue the optimization process and attempt to form a homogeneous alloy phase by growing at a low temperature of 80–90 °C and varying the Ga and Bi BEP. Modifying the Ga BEP had a dramatic effect on the III:V ratio of the alloy, oxygen content, and optical absorption. In this context, the III:V ratio is defined as the atomic concentration of Ga divided by the sum of the atomic concentrations of Bi and N. Figure 1(a) shows how the III:V ratio in GaNBi layer measured by RBS increases with increasing Ga BEP for a given Bi BEP of 7.2 × 10⁻⁸ Torr, corresponding to ∼6.5 at.% Bi (or ∼13 mol% GaBi) incorporated in the film. It is shown that a stoichiometric III:V ratio of unity within ±3% can be obtained for a narrow range of Ga BEP. The change in oxygen content in the bulk of the film is shown in Fig. 1(b). The oxygen content increases with decreasing Ga BEP due to the columnar growth, despite the relative cleanliness of the MBE growth chamber remaining constant. When a RBS-determined III:V ratio of unity or higher is reached, oxygen incorporation is suppressed.
(a) III:V ratio in GaNBi layers defined as the atomic concentration of Ga divided by the sum of the atomic concentration of Bi and N measured by Rutherford backscattering spectrometry (RBS), as a function of Ga beam equivalent pressure (BEP) during growth. (b) The oxygen content in the bulk of the film as determined by resonance RBS. Note that oxygen incorporation is suppressed when RBS-determined III:V is ∼1.

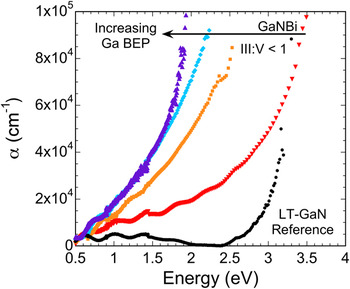
The shift in optical absorption is a primary indicator of the chemical interaction between bismuth and GaN and thus the formation of a GaNBi alloy. Figure 2 shows the optical absorption spectra for a GaN reference sample grown at low temperature and a series of samples grown with similar Bi BEP but varying Ga BEP and, therefore, III:V ratio. Despite the films having very similar Bi concentrations of ∼6.5 at.% Bi, as determined from RBS, the optical absorption spectra are dramatically different. We found that the maximum shift in the absorption edge occurs when a III:V ratio in the film of unity is achieved. This suggests that when the RBS-determined III:V ratio is <1, a homogeneous GaNBi alloy is not formed. For the growth of crystalline dilute GaAs1−xBix, N-rich conditions reduce the concentration of substitutional Bi.Reference Oe and Okamoto22–Reference Henini, Ibáñez, Schmidbauer, Shafi, Novikov, Turyanska, Molina, Sales, Chisholm and Misiewicz24 It is possible that this principle extends to the GaNBi alloys for which N-rich conditions lead to less incorporation of Bi into an alloy phase and therefore less optical absorption shift.
Optical absorption spectra as a function of Ga BEP for a series of samples grown under similar Bi BEP and growth temperature. The circles represent the absorption spectra for a low-temperature molecular beam epitaxy (LT-MBE)-grown GaN film. As the Ga BEP increases, the incorporation of Bi into GaNBi increases until an RBS-determined III:V ratio of unity is reached for the left most spectra (triangles).

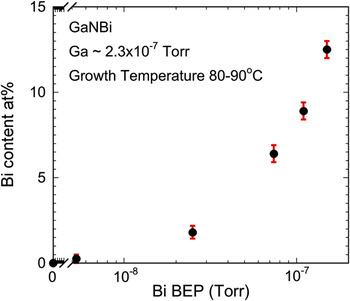
In addition to varying the bismuth content in the GaNBi alloy by varying the growth temperature, alloy composition can also be controlled by changing the Bi BEP during growth (Fig. 3). Up to 12.5 at.% Bi (or 25 mol% of GaBi) was achieved for the highest Bi BEP while maintaining a RBS-determined III:V ratio of approximately unity within ± 3%. Even for the high concentration of ∼12.5 at.% Bi, the composition depth profile was uniform. The films exhibit an absorption shift similar to that reported in Ref. Reference Levander, Yu, Novikov, Tseng, Foxon, Dubon, Wu and Walukiewicz18. In principle, higher Bi contents could be achieved; however, for the current growth temperatures above 12.5 at.% Bi, we have observed Bi surface segregation and the depth uniformity was significantly degraded.
The change in bismuth concentration as a function of Bi BEP. Even at high Bi at.%, the composition profile is uniform indicating minimal segregation of Bi to the surface.

B. Structure of LT-MBE-grown GaNBi films
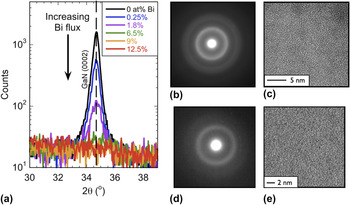
The formation of a homogeneous GaNBi phase is a difficult task due to the high energy of the GaN bond and the mismatch between nitrogen and bismuth. Previous work has shown that reducing the growth temperature results in a reduction of GaN crystallite size.Reference Levander, Yu, Novikov, Tseng, Foxon, Dubon, Wu and Walukiewicz18 In this work, we aimed for a homogeneous phase by starting at a low-growth temperature (80–90 °C) and increased the Bi BEP to change the Bi content. The result of increased Bi BEP is a decreased intensity of the GaN (0002) observed in XRD, as shown in Fig. 4(a). There is no shift of this diffraction peak, so we conclude that no significant amount of Bi is incorporated into crystalline GaN despite the very low-growth temperature. No other diffraction peaks are present. At a Bi BEP of 7.4 × 10⁻⁸ Torr, corresponding to a film composition of 6.5 at.% Bi, the GaN (0002) diffraction peak is no longer detectable in conventional XRD using Kα x-rays generated from a Cu tube source. More sensitive experiments to determine the structure of these alloys were carried out using TEM. The SAD [Fig. 4(b)] shows diffuse rings with positions corresponding to crystalline GaN. The HRTEM [Fig. 4(c)] reveals that there are nanocrystallites <5 nm in diameter present—most likely cubic GaN.Reference Liliental-Weber, dos Reis, Levander, Yu, Walukiewicz, Novikov and Foxon25 Even at higher Bi BEP (1.1 × 10⁻⁷ Torr), there are still nanocrystallites present. Despite the very low-growth temperature, a homogeneous phase of purely amorphous GaNBi could not be formed. Instead, we observe GaN nanocrystallites embedded in an amorphous GaNBi matrix. Due to the low energy absorption observed, we believe that the optical absorption spectra still reflect the optical properties of the amorphous GaNBi matrix phase. For comparison, a SAD and HRTEM image from previous work on amorphous GaN1−xAsx are shown in Figs. 4(d) and 4(e); the broad diffraction rings and salt/pepper contrast indicative of a homogeneous amorphous phase is clear.Reference Novikov, Staddon, Foxon, Yu, Broesler, Hawkridge, Liliental-Weber, Walukiewicz, Denlinger and Demchenko10–Reference Yu, Novikov, Broesler, Liliental-Weber, Levander, Kao, Dubon, Wu, Walukiewicz and Foxon12 It is interesting to note the difficulty of forming homogenous GaNBi films compared to the less-mismatched GaNAs alloy system which is more readily grown. A recent investigation of the structure of the GaNBi thin films using the TEM techniques of Z-contrast and electron energy loss spectroscopy has shown that there are small Bi-rich precipitates for samples with more than 6.5 at.% Bi.Reference Liliental-Weber, dos Reis, Levander, Yu, Walukiewicz, Novikov and Foxon25 However, these precipitates are not connected and there is still Bi in the amorphous matrix phase in lower concentration.
(a) X-ray diffraction patterns for GaNBi samples grown at low temperature, each with a different Bi flux and, therefore, Bi content. No incorporation of Bi into c-GaN was detected. At higher Bi contents, the GaN (0002) peak was not visible. (b) The selected area diffraction (SAD) pattern shows diffuse rings, but (c) high-resolution transmission electron microscope (HRTEM) images revealed crystallites <5 nm in diameter. For comparison, a (d) SAD and (e) HRTEM images of amorphous GaN0.55As0.45 grown on a glass substrate by LT-MBE is shown. Note the salt/pepper contrast of the HRTEM image that is indicative of the amorphous phase.

C. Electronic transport properties
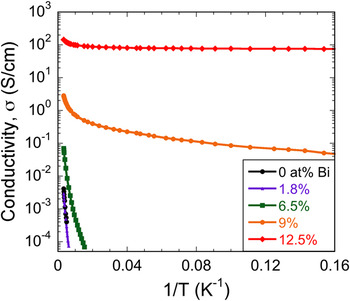
Unlike the undoped amorphous GaNAs alloys that are highly insulating, as-grown undoped GaNBi alloys are conducting. An examination of the electrical transport properties revealed an interesting trend as the Bi content was varied. The conductivity increased from ∼4.0 × 10⁻³ S/cm for pure LT-MBE grown GaN to ∼144 S/cm for GaNBi with 12.5 at.% Bi. The temperature dependence of the conductivity, σ(T), was found to decrease with increasing Bi content as shown in Fig. 5. The σ(T) of the highest Bi content film behaves as a degenerately doped semiconductor with very little thermal activation at low temperatures. This result suggests that the increased conductivity is due to a higher concentration of free charge carriers.
Temperature dependence of the conductivity of GaNBi with varying Bi contents. The room temperature conductivity increases and the conductivity temperature dependence decreases with increasing Bi content.

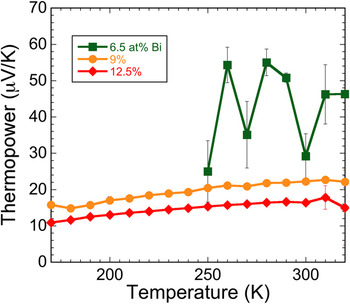
The thermopower as a function of temperature, S(T), was used to determine the majority carrier type, and the results are shown in Fig. 6. The positive value clearly signifies that holes are the majority carriers, and the decreasing magnitude with increasing Bi content suggests an increasing hole concentration. Since bismuth metal has a negative thermopower near −55 μV/K, a connected network of metal clusters cannot be the cause of the conductivity or thermopower.Reference Damodara Das and Soundararajan26 This is also consistent with TEM results, which showed that the Bi-rich clusters are isolated. The magnitude of ∼10–20 μV/K is typical for degenerately doped semiconductors, which agrees with the results of σ(T).
Temperature dependence of the thermopower of GaNBi with varying Bi contents. The positive value indicates that holes are the majority carrier. The data for the sample with 6.5 at.% Bi has more variation due to the higher resistance of the sample.

One lingering question of this work is the cause of high p-type conductivity for the GaNBi films with high Bi contents. This is particularly interesting due to the tendency of GaN to be native n-type due to nitrogen vacancies and/or oxygen impurities.Reference Van de Walle and Neugebauer27 One possible explanation is the movement of the VB to higher energy due to a Bi-derived band at approximately midgap. The higher VBE energy would then affect defect formation energies and perhaps make acceptor defects more prevalent.Reference Walukiewicz28 However, this explanation needs to be quantitatively verified. The following section describes our work to investigate the movement of the band edges, which may play a role in modifying the conductivity.
D. Examination of DOS modification
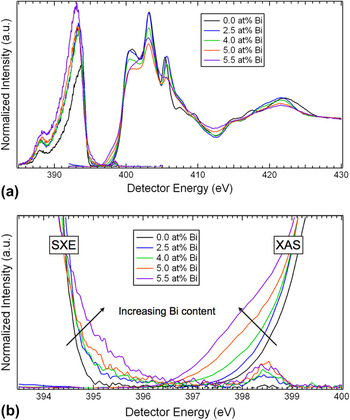
The nitrogen partial DOS of GaNBi films grown at different temperatures, described in Ref. Reference Levander, Yu, Novikov, Tseng, Foxon, Dubon, Wu and Walukiewicz18 as III:V stoichiometric and without oxygen, was examined using SXE spectroscopy and XAS to probe the VB and CB, respectively.Reference Duda, Stagarescu, Downes, Smith, Korakakis, Moustakas, Guo and Nordgren29 Hybridization of 2p nitrogen states with Bi states via Ga atoms would result in a modification of the nitrogen partial DOS and provides further evidence for the formation of a GaNBi-related phase as opposed to chemically separate GaN and Bi phases. The SXE and 45° incident XAS spectra of the nitrogen K-edge are shown in Figs. 7(a) and 7(b). For the XAS spectra, the pre-edge linear background was subtracted and the absorption step edge was normalized to unity at 430 eV. In the SXE spectra, the elastic emission peak near 398.5 eV was used to calibrate the detector energy to the monochromator energy of the XAS spectra, which allows both to be plotted together and the absolute positions of the band edges to be determined.
(a) The nitrogen K-edge soft x-ray emission (SXE) spectroscopy (left side) and total fluorescence yield x-ray absorption spectroscopy (XAS) (right side) of GaNBi films with various Bi contents. The threshold-excited elastic emission peak near 398.5 eV was used to align the SXE spectra to the XAS. (b) Magnified view of the SXE and XAS of GaNBi with various Bi contents highlighting the changes to the band edge positions.

In the wide view of the spectra shown in Fig. 7(a), the overall features of the SXE and XAS spectra can be observed. In a homogeneous amorphous system, the sharp features of the XAS spectra should be broadened due to the lack of long-range periodicity as was reported for a-GaN1−xAsx in Ref. Reference Yu, Novikov, Broesler, Demchenko, Denlinger, Liliental-Weber, Luckert, Martin, Walukiewicz and Foxon11. The presence of peaks in the XAS spectra for GaNBi films of various compositions suggests that a significant fraction of nitrogen in the film is in the form of crystalline GaN. However, the peaks tend to broaden and begin to wash out as the Bi content increases from 0 to 5.5 at.%. Examining the XAS at different incident angles (10°, 45°, and 75°) suggests that intermediate Bi concentrations show increasing orientational disorder. For higher Bi concentrations, the loss of some anisotropy suggests decreasing long-range order and/or an increasing fraction of amorphous phase. This is consistent with the TEM observations described earlier.Reference Liliental-Weber, dos Reis, Levander, Yu, Walukiewicz, Novikov and Foxon25
The increasing overall SXE VB emission and peak shift to lower energy for greater Bi content in Fig. 7(a) is a reflection of the loss of threshold-excited k-selectivity due to the presence of in-gap states and/or loss of crystallinity (but not due to loss of orientational order in a polycrystalline phase).Reference Strocov, Schmitt, Rubensson, Blaha, Paskova and Nilsson30 For crystalline GaN (and randomly ordered polycrystalline GaN), nitrogen K-edge threshold excitation occurs at the CB minimum at the Γ-point and hence restricts the possible VB emission from only the same Γ-point due to the lack of intermediate state scattering paths to excite the electron to other k-points.Reference Strocov, Schmitt, Rubensson, Blaha, Paskova and Nilsson30 The emission k-selectivity suppresses the overall intensity of the SXE spectra relative to above-threshold excitation, and a relative intensity shift toward higher energy is indicative of the direct gap location of the VBM. With the introduction of (k-independent) localized gap states and a decrease of long-range order, the special Γ-point selectivity for threshold x-ray excitation is destroyed and the VB x-ray emission for k-points throughout the Brillouin zone (BZ) is allowed. The result is the overall intensity increase and lineshape shift back to lower energy, more reflective of the full BZ-averaged nitrogen partial DOS. Because of the k-selectivity effect, the relative experimental intensities of the 398.5-eV-excited SXE spectra in Fig. 7(a) were preserved and not individually normalized to the same maximum value.
Taking a close look at the bandgap region of the SXE and XAS spectra in Fig. 7(b), the effect of Bi on the band edge positions can be determined. There is a dramatic difference in the behavior of the VBE and the conduction band edge (CBE) with increasing Bi content. At 2.5 at.% Bi, a weak high-energy foot is observed in the SXE. The VBE jumps from ∼395 eV to ∼396.5 eV, which is approximately midgap of GaN, whereas the CBE only moves slightly to lower energy by ∼0.2 eV. As the Bi content increases to 5.5 at.%, the VBE remains in a similar position, but the amplitude of the SXE increases indicating increased hybridization between N and Bi. The CBE gradually shifts to lower energy as the Bi content increases until the gap region is almost eliminated. The appearance of a near-zero gap could be due to simultaneous x-ray absorption and emission from a partially occupied Bi-derived band near the midgap energy position of GaN.
The abrupt movement of the VBE to midgap agrees qualitatively with the expected location of the Bi impurity level and the BAC model. According to the BAC model, upon isoelectronic substitution of an anion with a metal-like highly mismatched element, the impurity states will hybridize with the VB causing an abrupt shift of the VBE to higher energy.Reference Walukiewicz, Alberi, Wu, Shan, Yu, Ager and Erol31 This effect has been extensively studied in the GaN1−xAsx system in which the bandgap is dramatically reduced from 3.4 to 2.6 eV for x ∼0.01 due to the movement of the VB.Reference Wu, Walukiewicz, Yu, Denlinger, Shan, Ager, Kimura, Tang and Kuech5 This effect has also been studied in the dilute GaAs1−xBix alloys.Reference Alberi, Dubon, Walukiewicz, Yu, Bertulis and Krotkus3
The efficient p-type doping of GaNBi alloys can be understood in terms of the amphoteric defect model, which relates the p-type dopability to the location of the VB relative to the Fermi level stabilization energy, E FS—an energy reference common to all semiconductors and located at about 4.9 eV below the vacuum level.Reference Walukiewicz28 GaN is difficult to dope p-type because the VB lies as low as 2.8 eV below E FS. As mentioned above, the partial replacement of N with Bi leads to a rapid upward shift of the VBE in the resulting GaNBi alloy. Thus, the VBE in GaNBi is located only about 1.3 eV below E FS, making this material easier to be doped p-type. The large shift of the VBE to higher energy would greatly reduce the formation energy of acceptor-like native defects and may be responsible for the p-type conductivity observed and described above.
IV. CONCLUSIONS
We have attempted to form homogeneous amorphous GaNBi thin films using highly nonequilibrium LT-MBE. The composition of the films and chemical interaction between GaN and Bi were strongly dependent on the Ga flux controlling the III:V ratio. Optimization of the growth conditions was achieved resulting in a RBS-determined III:V ratio near unity and undetectable oxygen contents in the bulk of the film. At high bismuth BEP, the GaN (0002) XRD peak vanishes but nanocrystallites remain embedded in an amorphous matrix. The conductivity of the films increases dramatically with Bi content and holes are the majority carrier type as determined by thermopower measurements. The modification of the nitrogen partial DOS due to the chemical interaction between GaN and Bi was determined using SXE spectroscopy and XAS. The p-type conduction may be facilitated by the abrupt movement of the VBE toward midgap. Extensions of this work will focus on a more comprehensive study of the structure of the GaNBi films, further investigation of the p-type conductivity, and further optimization of the growth to form a homogeneous amorphous phase of GaNBi.
ACKNOWLEDGMENTS
This work was supported by the Director, Office of Science, Office of Basic Energy Sciences, Materials Sciences and Engineering Division of the U.S. Department of Energy under Contract No. DE-AC02-05CH11231. O.D. Dubon acknowledges support from the National Science Foundation under Contract No. DMR-0349257 for electrical measurements. The use of the National Center for Electron Microscopy of the Lawrence Berkeley National Laboratory in Berkeley, CA, is highly appreciated. The synthesis work at the University of Nottingham was undertaken with support from the Engineering and Physical Sciences Research Council (Grant Nos. EP/I004203/1, EP/G046867/1, and EP/G030634/1). A.X. Levander acknowledges the National Science Foundation for financial support.