Introduction
High-resolution computed tomography (CT) of the temporal bone, using bone-specific parameters and millimetric sections, is the imaging method of choice to evaluate morphological and topographic characteristics, and examine activity of otospongiotic foci in otosclerosis, and to establish a differential diagnosis between otosclerosis and other diseases with similar clinical manifestations.Reference Vicente, Penido, Yamashita and Albernaz1–Reference Berrettini, Ravecca, Volterrani, Neri and Forli3 This imaging method reveals with precision the presence of active or spongiotic otosclerotic lesions caused by bone demineralisation, including hypodense (single, multiple or confluent) foci in the otic capsule.Reference Vicente, Penido, Yamashita and Albernaz1 Despite correlating well with histological changes in otosclerosis, high-resolution CT has limitations in detecting the inactive (sclerotic) phase of otosclerosis when the density of the lesion is similar to that of the normal otic capsule.Reference Kawase, Naganawa, Sone, Ikeda and Ishigaki4,Reference Wycherly, Berkowitz, Noone and Kim5
Some studies have evaluated the association between high-resolution CT findings and audiometric data in patients with otospongiosis. Since the 1970s, studies have shown controversial results in this regard, with some not even considering such association,Reference Schuknecht6–Reference Zhu, Sha, Zhuang, Olszewski, Jiang and Xu10 suggesting that it only occurs in the presence of demineralisation. In contrast, other studies have shown otospongiotic foci to be responsible for sensorineural hearing loss, suggesting an association between their location and pure-tone audiometry measures.Reference Parahy and Linthicum11–Reference Marx, Lagleyre, Escudé, Demeslay, Elhadi and Deguine21 Of note, Png et al.Reference Png, Pang, Karandikar, Goh, Yeo and Yuen22 recently found no relationship between tomographic and audiometric findings in this setting. These conflicting results may be a result of different sample sizes or otosclerosis phases across the studies, and diverse ethnicities in the populations studied.
Based on these considerations, the primary aim of this study was to evaluate the association between pure-tone audiometry measures and tomographic findings in otospongiosis. Secondary aims of the study included the analysis of associations between pure-tone audiometry measures and: (1) the distribution of otospongiotic foci; (2) the extension of the otospongiotic foci to the cochlear endosteum; and (3) the diameter of the spongiotic foci.
Materials and methods
The study protocol was approved by the Human Research Ethics Committee of Pontifícia Universidade Católica do Paraná, Brazil (protocol number: 3.327.384; 15 May 2019).
This cross-sectional, retrospective study consisted of a review of medical records of patients who had undergone stapedotomy and had otospongiosis confirmed during the procedure. The surgical procedures were performed between 2010 and 2018 at a specialised hospital in southern Brazil.
Collected data included information on pure-tone audiometry measures and images obtained by high-resolution CT scanning of the temporal bone, all of which were conducted at the same diagnostic centre.
The inclusion criteria comprised the following: (1) stapedotomy patients who had undergone pure-tone audiometric evaluation and high-resolution CT scanning of the temporal bone during pre-operative evaluation; (2) audiogram findings with measurement of air conduction and bone conduction thresholds; and (3) tomographic findings with confirmed presence of otospongiotic foci. Patients were excluded if they had undergone audiometric or tomographic evaluation at a diagnostic centre other than the study site. Of 173 ears subjected to stapedotomy during the study period, 57 ears (36 patients) fulfilled the criteria for inclusion.
The minimum thresholds for detecting pure tones were assessed and recorded in audiograms, using air and bone conduction and air–bone gap at frequencies of 0.5, 1, 2 and 4 kHz. Air conduction testing measured audiometric thresholds at frequencies of 0.25, 0.5, 1, 2, 3, 4, 6 and 8 kHz. Bone conduction testing measured the thresholds at 0.5, 1, 2, 3 and 4 kHz. The air–bone gap was calculated as the difference between the air conduction threshold and the bone conduction threshold. The calculation also included the four-tone average of air conduction threshold, bone conduction threshold and air–bone gap at frequencies of 0.5, 1, 2 and 4 kHz.
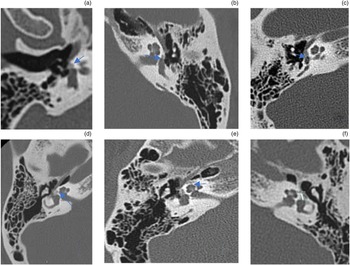
Tomographic evaluation included topographic information related to: otospongiotic involvement of the fissula ante fenestram, stapes and vestibule; extension of the otospongiotic foci to the cochlear endosteum in the basal turn, middle turn and apical turn; and largest diameter of the otospongiotic focus (Figure 1).
Tomographic images showing: (a) otospongiotic focus affecting the fissula ante fenestram; (b) contact of the otospongiotic focus with the endosteum of the vestibule; (c) contact of the otospongiotic focus with the endosteum of the basal turn of the cochlea; (d) contact of the otospongiotic focus with the endosteum of the middle turn of the cochlea; (e) contact of the otospongiotic focus with the endosteum of the apical turn of the cochlea; and (f) measurement of the largest diameter of the otospongiotic focus (line). Arrows indicate otospongiotic focus.

The tomographic images, obtained using volumetric acquisitions with 0.625 mm axial section thickness, were read by a radiologist experienced in temporal bone analysis and blinded to the audiometric results.
The analysis included the frequency of otospongiotic foci, extension of the otospongiotic foci to the cochlear endosteum, and association with air and bone conduction audiometry, air–bone gap, diameter of the otospongiotic foci, four-tone average and hearing loss.
Statistical analysis
Measures of central tendency and dispersion are expressed as mean ± standard deviation values, and, for asymmetrical distribution, median and interquartile range values. The assumption of normality was assessed using the Shapiro–Wilk test.
Statistical analyses were performed using the student's t-test, factorial analysis of variance (ANOVA), ANOVA for repeated measures with post hoc Duncan's test, Kruskal–Wallis ANOVA with post hoc Mann–Whitney test, and Pearson's correlation. The sample size was estimated considering a test power of 95 per cent, a significance level of 5 per cent, a magnitude of effect of 15 points and a standard deviation of 15 points, yielding a minimum sample size of 45 ears.
Results
The study included 36 patients (19 women; 52.8 per cent) with a mean age of 45.3 ± 12.0 years. The high-resolution CT scan indicated otospongiosis in both ears in 21 patients and in a single ear in 15 patients, including 7 in the right ear and 8 in the left ear. Among the 57 ears, otospongiosis was identified in the right ear in 28 cases (49.1 per cent) and in the left ear in 29 cases (50.9 per cent).
An otospongiotic focus was identified in the fissula ante fenestram in 52 ears (91.2 per cent), in the vestibule in 52 ears (91.2 per cent) and in the stapes in 4 ears (7.0 per cent). Extension of the otospongiotic foci to the cochlear endosteum was not observed in 30 ears (52.6 per cent) and was seen in 27 ears (47.4 per cent). Extension to the basal turn, middle turn and apical turn was observed in 25 ears (43.8 per cent), 15 ears (26.3 per cent) and 2 ears (3.5 per cent), respectively.
There were no differences in air conduction or bone conduction audiograms related to the presence or absence of a focus in the fissula ante fenestram, or in contact with the endosteum of the vestible (EV), basal turn or middle turn (p > 0.05).
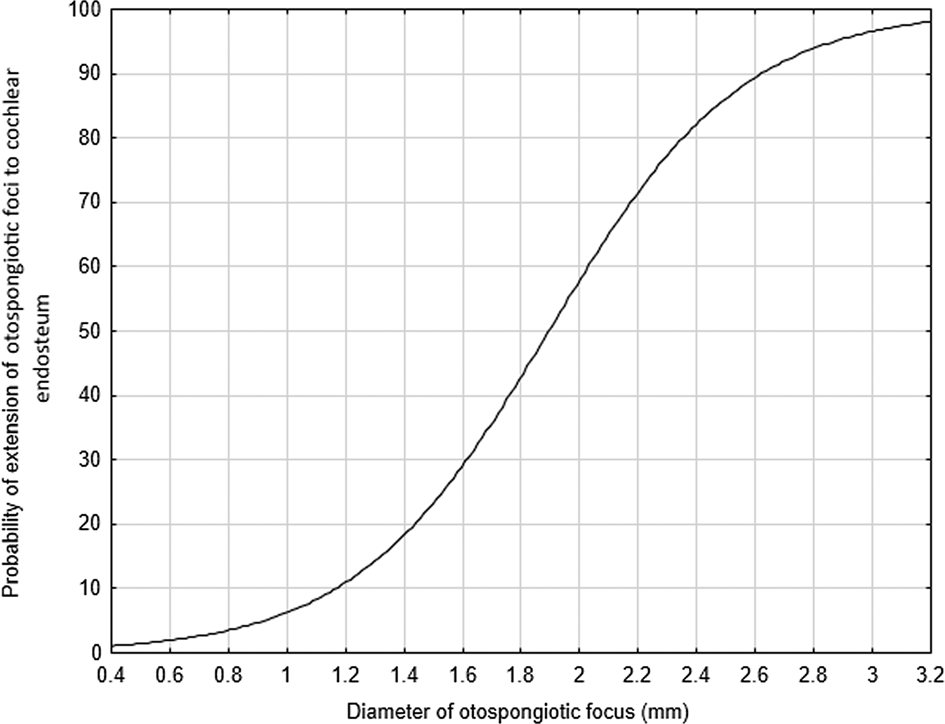
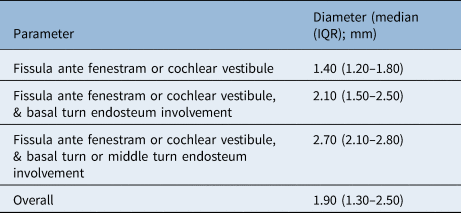
The diameter of the spongiotic focus was smaller than 0.7–1.3 mm in the absence of extension of the otospongiotic foci to the cochlear endosteum (p = 0.01) (Table 1). Thus, the probability of extension of the otospongiotic foci to the cochlear endosteum increased with increasing spongiotic focus diameter (Figure 2).
Probability of extension of the otospongiotic foci to the cochlear endosteum according to the diameter of the otospongiotic focus (univariate logistic regression, p < 0.001).

Diameter of otospongiotic focus according to topography of the focus

Kruskal–Wallis analysis of variance, p = 0.01. Post hoc Mann–Whitney test: the diameter of otospongiotic focus without extension to the cochlear endosteum is less than the diameter of the otospongiotic focus with extension to the cochlear endosteum. IQR = interquartile range
In the presence versus absence of extension of the otospongiotic foci to the cochlear endosteum, similar four-tone average results were observed regarding air conduction thresholds (50.4 ± 14.6 dB vs 51.0 ± 15.5 dB, respectively; p = 0.87) and bone conduction thresholds (25.7 ± 9.0 dB vs 25.2 ± 8.6 dB, respectively; p = 0.81). The four-tone averages of both air and bone conduction thresholds were similar in terms of the presence or absence of spongiotic foci in the stapes (p = 0.76).
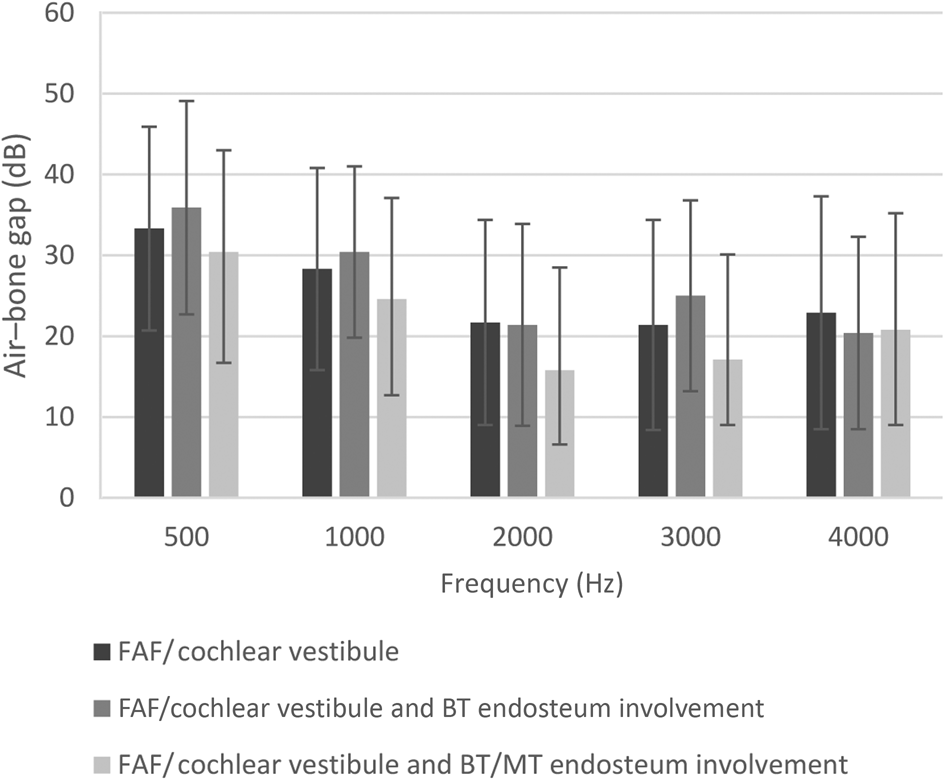
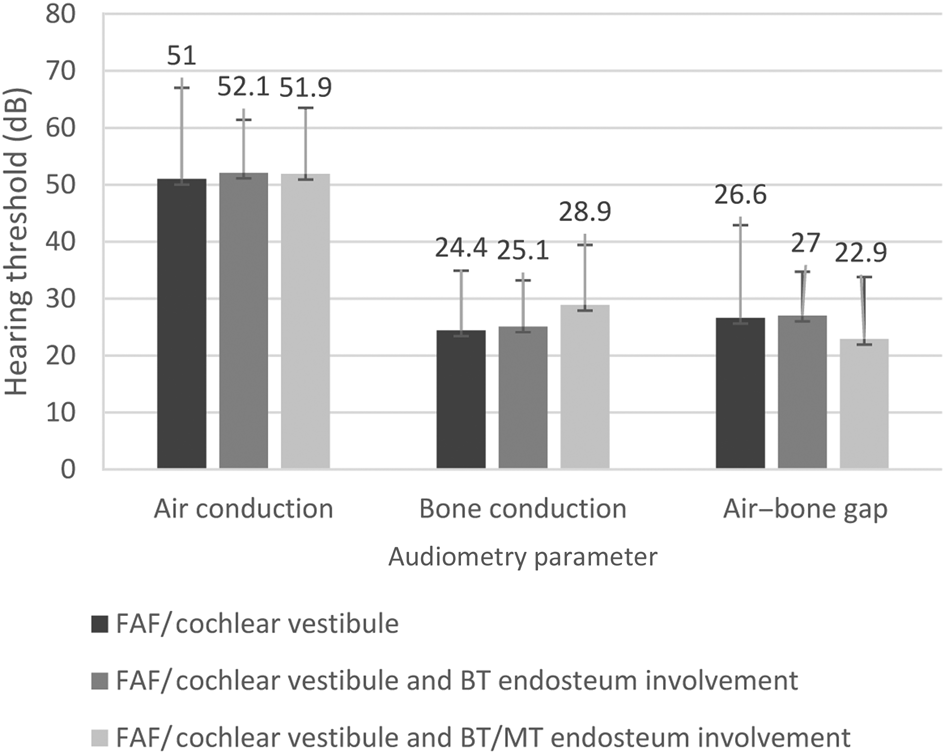
Hearing loss was comparable in ears with and without extension of the otospongiotic foci to the cochlear endosteum (p > 0.05) (Figure 3). As shown in Figure 4, no differences were observed regarding the four-tone average of air and bone conduction thresholds or air–bone gap between these groups (p > 0.05).
Air–bone gap and location of the otospongiotic focus (one-way analysis of variance: 500 Hz, p = 0.76; 1000 Hz, p = 0.58; 2000 Hz, p = 0.47; 3000 Hz, p = 0.24; 4000 Hz, p = 0.76). (Fissula ante fenestram or cochlear vestibule, n = 24; fissula ante fenestram or cochlear vestibule, and basal turn of the cochlea endosteum involvement, n = 12; fissula ante fenestram or cochlear vestibule, and basal turn of the cochlea or middle turn of the cochlea endosteum involvement, n = 12.) FAF = fissula ante fenestram; BT = basal turn of the cochlea; MT = middle turn of the cochlea

Four-tone average (0.5–4 kHz) of air and bone conduction thresholds, and air–bone gap, according to the topography of the otospongiotic focus (one-way analysis of variance, p > 0.05). (Fissula ante fenestram or cochlear vestibule, n = 24; fissula ante fenestram or cochlear vestibule, and basal turn of the cochlea endosteum involvement, n = 12; fissula ante fenestram or cochlear vestibule, and basal turn of the cochlea or middle turn of the cochlea endosteum involvement, n = 12.) FAF = fissula ante fenestram; BT = basal turn of the cochlea; MT = middle turn of the cochlea

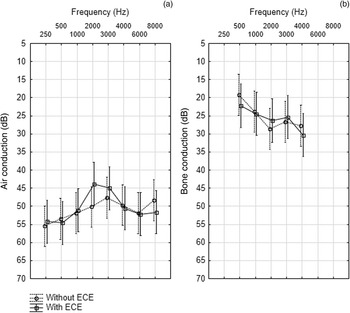
Additionally, no significant differences were observed between the groups in the analysis of air conduction and bone conduction thresholds according to the presence or absence of involvement of the otospongiotic foci in the endosteum of any pericochlear topography (basal turn, middle turn or apical turn) (Figure 5).
(a) Air conduction and (b) bone conduction audiograms according to cochlear endosteum involvement (extension of the otospongiotic foci to the cochlear endosteum (ECE)). Audiograms show comparison between patients without and with cochlear endosteum involvement (analysis of variance for repeated measures, p > 0.05).

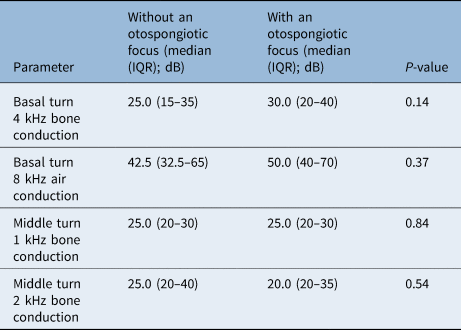
There was no tonotopic association between the topography of the otospongiotic foci and sensory damage (p > 0.05) (Table 2).
Tonotopic association between topography of otospongiotic focus and sensory damage

Mann–Whitney test. IQR = interquartile range
Discussion
The present study found no association between high-resolution CT findings and pure-tone audiometry measures in otospongiosis. However, a relationship was observed between the diameter of the otospongiotic focus and the presence of extension of the otospongiotic foci to the cochlear endosteum, with a greater probability of extension of the otospongiotic foci to the cochlear endosteum with an increased diameter of the otospongiotic focus.
There is a paucity of studies in the literature correlating audiometric and tomographic data in patients with otosclerosis. Such studies are heterogeneous in some respects; for example, regarding the use of different diagnostic methods, and the correlation of varying audiometric and tomographic parameters.Reference Quesnel, Moonis, Appel, O'Malley, McKenna and Curtin23–Reference Karosi, Csomor and Sziklai33
Data in the literature showing a relationship between high-resolution CT and audiometric findings are conflicting. This applies to both the conductive hearing loss component and the sensory ability affected by possible damage to the cochlea.
The present study analysed retrospectively collected audiometric and tomographic data from patients with otosclerosis. Patients included in the sample had a diagnostic confirmation during surgery for stapes fixation. They also had positive signs of otosclerosis in the otospongiotic phase on high-resolution CT evaluation. The study sample included data from 36 patients (57 ears) with otospongiosis.
Studies from the twentieth century (Schuknecht,Reference Schuknecht6 in 1979; Elonka and Applebaum,Reference Elonka and Applebaum7 in 1981; Swartz et al.,Reference Swartz, Mandell, Berman, Wolfson, Marlowe and Popky14 in 1985; Maurício et al.,Reference Mauricio, Biscoito, Branco and Medina34 in 1995; and Güneri et al.,Reference Güneri, Ada, Ceryan and Güneri17 in 1996) and from the beginning of the twenty-first century (Shin et al.,Reference Shin, Fraysse, Deguine, Cognard, Charlet and Sévely18 in 2001; Kiyomizu et al.,Reference Kiyomizu, Tono, Yang and Haruta19 in 2004; Grayeli et al.,Reference Grayeli, Yrieix, Imauchi, Cyna-Gorse and Sterkers8 in 2004; Naumann et al.,Reference Naumann, Porcellini and Fisch9 in 2005; Kawase et al.,Reference Kawase, Naganawa, Sone, Ikeda and Ishigaki4 in 2006; Lagleyre et al.,Reference Lagleyre, Sorrentino, Calmels, Shin, Escudé and Deguine28 in 2009; Zhu et al.,Reference Zhu, Sha, Zhuang, Olszewski, Jiang and Xu10 in 2010; and Marx et al.,Reference Marx, Lagleyre, Escudé, Demeslay, Elhadi and Deguine21 in 2011) point to a tonotopic correlation between areas of pericochlear bone demineralisation and hearing loss in otosclerosis.
More recently, Dudau et al.Reference Dudau, Salim, Jiang and Connor35 published a retrospective review of 259 patients who underwent tomographic scanning for suspected otosclerosis. The study found no association between isolated topographic involvement by otosclerosis and audiometric data. However, when cases with multiple and simultaneous topographic involvements were analysed, especially when the endosteum and the round window were involved, some associations between audiometric and tomographic data were identified. A retrospective study by Png et al.,Reference Png, Pang, Karandikar, Goh, Yeo and Yuen22 carried out in a population without endemic otosclerosis, found no significant correlation between the densitometry of the foci on high-resolution CT and the audiometric findings of average air conduction threshold, bone conduction threshold or air–bone gap.
There is still no consensus in the literature regarding the ability of tomographic imaging to predict audiometric threshold information in otosclerosis. Although the pathophysiology of the disease in terms of hearing loss development is known, the application of this knowledge to infer the results from imaging studies remains imprecise.
Some characteristics of the present study are different from those of the studies mentioned above. Our sample included only patients with a confirmed diagnosis of the disease (confirmed intra-operatively). Furthermore, only cases in which the spongiotic phase was detected by the imaging were considered for inclusion in the sample. The study attempted to characterise the sample by considering different involved topographies, in which there was clear contact of the otospongiotic focus with the endosteum of the inner ear in the analysed pericochlear regions. The data analysis was performed under the perspective of cochlear tonotopy.
No significant associations were demonstrated for most of the audiometric and tomographic data analysed. In the present study, high-resolution CT and its findings regarding the otospongiotic phase of the disease were unable to predict a greater air–bone gap, or higher averages in air conduction or bone conduction hearing thresholds.
• There is established knowledge regarding pathophysiology of otosclerosis in inducing hearing loss
• However, there is no consensus regarding the relationship between high-resolution computed tomography and hearing thresholds in pure-tone audiometry
• Imaging of otosclerosis, in otospongiotic foci cases, showed no significant correlation with air and bone conduction thresholds or air–bone gap
• However, a greater otospongiotic focus diameter in the presence of foci extension to the cochlear endosteum was observed
• In addition, the probability of cochlear endosteum involvement was greater with increasing otospongiotic focus diameter
A possible explanation for the absence of relevant findings in the analysed variables is that, on tomographic evaluation of otosclerosis, it is easy to detect the spongiotic phase but difficult to detect the sclerotic phase of the disease. The lesions in the sclerotic phase are usually isodense on tomographic images and only identified when they generate significant changes, remodelling the structures of the otic capsule.
Conclusion
In the sample analysed in the present study, there was no relevant association between high-resolution CT findings and pure-tone audiometric evaluation or average air–bone gap. However, we observed a greater diameter of the otospongiotic focus in the presence of extension of the otospongiotic foci to the cochlear endosteum, and an increased probability of extension of the otospongiotic foci to the cochlear endosteum with increasing diameter of the otospongiotic focus.
Acknowledgements
The authors would like to express their gratitude to the Hospital Iguaçu and the Center for Advanced Diagnostic Imaging (DAPI).
Competing interests
None declared