Autism is a neurodevelopmental disorder that involves deficits in communication, impairments in social interaction, and the presence of repetitive or stereotyped patterns of behavior (American Psychiatric Association, 2000). In general, it is thought that there is enough variability in cognitive and linguistic abilities to consider autism a spectrum disorder (Rapin & Dunn, Reference Rapin and Dunn2003; Rice, Warren, & Betz, Reference Rice, Warren and Betz2005; Volkmar, Lord, Bailey, Schultz, & Klin, Reference Volkmar, Lord, Bailey, Schultz and Klin2004). Individuals with normal intellectual abilities and/or normal language functioning are often defined as having high-functioning autism (HFA). Asperger syndrome and pervasive developmental disorder—not otherwise specified are sometimes included when discussing the high-functioning end of the autism spectrum. By definition, the diagnosis of Asperger syndrome does not have gross language delays in early development, which differentiates it from autism (American Psychiatric Association, 2000), although the absence of gross language delays does not preclude pragmatic language deficits in these individuals (Shriberg et al., Reference Shriberg, Paul, McSweeny, Klin, Cohen and Volkmar2001).
Regardless of their specific diagnosis and functioning level, individuals with autism exhibit significant impairments in the pragmatic use of language (Tager-Flusberg, Reference Tager-Flusberg2001; Young, Diehl, Morris, Hyman, & Bennetto, Reference Young, Diehl, Morris, Hyman and Bennetto2005). In particular, marked atypicalities in suprasegmental aspects of speech are considered a core feature of the disorder, and are one of the earliest atypical features to appear (Baltaxe & Simmons, Reference Baltaxe, Simmons, Schopler and Mesibov1992; Tager-Flusberg, Reference Tager-Flusberg2001). Moreover, expressive prosody deficits persist even while other areas of language functioning improve (Shriberg et al., Reference Shriberg, Paul, McSweeny, Klin, Cohen and Volkmar2001), and prosodic differences have been found to be significantly related to ratings of social and communicative functioning in autism (Paul, Shriberg, et al., Reference Paul, Shriberg, McSweeny, Cicchetti, Klin and Volkmar2005). It is important that the understanding of prosody in typical and atypical development has lagged behind other areas of language, because until recently there has been a general lack of theoretical and methodological sophistication in investigating prosody production (Lord & Paul, Reference Lord, Paul, Cohen and Volkmar1997; Watson, Gunlogson, & Tanenhaus, Reference Watson, Gunlogson and Tanenhaus2006).
A wide variety of terminology has been used to describe prosodic patterns in this population. Even the earliest characterizations of the disorder described peculiar use of the tone of voice (Asperger, Reference Asperger1944, as translated by Frith, Reference Frith1991; Kanner, Reference Kanner1946), but Asperger noted that “we do not intellectually understand many of these qualities and can only feel them intuitively” (Asperger, Reference Asperger1944, as translated by Frith, Reference Frith1991, p. 70). Prosodic patterns in this population have been characterized with terms such as flat/monotonous, variable, sing-songy, and/or pedantic, among others (Amoroso, Reference Amoroso, Papousek, Jurgens and Papousek1992; Baltaxe, Reference Baltaxe1984; Fay & Schuler, Reference Fay and Schuler1980; Goldfarb, Braunstein, & Lorge, Reference Goldfarb, Braunstein and Lorge1956; Lord, Rutter, & Lecouteur, Reference Lord, Rutter and Lecouteur1994; Provonost, Wakstein, & Wakstein, Reference Provonost, Wakstein and Wakstein1966). Prosody is commonly included as a diagnostic characteristic in clinical assessments of autism (Lord, Rutter, DiLavore, & Risi, Reference Lord, Rutter, DiLavore and Risi1999; Rutter, Le Couteur, & Lord, Reference Rutter, Couteur and Lord2003). In these instruments, however, prosodic impairments are often broadly defined. Deviations in rate, rhythm, volume, intonation, or the inability to change language register based on the interlocutor (resulting in speech that sounds pedantic or inappropriate) all could represent the atypical prosody that is characteristic of autism. The wide-ranging characterization of prosodic deficits is the result of both the diversity of impairments within the population (Rapin & Dunn, Reference Rapin and Dunn2003; Rice et al., Reference Rice, Warren and Betz2005; Tager-Flusberg, Reference Tager-Flusberg2004; Volkmar et al., Reference Volkmar, Lord, Bailey, Schultz and Klin2004), and until very recently, the paucity of studies using objective measurements of prosodic deficits (McCann & Peppé, Reference McCann and Peppé2003; Watson et al., Reference Watson, Gunlogson and Tanenhaus2006).
RESEARCH ON PROSODY PRODUCTION IN AUTISM SPECTRUM DISORDERS
A variety of measurement techniques have been used to study expressive prosody in autism spectrum disorders. Unfortunately, the presence and proper delineation of related diagnoses such as Asperger syndrome is an area of considerable disagreement (Miller & Ozonoff, Reference Miller and Ozonoff2000; Volkmar et al., Reference Volkmar, Lord, Bailey, Schultz and Klin2004). Therefore, for the purpose of this review, we will use the group labels as defined by the each of the studies, but we will consider the work as part of prosody functioning in the entire autism spectrum.
Standardized measures have shown some sensitivity to prosody production deficits in some (but not all) participants with autism. Shriberg et al. (Reference Shriberg, Paul, McSweeny, Klin, Cohen and Volkmar2001) used the Prosody Voice Screening Profile (Shriberg, Kwiatkowski, & Rasmussen, Reference Shriberg, Kwiatkowski and Rasmussen1990), a standardized prosody assessment, to study speech and prosody characteristics in individuals with HFA and individuals with Asperger syndrome (matched on age and verbal IQ [VIQ]) compared to a normative typical sample that was not matched on age, but was within the same age range. The authors found that some individuals with HFA used inappropriate phrasing, but that approximately half of the individuals with HFA were considered to have adequate prosody. Two studies using a sample of 32 children with HFA (McCann, Peppé, Gibbon, O'Hare, & Rutherford, Reference McCann, Peppé, Gibbon, O'Hare and Rutherford2007; Peppé, McCann, Gibbon, O'Hare, & Rutherford, Reference Peppé, McCann, Gibbon, O'Hare and Rutherford2007) measured prosodic deficits using the Profiling Elements of Prosodic Systems—Children (Peppé & McCann, Reference Peppé and McCann2003). Although this assessment was not standardized at the time of these studies, a sample of 72 children matched on verbal mental age was used for comparison. In contrast to Shriberg et al. (Reference Shriberg, Paul, McSweeny, Klin, Cohen and Volkmar2001), the authors were able to find some evidence of deficits for each participant with autism in at least one area of prosody functioning. This prosodic assessment relied on human judgment of expressive prosody, and the authors highlighted the need for acoustic analyses in future studies to provide a fuller understanding of differences in expressive prosody.
Paul, Augustyn, and colleagues (Reference Paul, Augustyn, Klin and Volkmar2005) developed an experimental paradigm to measure expressive prosody. This study analyzed the profile of prosodic functioning in individuals with autism spectrum disorders (including 52% with HFA, 37% with Asperger syndrome, and 11% with a pervasive developmental disorder—not otherwise specified) in comparison to typical controls matched by age on a series of tasks designed to measure the comprehension and use of prosody for grammatical, pragmatic, and affective purposes. Paul, Augustyn, et al. (Reference Paul, Augustyn, Klin and Volkmar2005) found the participants with autism spectrum disorders showed impaired stress placement, but their use of intonation and phrasing was otherwise similar to typical controls.
Fine, Bartolucci, Ginsberg, and Szatmari (Reference Fine, Bartolucci, Ginsberg and Szatmari1991) used a trained phonetician to code the stress placement of individuals with HFA, individuals with Asperger syndrome matched on overall IQ and VIQ, and psychiatric outpatients (not matched on age, IQ, or verbal abilities) in a taped and unstructured 10-min interview. The authors found that participants with HFA were more likely than controls to misplace stress and to have unexpected patterns of stress placement with no communicative value. The authors also found more subtle deviations in stress placement between participants with Asperger syndrome and controls.
Overall, research using a wide variety of approaches (standardized assessments, and experimental paradigms, and coding by trained phoneticians) has had some success in the objective measurement of prosodic characteristics in HFA, although researchers have highlighted the importance of measures that may be more sensitive to subtle characteristics of prosody production in autism. In addition, research by Fine and colleagues (2001) shows that using naturalistic speech samples may reveal some of these more subtle differences. Paul, Augustyn, et al. (Reference Paul, Augustyn, Klin and Volkmar2005) and Peppé et al. (Reference Peppé, McCann, Gibbon, O'Hare and Rutherford2007) have both highlighted the need for acoustic analyses to investigate the nature of these expressive impairments more explicitly.
ACOUSTIC ANALYSIS OF PROSODY
The term prosody encompasses a number of suprasegmental aspects of speech, including metrical structure, phrasing, and variations in pitch level, or intonation. The acoustic measure of pitch is the fundamental frequency (F0). Pitch movements in English are of two types: “pitch accents,” local peaks, or valleys in the F0 contour that align with prosodically prominent syllables; and boundary tones, which align with edges of phrases constituting major prosodic units. Both sorts convey pragmatic information. Patterns of relative prominence, with associated pitch accents, vary as a function of the information structure of the utterance, that is, the status of various constituents as discourse—new or given; boundary tones provide cues to the intended disposition of a sentence or phrase in discourse (Halliday, Reference Halliday1967; Ladd, Reference Ladd1980; Pierrehumbert & Hirschberg, Reference Pierrehumbert, Hirschberg, Cohen, Morgan and Pollack1990; among others). Individuals vary both in how much pitch movement they exhibit and in the range they employ in such movement. In addition, speakers can also mark information structure with changes in duration, changes in the intensity of the sound wave, or even changes in the segmental properties of a word. Nonetheless, less within-subject F0 variation than is typical might correlate with a less articulated metrical structure, with possible consequences for information structure. Alternatively, the same information may be marked but with less attention to pitch range (i.e., with lower or higher pitch peaks than is typical). Because pitch excursions above or below the typical range may be used to signal content specific to context, sustained production of this type of F0 variation would suggest that a speaker is using intonation in a nontypical manner, or is inattentive to pragmatic context.
An important gap in the current research on prosody production in autism is the lack of acoustic analyses of speech in this population. Shriberg and colleagues (Reference Shriberg, Paul, McSweeny, Klin, Cohen and Volkmar2001) noted that the perceptual analysis of prosody may be inadequate to measure certain domains of prosodic functioning in this population. To our knowledge, only three studies have performed acoustic analyses of prosody on individuals with autism (Baltaxe, Reference Baltaxe1984; Fosnot & Jun, Reference Fosnot and Jun1999; Paccia & Curcio, Reference Paccia and Curcio1982), and none of these have focused exclusively on individuals with HFA. Paccia and Curcio (Reference Paccia and Curcio1982) showed the usefulness of this technique by showing how children with autism sometimes changed the prosody they heard when they echoed speech, indicating that echolalia sometimes serves more of a communicative function than often believed.
Two studies acoustically examined prosody in nonecholalic speech. Baltaxe (Reference Baltaxe1984) tracked F0 in five individuals with autism (ages 4–12, ability level not specified) compared to children with language impairment and typically developing children matched on language level (mean length of utterances). Overall, children with autism and controls both had a wider frequency range than children with language impairment, but the children with autism appeared to have either very narrow or very wide ranges in F0. Fosnot and Jun (Reference Fosnot and Jun1999) found that four children with autism (ability level not specified) used a wider pitch range and had greater variation in F0 than age-matched typical controls or children who stuttered both when reading short sentences and imitating sentences produced by others.
These studies provide some initial indication of acoustic differences in the speech of children with autism, although there are several major gaps in the research. First, there is a need for analyses taken from larger samples of subjects to create findings that are more representative of the population. Second, it is necessary to measure F0 variation on a larger, more natural corpus of productive language data (e.g., such as a narrative or conversation). Third, it is important to understand further whether patterns of F0 variation tend to be wider (Baltaxe, Reference Baltaxe1984), or whether some individuals with autism have wider pitch range while others have a more narrow pitch range (Fosnot & Jun, Reference Fosnot and Jun1999). In addition, there is a need for acoustic studies that match comparison groups on variables such as IQ and general language functioning to determine whether acoustic differences are specific to prosody or an artifact of more general language and/or intellectual functioning. Fourth and finally, the identification of acoustic properties of speech that can be measured by speech analysis software has potential for designing training programs that can detect prosodic differences acoustically and provide feedback to these individuals about performance (Kim, Newland, Paul, & Scassellati, Reference Kim, Newland, Paul and Scassellati2008).
The purpose of the current studies is to use acoustic analyses to examine prosody production in children with HFA using larger sample sizes and a larger and more naturalistic speech sample (narratives). In both studies, we examine F0 range in speech samples taken from narratives to identify whether children and adolescents with HFA exhibit differences in pitch range in expressive prosody when compared to typically developing controls matched on intelligence and language abilities. Study 1 examined adolescents, and Study 2 was conducted in an attempt to replicate the findings from Study 1 in a different, and younger, sample of children.
STUDY 1
The first study examined the amount of within-subject variation in F0 in adolescents with HFA and typically developing controls matched on IQ and verbal abilities when retelling a cartoon they had just watched on television. Based on previous research on lower functioning individuals with autism, we predicted that children and adolescents with HFA would have more within-subject variation in their F0 than typically developing controls.
Method
Participants
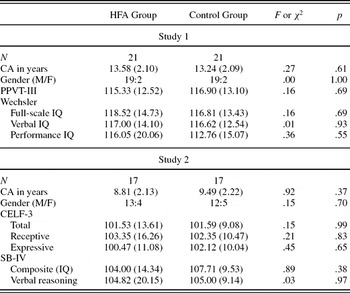
HFA GROUP. The participants were 21 children and adolescents with HFA between the ages of 10 and 18 years who were recruited from the community, a local hospital, and previous studies using this population (see Table 1 for descriptive characteristics of the sample). Diagnoses were confirmed with a combination of the Autism Diagnostic Interview—Revised (ADI-R; Rutter et al., Reference Rutter, Couteur and Lord2003) with caregivers and the Autism Diagnostic Observation Schedule (ADOS; Lord et al., Reference Lord, Rutter, DiLavore and Risi1999) with the participants. The ADOS and ADI-R provide cutoff scores for individuals considered to have an autism spectrum disorder. All participants met diagnostic criteria for an autism spectrum disorder on both the ADI-R and ADOS. Scores can also be used to make clinical diagnoses based on Diagnostic and Statistical Manual of Mental Disorders, Fourth Edition, Text Revision (DSM-IV-TR; American Psychiatric Association, 2000) criteria. All participants in this group met criteria for autistic disorder. It should be noted that no participants in Study 1 met DSM-IV-TR criteria for Asperger disorder.Footnote 1 Intellectual functioning was established using the Wechsler Intelligence Scale for Children, Third Edition (WISC-III; Wechsler, Reference Wechsler1991) or the Wechsler Adult Intelligence Scale, Third Edition (WAIS-III; Wechsler, Reference Wechsler1997). Language functioning level was determined using the Peabody Picture Vocabulary Test, Third Edition (PPVT-III; Dunn & Dunn, Reference Dunn and Dunn1997) and the WISC-III or WAIS-III VIQ scores. In addition, all participants had full-scale IQ (FSIQ), VIQ, and PPVT-III scores greater than 80. It is important to note that, although children with autism may show some form of language delay/impairment in early development, many individuals on the high-functioning end of the autism spectrum have well-developed language abilities in late childhood/adolescence, and their communication impairment is primarily in the pragmatic use of language (Tager-Flusberg, Paul, & Lord, Reference Tager-Flusberg, Paul, Lord, Volkmar, Paul, Klin and Cohen2005; Young et al., Reference Young, Diehl, Morris, Hyman and Bennetto2005). Thus, children with HFA can achieve average to above average scores on standardized language measures and still exhibit pronounced social–communicative deficits (Siegel, Minshew, & Goldstein, Reference Siegel, Minshew and Goldstein1996).
Descriptive characteristics of study samples

Note: CA, chronological age; PPVT-III, Peabody Picture Vocabulary Test, Third Edition; CELF-3, Clinical Evaluation of Language Fundamentals, Third Edition; SB-IV, Stanford Binet Intelligence Scale, Fourth Edition. Wechsler IQs were measured using the age-appropriate Wechsler measure (WISC-IV, WAIS-III). Values are means (standard deviations).
TYPICALLY DEVELOPING CONTROL GROUP. Twenty-one participants were recruited from the community. Participants were evaluated using the ADOS and either the ADI-R or the Autism Symptoms Questionnaire (Berument, Rutter, Lord, Pickles, & Bailey, Reference Berument, Rutter, Lord, Pickles and Bailey1999) to ensure that there were no indications of an autism spectrum disorder. All participants had FSIQ, VIQ, and PPVT-III scores greater than 80. There were no concerns about autism spectrum disorders, learning disabilities, mental retardation, language delays, or other psychiatric conditions in the control participants, and no history of autism spectrum disorders in their first- or second-degree relatives. Participants were matched by group on gender, age, FSIQ, VIQ, and PPVT-III total score to control for factors that could account for any observed differences. Intelligence was an important factor for us to control because we wanted to restrict our sample to individuals on the high-functioning end of the autism spectrum. We matched on verbal abilities (PPVT-III) to investigate what differences might be specific to prosodic deficits and not the result of impairments in general language abilities. Gender also was an important matching characteristic because females tend to have higher average pitch and more variation in F0 in their voice (see Henton, Reference Henton1989, for a review).
Procedure
NARRATIVE ELICITATION. Participants watched “Canary Row,” a Sylvester and Tweety Bird cartoon that has previously been used to elicit narratives and gestures (McNeill, Reference McNeill1992). The cartoon depicts Sylvester trying to catch Tweety Bird across a series of attempts. The cartoon is primarily nonverbal, although there are a few short exclamations by characters. Participants saw the cartoon in three parts and retold the story after each part to someone they were told had not seen the cartoon before. Narratives were recorded with an external microphone on a stand near the participant that was connected to a VCR through an amplifier.
ACOUSTIC ANALYSES. Narratives were digitized and analyzed acoustically using Praat, a program for speech analysis and synthesis (Boersma & Weenink, Reference Boersma and Weenink2005). We took a sample of average F0 from 250-ms time slices across the entire narrative (all three parts). This produced four data points per second. To determine if the populations differed in the extent to which they used intonation in their speech, we calculated the standard deviation in F0 for each subject. The standard deviation was calculated over all the measured samples of F0 in a subject. This is a basic measure of pitch range and has been used in other clinical acoustic research studies (e.g., Nilsonne, Sundberg, Ternström, & Askenfelt, Reference Nilsonne, Sundberg, Ternström and Askenfelt1988). For example, a relatively large average standard deviation would indicate an expanded pitch range. A relatively small average standard deviation would indicate more narrow pitch range. The average F0 across the entire narrative was also extracted. This provided a general characterization of pitch (e.g., high vs. low) to use as a baseline of pitch properties. A limited number of 250-ms segments were dropped because either the program could not get a pitch track, or the segments included listener and/or examiner comments. Because of the large number of segments per narrative, this did not affect analyses. We also correlated the standard deviation of F0 with the ADOS Communication factor score to relate findings to observed clinical communication deficits in participants with HFA. This factor score is calculated using an algorithm that is based on the DSM-IV-TR diagnostic criteria for the communication impairments in autism. ADOS scores are derived from a trained clinician's judgment of behaviors observed in a structured play session.
Results
Effect sizes were calculated as partial eta squared (η2p) to determine the degree of association between variables. Partial eta squared values between .01 and .06 are considered a small effect, between .06 and .14 are considered a medium effect, and above .14 are considered a large effect.
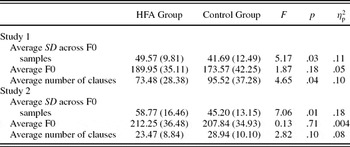
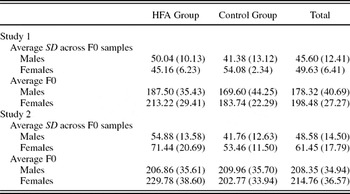
Overall, narratives ranged from 3 to 8 min long, and the group with HFA had significantly shorter narratives in terms of content (i.e., number of clauses; see Table 2). This difference, however, should not have an effect on subsequent statistics, because the overall length of the narratives gave a large number of 250-ms segments (range = 900–2,500 segments per narrative), which yielded a good representation of pitch movement for each subject. As expected, females in both groups (and overall) tended to have a higher average pitch for their voice and more variation in their F0 (see Table 3 for data by gender).
Group means (standard deviations) and statistics for primary study variables
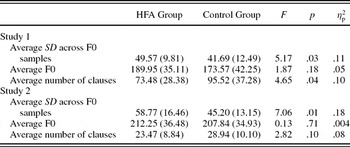
Note: All F0 values are reported in Hertz. SD, average standard deviation of F0 across 250-ms samples.
Group means for main variables by gender

Note: All F0 values are reported in Hertz. SD, average standard deviation of F0 across 250-ms samples.
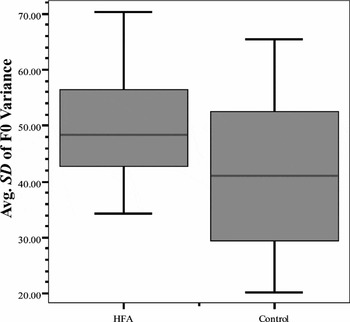
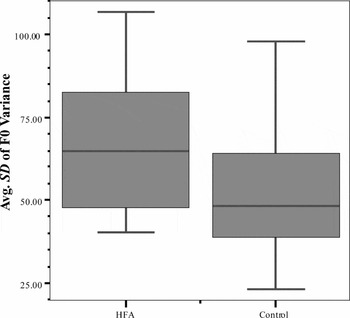
We used one-way analyses of variance to examine acoustic measures of speech (see Table 2 for means and statistical analyses). Overall, participants with HFA had a significantly greater average standard deviation across F0 samples than controls (see Figure 1). This indicates that participants with HFA had a wider F0 range in their narratives. The groups were not significantly different in the average pitch of their narratives.
Group differences in the standard deviation of the fundamental frequency (F0) in Study 1. Note: The box plot represents each group's median and 95% of the range of the standard deviations of F0 (Hz).

For the HFA group, the ADOS Communication factor score (mean = 4.4, SD = 1.7) was significantly correlated with the average standard deviation across F0 samples, r (20) = .43, p < .05. Specifically, subjects with HFA with higher variation in their intonation tended to be judged by a trained clinician as having a greater level of communication impairment. Similar comparisons were not done with the control group, because the majority of these subjects had scores of 0 on the ADOS Communication Scale (mean = 0.23, SD = 0.44).
Conclusions
As predicted, the narratives of children and adolescents with HFA had more within-subject variation in their prosody than typical controls, and this finding was related to clinical judgments of communication impairment in HFA. The findings are not conclusive, however, because there was considerable overlap in the standard deviation of F0 variation between the groups, suggesting that the use of the standard deviation of F0 alone as a measure may not capture fully all of the acoustic factors that could contribute to atypical expressive prosody. Both groups had relatively high cognitive abilities, so it is important to examine these findings with participants who are closer to the average range of intellectual functioning to see whether these findings are generalizable to a broader range of individuals with HFA. In addition, because participants included adolescents, it is possible that differences in expressive prosody could be masked because of additional social experience gained through intervention or more exposure to social interaction. Moreover, it is possible that the higher (although not significant) average F0 of the HFA group accounted for observed differences, as people with higher pitched voices tend to have greater variation in F0 (Henton, Reference Henton1989).
STUDY 2
This study was designed to replicate and extend the findings of Study 1 in a population of children with HFA who were younger and did not have IQs that were as high as those in Study 1, although the IQs for this study were still predominantly in the normal range of cognitive functioning. This sample had the additional advantage of expressive and receptive language data to match on overall language abilities, and not just receptive vocabulary. This matching procedure provides a more rigorous test of whether differences might be specific to prosodic deficits and not the result of impairments in general language abilities. Based on previous clinical accounts and the findings of Study 1, we predicted that there would be greater within-subject variation in the intonation of children with HFA than typical controls when analyzed acoustically. We also predicted there would be no group differences in the more general measure of average pitch.
Methods
Participants
HFA GROUP. The group with HFA was composed of 17 children between the ages of 6 and 14 (see Table 1). Diagnoses were established as above with both the ADOS and the ADI-R, along with clinical judgment by a developmental pediatrician and/or psychologist. All participants met criteria for an autism spectrum disorder on both the ADOS and ADI-R. Fifteen of the 17 participants met DSM-IV-TR criteria for autistic disorder, and the remaining two participants met criteria for Asperger syndrome. Because of potential differences in prosodic functioning between Asperger syndrome and HFA (Ghaziuddin & Gerstein, Reference Ghaziuddin and Gerstein1996), results were analyzed with and without these two participants. Intellectual functioning was determined using the Stanford Binet Intelligence Scale, Fourth Edition (SB-IV; Thorndike, Hager, & Sattler, Reference Thorndike, Hager and Sattler1986). Language functioning was determined via the Clinical Evaluation of Language Fundamentals, Third Edition (CELF-3; Semel, Wiig, & Secord, Reference Semel, Wiig and Secord1995). Similar to Study 1, all participants had SB-IV test composite, SB-IV verbal reasoning, and CELF-3 receptive, expressive, and total scores higher than 80.
TYPICALLY DEVELOPING CONTROL GROUP. Seventeen typically developing children were recruited from the community and evaluated as described above. The presence of any autism spectrum disorder was ruled out using the ADOS and the ADI-R. There were also no concerns about any autism spectrum disorder, learning disabilities, mental retardation, language delays, or other psychiatric conditions in the participants, and no history of autism spectrum disorders in their first- or second-degree relatives. Control participants were matched to the HFA sample by group on age, gender, expressive and receptive language standard scores from the CELF-3 and the test composite and verbal reasoning subscale of the SB-IV. These participants were also used in studies looking at the psychometric evaluation of pragmatic language (Young et al., Reference Young, Diehl, Morris, Hyman and Bennetto2005) and narrative performance (Diehl, Bennetto, & Young, Reference Diehl, Bennetto and Young2006).
Procedures
NARRATIVE ELICITATION. Participants listened to an audiotaped verbal narration of the story Frog, Where Are You? (Mayer, Reference Mayer1969) while looking at a wordless picture book. The story is about boy whose pet frog has escaped from his jar. The boy and his dog go through a series of mishaps before finding the frog, which now has a frog family. The examiner left the room while the participants listened to the story, but said they wanted the participant to tell them the story when they returned without looking at the pictures. Subjects were recorded using a hand-held tape recorder and videotaped using a VHS camcorder with an internal microphone. Acoustic analyses were performed as described in Study 1. It should be noted that the elicitation method in Study 2 differed from Study 1. Whereas Study 2 involved listening to the verbal narration of a story, Study 1 had virtually no verbal information that accompanied the actions of the characters.
Results
Effect sizes were determined as described in Study 1. Overall, narratives ranged from 1 to 4 min long, and there was a trend for the group with HFA to have longer narratives (see Table 2). Similar to Study 1, female subjects tended to have a higher average pitch in their voice and had more variation in their F0 (see Table 3). Moreover, this younger sample had a higher overall pitch for their voice and more variation in their F0 than did the older sample from Study 2. These findings provide support for the validity of our measurements, as females (Henton, Reference Henton1989) and younger children (Whiteside & Hodgson, Reference Whiteside and Hodgson2000) would be expected to have a higher overall pitch and more variation in their F0 for these types of analyses.
One-way analyses of variance revealed that the HFA group had significantly greater average within-subject standard deviation across F0 samples than typical controls (see Figure 2), but groups were not significantly different in average pitch (see Table 2 for statistics). As predicted, these findings indicate that this group had greater within-subject variation in the intonation patterns of their narratives that cannot be accounted for by differences in average pitch. Unlike Study 1, ADOS Communication factor scores (mean = 2.71, SD = 1.1) were not significantly related to the average standard deviation across F0 samples, r (16) = .06, p = .83. The mean of the control group on the ADOS Communication factor was 0.18 (SD = 0.39), and as in Study 1, we did not run correlations with this variable.
Group differences in the standard deviation of the fundamental frequency (F0) in Study 2. Note: The box plot represents each group's median and 95% of the range of the standard deviations of F0 (Hz).

The two subjects diagnosed with Asperger syndrome had average standard deviations across F0 samples of 79.3 and 47.3 Hz, respectively. It is difficult to draw conclusions about this subgroup with only two subjects. Overall findings, however, were similar regardless of whether or not the two children with Asperger syndrome were included in the HFA group.
Conclusions
This study replicates and extends the findings of Study 1 by showing that individuals with HFA exhibit a wider F0 range in their prosody even when matched on language in addition to cognitive abilities. Study 2 also extends the research to a younger population of individuals with HFA, who also have IQ scores that are closer to the average range of the general population than those in Study 1. Importantly, both groups had identical F0 averages in Study 2, suggesting that observed within-subject differences in F0 variation are not the result of between-group differences in average pitch. It is still unclear, however, whether the acoustic findings of these two studies are analogous to human perception of prosody, or whether acoustic analyses of individuals with HFA measure subtle group differences that are not perceived by listeners.
Study 1 suggested a relationship between acoustic data and clinician judgments of communication, but Study 2 failed to replicate this finding. It is possible that the small amount of variance in ADOS Communication Factor scores in Study 2 (SD = 1.1) limited our ability to detect correlations between the two measures. It is also possible that intonation carries greater weight for clinical judgments of communication impairment for older individuals with HFA (Study 1) than for younger individuals (Study 2). It may be that expressive prosodic difficulties in autism are independent of other communicative deficits in autism. Future studies should include qualitative measures of expressive prosody that could be used as dependent variables that are more sensitive to individual differences.
It is also important to note that while both Study 1 and Study 2 involved the retelling of a story, the elicitation methods differed. In Study 1, participants retold a story from a cartoon with no narration, and in Study 2 participants listened to a verbal narration of a story accompanied by a picture book. The act of listening to a story before retelling it, such as in Study 2, could provide a template for the prosody of storytelling that might affect the results. It is possible that providing a prosodic template leads to more overlap in F0 variation between groups. Still, even with different elicitation techniques, both studies had similar findings across acoustic measures and were able to find between-group differences in F0 variation.
GENERAL DISCUSSION
The current series of studies provide support for the use of acoustic measurements as a valid, objective measure of the perceived deficits in expressive prosody in autism. Previous research on autism has not consistently identified the prosodic deficits that are reported clinically, and studies using acoustic measures have had small sample sizes and have not focused specifically on the higher functioning end of the autism spectrum. This study examined children with HFA, a subgroup of individuals with autism spectrum disorders who have normal intelligence and relatively well-developed linguistic abilities. Study 1 found that adolescents with HFA had more within-subject F0 variation in their narratives than controls. Study 2 extended these findings to a different sample of younger children with HFA who had slightly lower IQ scores than Study 1. In addition, Study 1 found evidence that acoustic measurements of prosody were related to clinical judgments of autism-specific communication impairments. Although this was not replicated in Study 2, it is possible that the small amount of variance in the ADOS Communication factor scores in Study 2 (SD = 1.1) could account for a failure to find a correlation between these variables.
The findings of increased F0 variation in individuals with HFA is consistent with previous studies with lower functioning individuals with autism (Baltaxe, Reference Baltaxe1984; Fosnot & Jun, Reference Fosnot and Jun1999), although Fosnot and Jun found both high and low F0 variation in their sample. It should be noted that there was significant overlap between our HFA and control groups in F0 variation, suggesting the possibility that not all individuals with HFA exhibit intonation patterns that are different from their peers. Other studies also demonstrated that there does not seem to be a specific aspect of prosody (e.g., intonation pattern or phrasing) that is disrupted in all individuals with autism (McCann et al., Reference McCann, Peppé, Gibbon, O'Hare and Rutherford2007; Peppé et al., Reference Peppé, McCann, Gibbon, O'Hare and Rutherford2007; Shriberg et al., Reference Shriberg, Paul, McSweeny, Klin, Cohen and Volkmar2001), although Peppé and colleagues (Reference Peppé, McCann, Gibbon, O'Hare and Rutherford2007) did find that at least one aspect of prosodic usage was disordered in all of their participants.
The relationship of expressive prosody to communication deficits in autism
This study provides evidence that there are characteristics of speech that differentiate prosody in individuals with autism from normal prosody production, and that these differences can be quantified and measured acoustically. An important question raised by these findings is why a particular child with HFA might have more variation in their F0 than their language-matched typical peers. The amount of within-subject variation in F0 decreases with age in typical development (Whiteside & Hodgson, Reference Whiteside and Hodgson2000), so it is possible that the difference in F0 variation between the HFA and control group is due to a relative delay in this aspect of prosody use in language/communication development. In other words, it is possible that individuals with HFA eventually develop the same F0 variation as controls, but this happens at a later age. This would signal delayed, rather than deviant development. It is interesting that group differences were greater between the younger HFA and control groups (Study 2) than in the older groups (Study 1). Because the groups were matched on language abilities, however, one might expect that developmental differences would be eliminated. Thus, more variable prosody may be a function of a general delay in later developing communication abilities.
It is also plausible that the increased within-subject F0 variation underlies the subtle idiosyncrasies that distinguish the speech of individuals with HFA. Greater F0 variation could suggest that a speaker is placing discourse marking on more information than is typical, or that they are marking the same information but with greater intensity. This interpretation must be viewed with caution, however, because there is some evidence that greater F0 variation may not be specific to HFA. A recent study of children with Williams syndrome (WS) also found increased F0 variance, although it is possible the differences in this study could be accounted for by the higher average pitch of the WS group (Setter, Stojanovik, Ewijk, & Moreland, Reference Setter, Stojanovik, Ewijk and Moreland2007). Of interest, Setter and colleagues also found that their participants with WS were more emotionally involved in their story telling task, and that this emotional involvement was strongly correlated with their pitch range. This stands in stark contrast to narrative studies on children with autism, which have shown that their narratives are deficient in measures of narrative engagement (e.g., Capps, Losh, & Thurber, Reference Capps, Losh and Thurber2000). Therefore, it is possible that there are different factors influencing pitch variance in autism and WS. Further insight into this question may come from individuals with speech and language disorders not related to autism, who also show subtle atypicalities in prosody use (e.g., Wells & Peppé, Reference Wells and Peppé2003). Future studies should compare the standard deviations of F0 (along with other prosody categories) within and between these groups to identify acoustic profiles of prosodic functioning that are specific to each group.
Our study used gross acoustic measurements across the length of a narrative to investigate the sensitivity of this method. By nature, narratives differ from person to person in their length, content, and manner of retelling, which makes it difficult to make acoustic comparisons of specific aspects of prosody (e.g., stress, phrasing, among many others) between groups. For example, characteristics such as pausing to recall a forgotten portion of a narrative, and the tendency for no two participants to remember and structure their narratives the same way, makes it difficult to examine acoustically the use of phrasing in a group of narratives. To understand further the acoustic characteristics of prosody in this population, it will be important to use speech content that is standardized across subjects to examine within-subject F0 variation in the context of its structure and function in a sentence. Standardized speech content is not spontaneous, however, which would limit its ecological validity to some extent. Therefore, it would be useful to collect both spontaneous speech (e.g., from narratives) and standardized speech samples in future studies to have one set of data that is more ecologically valid, and another that is more reliably similar in content across participants.
Limitations and directions of future research
These studies reinforce assertions that there is a pressing need for researching prosody in autism with more sophisticated methods such as acoustic analyses (Paul, Augustyn, et al., Reference Paul, Augustyn, Klin and Volkmar2005; Peppé et al., Reference Peppé, McCann, Gibbon, O'Hare and Rutherford2007). This study highlighted the utility and sensitivity of acoustic analysis as a measure of prosodic functioning in HFA. Future research should use this technology to focus on the use of prosody to express, emphasize, or alter meaning of the accompanying words. In addition, future studies should examine other characteristics of prosody, such as its metrical structure and the use of pauses to communicate.
Another important question is the relationship between heterogeneity of prosodic atypicalities and the broad spectrum of communication deficits in autism spectrum disorders. For example, both Ghaziuddin and Gerstein (Reference Ghaziuddin and Gerstein1996) and Eisenmajer and colleagues (Reference Eisenmajer, Prior, Leekam, Wing, Gould and Welham1996) found that characteristics of prosody differentiate Asperger syndrome from HFA. Two participants in Study 2 met diagnostic criteria for Asperger syndrome, and the small number of participants in this group did not allow for statistical comparison. One major obstacle in pursuing this line of research is that the diagnosis of Asperger syndrome is an area of considerable disagreement (Volkmar et al., Reference Volkmar, Lord, Bailey, Schultz and Klin2004). There are as many as six existing definitions of Asperger syndrome being used in the literature, and studies have suggested that current frameworks do not create reliable categorical differentiations (Howlin, Reference Howlin2003; Miller & Ozonoff, Reference Miller and Ozonoff2000; Volkmar et al., Reference Volkmar, Lord, Bailey, Schultz and Klin2004). Because of the high current level of general language functioning of our population, it is likely that some of our children could have met criteria for Asperger syndrome using other definitions, especially systems that refer to Asperger syndrome simply as a milder form of autism (Leekam, Libby, Wing, Gould, & Gillberg, Reference Leekam, Libby, Wing, Gould and Gillberg2000). Still, because of the wide range of prosodic deficits, examining their relationship to subgroups of autism spectrum disorders could provide insight into the nature and etiology of the spectrum of autistic disorders.
It is important to note that this paper focuses exclusively on prosody production. McCann and Peppé (Reference McCann and Peppé2003) emphasize the need for understanding prosody comprehension in addition to differences in prosodic expression in individuals with HFA. Several recent studies have begun to address this question (e.g., McCann et al., Reference McCann, Peppé, Gibbon, O'Hare and Rutherford2007; Paul, Augustyn, et al., Reference Paul, Augustyn, Klin and Volkmar2005; Peppé et al., Reference Peppé, McCann, Gibbon, O'Hare and Rutherford2007; Rutherford, Baron-Cohen, & Wheelwright, Reference Rutherford, Baron-Cohen and Wheelwright2002), but there is still much to be learned about prosody comprehension in this population. Because language comprehension often precedes production in development, it is important to investigate comprehension abilities further to truly understand the nature of differences in prosody use.
Clinical implications
These studies are important for several reasons. By utilizing acoustic measures of prosodic ability/disability that can be measured by publicly accessible speech analysis software, this methodology can be used to investigate outcomes of treatment. This approach is already being used to measure the effects of pharmacological agents on symptoms of depression, as these individuals tend to show decreased F0 variance during a major depressive episode (Alpert, Pouget, & Silva, Reference Alpert, Pouget and Silva2001; Garcia-Toro, Talavera, Saiz-Ruiz, & Gonzalez, Reference Garcia-Toro, Talavera, Saiz-Ruiz and Gonzalez2000). Moreover, it may be possible to develop therapeutic programs for individuals with prosody deficits. For example, a program could be developed that acoustically analyzes the prosody of individuals with autism, and provide immediate feedback to an individual on their prosody patterns. In fact, Kim and colleagues are currently developing such a program for use with children with autism (Kim et al., Reference Kim, Newland, Paul and Scassellati2008).
Abnormalities in intonation are considered a characteristic of the disorder according to the DSM-IV-TR and are measured in standardized diagnostic assessments like the ADOS and ADI-R. Increased analysis at the acoustic level will allow researchers to better refine what is known about deficits in this population and allow test makers to develop measures that are sensitive to the specific profile of prosodic functioning in HFA. These findings highlight the presence of these atypicalities even in very high-functioning and linguistically developed adolescents and emphasize the need for diagnostic attention to prosody in a subgroup where subtle yet clinically significant impairments in social–communication drive diagnoses and can be a stigmatizing barrier to social acceptance (Shriberg et al., Reference Shriberg, Paul, McSweeny, Klin, Cohen and Volkmar2001).
In summary, this series of studies shows the usefulness of acoustic measures in examining prosody functioning in this population. It also highlights the powerful potential of using acoustic and perceptual analyses together to understand clinical communication impairment. Finally, these findings provide a basis for future areas of research on prosodic expression in HFA.
ACKNOWLEDGMENTS
We thank Dr. Edna Carter-Young for her assistance in the acquisition and analysis of a subset of the narratives used in this study. We are also grateful to the children and families who participated in this research. This study was supported in part by NIH Grant PO1 HD35466 (a Collaborative Program of Excellence in Autism) and by NIH General Clinical Research Center Grant NCRR 5MO1 RR00044 from the National Center for Research Resources.