Introduction
The maritime Antarctic has recently experienced the highest temperature increases in Antarctica (Vaughan et al. Reference Vaughan, Marchall, Connolley, King and Mulvaney2001, Quayle et al. Reference Quayle, Peck, Peat, Ellis-Evans and Harrigan2002, Steig et al. Reference Steig, Schneider, Rutherford, Mann, Comiso and Shindell2009), accompanied by regional changes in rainfall (Turner et al. Reference Turner, Colwell and Harangozo1997). These changes are expected to affect soil CO2 emissions as soil temperature and moisture are related to microbial activity and soil carbon mineralization (Davidson & Janssens Reference Davidson and Janssens2006). Recent studies have claimed that temporal and spatial changes in soil temperature and moisture, in different environments, would result in significant modifications in soil respiration (Martin & Bolstad Reference Martin and Bolstad2009). However, little attention has been paid to the spatial variability as affected by the size and distribution of plant communities (Smith Reference Smith1994, Grobe et al. Reference Grobe, Ruhland and Day1997), although experiments have shown that a two years warming period was enough to significantly alter plant growth (Day et al. Reference Day, Ruhland, Grobe and Xiong1999). The increase in plant biomass would not just enhance root respiration but also the spatial distribution of soil CO2 emission (Luo et al. Reference Luo, Wan, Hui and Wallace2001).
In the maritime Antarctic a marked expansion of higher plant (Deschampsia antarctica Desv. and Colobanthus quitensis (Kunth) Bartl.) populations has recently been observed at some sites (Parnikoza et al. Reference Parnikoza, Convey, Dykyy, Trakhimets, Milinevsky, Tyschenko, Inozemtseva and Kozeretska2009) with similar changes observed for moss vegetation, which is the dominant community on ice free areas of this region (Convey Reference Convey2006). Since soil CO2 emission is also driven by plant respiration, which in its turn is affected by photosynthetic activity (Kuzyakov & Gavrichkova Reference Kuzyakov and Gavrichkova2010), it is expected that changes in vegetation distribution and composition, in addition to changes in temperature and moisture regimes, would affect CO2 emissions, particularly its spatial variability. Additional information on ecological and physiological aspects of plants and their sensitivity to changing soil temperature is also demanded, especially in West Antarctica (Convey et al. Reference Convey, Bindschadler, Di Prisco, Fahrbach, Gutt, Hodgson, Mayewski, Summerhayes and Turner2009).
Soil CO2 emission is an important aspect of terrestrial carbon cycling and can be influenced by several factors that vary in time and space. In vegetated soils, emissions are driven by microbial decomposition of soil carbon (C) and plant roots respiration (Tang & Baldocchi Reference Tang and Baldocchi2005, Kuzyakov & Gavrichkova Reference Kuzyakov and Gavrichkova2010). Therefore, when addressing the spatial variability of soil CO2 emission, a grid should be installed to allow the recognition of the variability range. In this regard, CO2 emission measurements from bare soils have shown that a significant part of the variability in heterotrophic respiration occurs at a sub-metre scale (La Scala et al. Reference La Scala, Marques, Pereira and Corá2000). Similar studies in vegetated soils have found a variability range from a few to a hundred metres, depending on vegetation and litter distribution (Rochette et al. Reference Rochette, Desjardins and Pattey1991, Fang et al. Reference Fang, Moncrieff, Gholz and Clark1998). Most variability is certainly due to the influence of root respiration on the emission process. Studies have shown increases in soil respiration closer to the stems or crops in forest and agricultural fields, respectively (Tang & Baldocchi Reference Tang and Baldocchi2005).
Soil CO2 emission is also driven by soil temperature, especially in colder regions (Hopkins et al. Reference Hopkins, Sparrow, Elberling, Gregorich, Novis, Greenfield and Tilston2006, Park & Day Reference Park and Day2007), but studies have concentrated mostly on the role of temperature on the temporal variability of emission, with little attention to spatial variability. Such emphasis has been certainly due to the fact that West Antarctica has warmed about 0.1°C per decade, especially in winter and spring (Steig et al. Reference Steig, Schneider, Rutherford, Mann, Comiso and Shindell2009).
When soil respiration is being considered, soil water content is often considered an important factor, especially in sub-Antarctic islands where during most of the thawing period soil water content is close to field capacity (Smith Reference Smith2003). Studies conducted at the Antarctic Dry Valleys have shown that soil CO2 efflux is driven primarily by physical variables such as soil temperature and moisture (Ball et al. Reference Ball, Virginia, Barrett, Parsons and Wall2009).
Elsewhere, other properties related to organic matter content and quality and soil aeration, have been cited as also controlling spatial variability patterns of CO2 emissions (Fang et al. Reference Fang, Moncrieff, Gholz and Clark1998, La Scala et al. Reference La Scala, Marques, Pereira and Corá2000, Xu & Qi Reference Xu and Qi2001, Schwendenmann et al. Reference Schwendenmann, Veldkamp, Brenes, O’Brien and Mackensen2003, Epron et al. Reference Epron, Nouvellon, Roupsard, Mouvondy, Mabiala, Saint-André, Joffre, Jourdan, Bonnefond, Berbigier and Hamel2004). Most of the studies of CO2 emission in soils at high latitudes and their response to climate change have been developed in Arctic tundra ecosystems (Lloyd Reference Lloyd2001, Oberbauer et al. Reference Oberbauer, Tweedie, Welker, Fahnestock, Henry, Webber, Hollister, Walker, Kuchy, Elmore and Starr2007) with little attention given to the maritime Antarctic.
The objective of the present study was to compare soil CO2 emissions between two typical vegetation communities of maritime Antarctica and determine the spatial variability models of soil CO2 emission and soil temperature.
Materials and methods
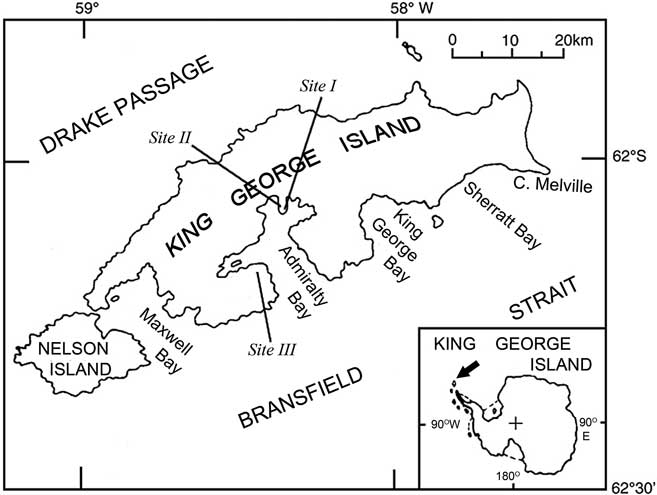
The study was conducted at three different locations in ice-free areas along the shores of Admiralty Bay, King George Island, South Shetland Islands, in soils previously studied by Michel et al. (Reference Michel, Schaefer, Dias, Simas, Benites and Mendonça2006) and Simas et al. (Reference Simas, Schaefer, Melo, Albuquerque-Filho, Michel, Pereira, Gomes and Costa2007a) (Table I, Fig. 1). The soil at sites I and II is a Leptic Thiomorphic Cryosol (according to the WRB system), with acid pH, low organic C levels and is highly weathered by Antarctic standards (Simas et al. Reference Simas, Schaefer, Melo, Albuquerque-Filho, Michel, Pereira, Gomes and Costa2007a). Both sites I and II are located in the vicinity of the Brazilian Comandante Ferraz Station, on the portion of Keller Peninsula which is affected by sulphide-rock mineralization. Soil at site III is a Turbi-Histic Cryosol, formerly affected by penguin guano, being located close to the Polish Henryk Arctowski Station. Several works highlight this soil type as the main organic C sinks of Antarctic terrestrial areas (Ugolini Reference Ugolini1972, Simas et al. Reference Simas, Schaefer, Mendonça, Silva, Santana and Ribeiro2007a, Reference Simas, Schaefer, Melo, Albuquerque-Filho, Michel, Pereira, Gomes and Costa2007b).
Location, soil and vegetation type in the studied sites.

Map showing the studied sites located in Peninsula Keller (sites I and II) and in Arctowski (site III), King George Island.

At site I two different communities, one composed of a continuous moss carpet of Sanionia uncinata, and another composed of grass tufts of Deschampsia antarctica, occur side by side. This was considered a reference site to compare CO2 emissions from these two communities in a similar pedogeomorphological setting.
A pure moss carpet of Sanionia uncinata (Hedw.) Loeske covers site II and a continuous stand of Deschampsia antarctica occurs at site III. These sites were used mainly to compare the spatial variability of CO2 emissions.
Measurements of soil CO2 emissions were conducted in March 2009, in the morning at site I and in the afternoon at sites II and III, on days of optimum solar radiation and exposure, with low wind speed. Emissions were measured in a 60-point regularly spaced grid previously installed at each site. The grid size was 3.3 x 1.2 m with a minimum distance of 0.3 m between grid points. At site I, measurements were obtained for 30 points for each of the two vegetation types.
CO2 emissions were measured using a portable LI-8100 analyser (LiCor, EUA) coupled to a dynamic chamber (LI-8100-102), known as survey chamber, having 10 cm diameter placed on PVC soil collars inserted in the soil before the experiment. Occasionally the 10 cm diameter collars were placed in areas with less extensive vegetation with some bare soil, due to the natural heterogeneity of the vegetation. Soil temperature for the 0–10 cm layer was measured in all studied points.
Emission determination at each grid point was based on a single measurement lasting 1.5 min. The measurement of CO2 concentration inside the chamber was performed every three seconds. At the end of each single measurement, an interpolation was computed to calculate the emission value for each point. The whole 60 points grid took around 2 h to measure.
The spatial variability was analysed by using descriptive statistics and the adjustment of the semivariogram models to the soil CO2 emission and soil temperature data. The semivariance was estimated by:

, where:  is the semivariance at a separation distance h, N(h) is the number of the pairs of points separated by h, z(xi) is the property value at point xi and z(xi + h) is the property value in the point xi + h.
The semivariogram graph can have a completely random or a systematic behaviour, which can be described by theoretical models (spherical, Gaussian, exponential, etc.) (Isaaks & Srivatava 1989). In this case, the semi-variance value increases with separation of the points (h distance) until a distance that the sill (C0 + C1) is kept constant. The distance where this stabilization occurs is called range distance (a). The pure nugget effect (C0) is the value where the adjusted theoretical model crosses the y axis.
The model adjusted to the semivariogram was used in order to generate the so-called “kriging map” by interpolation techniques, estimating the studied property at non-sampled places. This is a process that is related to estimations based on the property values of the closest neighbours, and with the knowledge of the adjusted theoretical semivariogram models (Webster & Oliver Reference Webster and Oliver1990).
Only isotropic semivariograms were considered in this study. Experimental semivariograms were adjusted for the following theoretical models:

The cross-validation technique was used to verify the reliability of the mathematical model. This technique consisted of testing the semivariogram model validity by kriging at each sampled location using all neighbouring samples, and then comparing estimates with observed values. The model chosen was the one that adjusted the observed and estimated values closer, i.e. the one that produced a linear regression equation between the observed and estimated values that was closer to the bisectrix (Isaaks & Srivastava Reference Isaaks and Srivastava1989). In general, results showed a mean error close to zero indicating no systematic bias, and an average ratio between the square error of prediction and the estimation variance close to the unity, showing a good fit of the semivariogram model to the dataset. After having generated all the semivariogram models, values for each soil variable at the observation points were used for prediction values at unknown points using the ordinary kriging interpolation method.
Descriptive statistics of CO2 emissions as well as graph elaborations were obtained using the Origin 6.0 software (OriginLab, Inc, Northampton, MA, USA). Spatial variability models were derived using GS+ software (Gamma Design Software, LLC, Plainwell, MI, USA, 1998) and kriging maps obtained with Surfer software (Golden Software Inc, Golden, CO, USA, 1995).
Results and discussion
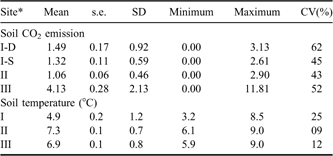
At reference site I, mean soil CO2 emission was higher for Deschampsia (1.49 μmol m-2s-1, CV = 61.6%) than for Sanionia (1.32 μmol m-2s-1, CV = 45.04%), but did not differ according to Student’s t-test (P = 0.39). The mean temperature for the whole site was 4.9°C (Table II). This result indicates that at the same soil, geomorphological and climatic conditions, soils with Deschampsia antarctica emit similar amounts of CO2 to those with Sanionia uncinata. This is in disagreement with other studies which report that photosynthesis of Deschampsia is better adapted than Sanionia uncianata to the levels of solar irradiance and UV radiation typical of Antarctica (Montiel et al. Reference Montiel, Smith and Keiller1999).
Descriptive statistics of soil CO2 emission (μmol m-2 s-1) and soil temperature (°C) in the studied sites.

* I-D = Deschampsia antarctica, I-S = Sanionia uncinata (n= 30), for the rest n = 60, s.e. = standard error, SD = standard deviation, CV = coefficient of variation.
When comparing mean emissions between Sanionia uncinata at sites I and II, the latter presented a lower mean value (1.06 μmol m-2 s-1, Student’s t-test, P< 0.01) (Table II). Both sites are on acid-sulphate soils, with similar chemical and mineralogical characteristics, described in detail by Simas et al. (Reference Simas, Schaefer, Melo, Guerra, Saunders and Gilkes2006, Reference Simas, Schaefer, Melo, Albuquerque-Filho, Michel, Pereira, Gomes and Costa2007a). Therefore, site-specific conditions, which were not evaluated in the present study, such as soil water content, slope and aspect, which may affect photosynthesis of plants and the activity of soil microorganisms, may explain this difference. Also, the different periods of the day in which measurements were made (morning at site I and afternoon at site II) might have influenced the results. It is noteworthy that site II had a higher mean temperature (7.3°C) than site I (4.9°C), but lower mean CO2 emission (Table II), suggesting that soil temperature is not the main factor controlling these emissions.
A much higher difference was obtained when comparing CO2 emissions from Deschampsia at sites I and III. At the latter, the mean emission value was almost three times higher than at site I (Student’s t-test, P < 0.01) (Table II). We attribute this large difference mainly to contrasting soil characteristics between the sites. At site III, Deschampsia grows on a thick histic epipedon in an environment strongly influenced by a penguin rookery situated upslope. Soil water enriched in P and nitrogen which drain from the penguin rookery interact with the underlying soil resulting in the phosphatization of the mineral substrate, enhancing vegetation development (Simas et al. Reference Simas, Schaefer, Mendonça, Silva, Santana and Ribeiro2007a, Reference Simas, Schaefer, Melo, Albuquerque-Filho, Michel, Pereira, Gomes and Costa2007b).
Although we have not measured autotrophic and heterotrophic respiration separately, the enhanced nutrient levels at site III are expected to favour both plant photosynthesis rates and microbial mineralization of soil organic matter, when compared to site I. Photosynthesis supplies organic substances that are respired by roots and microorganisms and therefore should be considered as one of the main drivers of carbon fluxes (Kuzyakov & Gavrichkova Reference Kuzyakov and Gavrichkova2010).
When comparing sites II and III, the latter emitted on average almost four times more CO2 than site II (Table II). This large difference is also attributed to the specific soil characteristics at site III, which favour emission mechanisms.
Site III presented the highest emission, but not the highest mean temperature (Table II). This indicates that despite the fact that temperature is known as an important factor in predicting the temporal variability of Antarctic soil CO2 emission (Hopkins et al. Reference Hopkins, Sparrow, Elberling, Gregorich, Novis, Greenfield and Tilston2006, Park & Day Reference Park and Day2007), it does not explain the spatial variability, at least at vegetated sites.
The emissions for sites I, II and, especially, site III can be considered high, being comparable to those registered in a similar study with soils affected by seabirds and seals on sub-Antarctic Marion Island (Smith Reference Smith2005). These values are much higher than those reported for soils from the Dry Valleys of Antarctica (Ball et al. Reference Ball, Virginia, Barrett, Parsons and Wall2009) and Arctic tundra ecosystems (Lloyd Reference Lloyd2001, Oberbauer et al. Reference Oberbauer, Tweedie, Welker, Fahnestock, Henry, Webber, Hollister, Walker, Kuchy, Elmore and Starr2007). The carbon-rich Histic Cryosol under Deschampsia (site III) showed the highest maximum emission (11.81 μmol m-2 s-1). Minimum emissions, close to zero, were registered at some points, for all studied sites (Table II). These low emissions were usually from grid points with less dense vegetation, emphasizing the direct effect of vegetation to CO2 emission, mostly due to plant roots respiration, as observed by Welker et al. (Reference Welker, Fahnestock and Jones2000) in the Arctic tundra.
The large difference between maximum and minimum emissions results in high coefficients of variation (CV) values, which is typical of soil CO2 emission patterns. High variability of soil CO2 emission was observed by Fang et al. (Reference Fang, Moncrieff, Gholz and Clark1998) and Rayment & Jarvis (Reference Rayment and Jarvis2000), who reported CV values ranging from 55 to 87%, justifying the use of geostatistics to model spatial dependence of CO2 emissions.
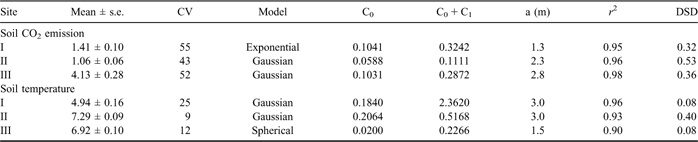
Before geostatistics analysis was conducted a logarithmic transform was applied to the soil CO2 emission data, making it possible to adjust the semivariogram models to the experimental semivariograms. The semivariogram parameters adjusted to soil CO2 emission and soil temperature in all sites are presented in Table III. Care must be taken with interpretation of site I because calculations were made using 30 point of each vegetation type and therefore do not represent the behaviour of a specific community but a mixture of the two different organisms.
Mean ± standard error (s.e.), Coefficient of Variation (CV), models and semivariogram estimated parameters obtained for the soil CO2 emission (μmol m-2s-1) and soil temperature (°C) for the studied sites.

n = 60, a = range distance, DSD = degree of spatial dependence = C0/(C0 + C1), strong for values smaller than 0.25, moderate when between 0.25 and 0.75, and week above 0.75 (Cambardella et al. Reference Cambardella, Moorman, Novak, Parkin, Karlen, Turco and Konopka1994).
Fitted models were Gaussian for emission at sites II and III and exponential in site I (Table III or graphs in Figs 2–4). All the adjusted models had high determination coefficients (r 2 > 0.90). Most of the spatial variability models observed for soil CO2 emission have been described by either spherical or exponential models (Dasselaar et al. Reference Dasselaar, Corré, Priemé, Klemedtsson, Weslien, Stein, Klemedtsson and Oenema1998, Stoyan et al. Reference Stoyan, De-Polli, Böhm, Robertson and Paul2000, La Scala et al. Reference La Scala, Marques, Pereira and Corá2000, Ishizuka et al. Reference Ishizuka, Iswandi, Nakajima, Yonemura, Sudo, Tsuruta and Muriyarso2005, Tedeschi et al. Reference Tedeschi, Rey, Manca, Valentini, Jarvis and Borghetti2006, Kosugi et al. Reference Kosugi, Mitani, Ltoh, Noguchi, Tani, Matsuo, Takanashi, Ohkubo and Nik2007, Ohashi & Gyokusen Reference Ohashi and Gyokusen2007, Konda et al. Reference Konda, Ohta, Ishizuka, Aria, Ansori, Tanaka and Hardjono2008). On the other hand, according to Isaaks & Srivastava (Reference Isaaks and Srivastava1989) Gaussian and spherical models can best describe phenomena having high continuity, without large changes at local scale, while exponential models best adjust to more erratic data.
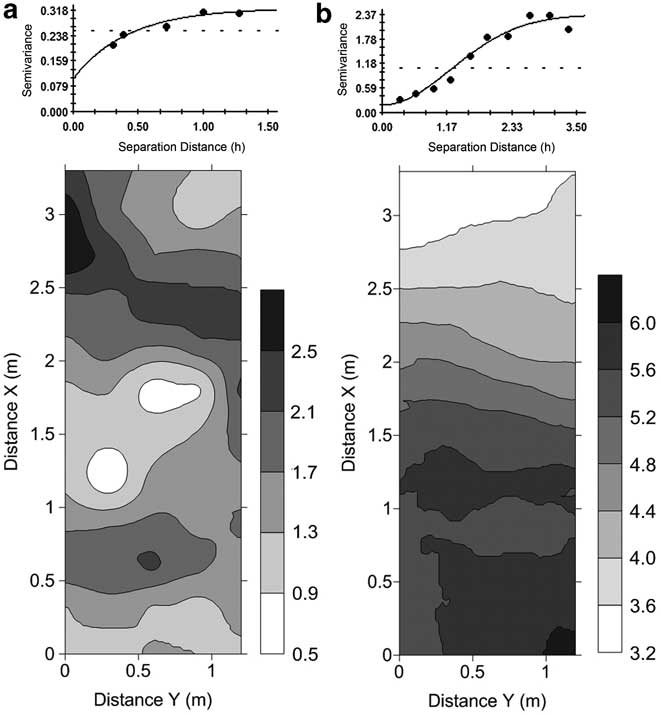
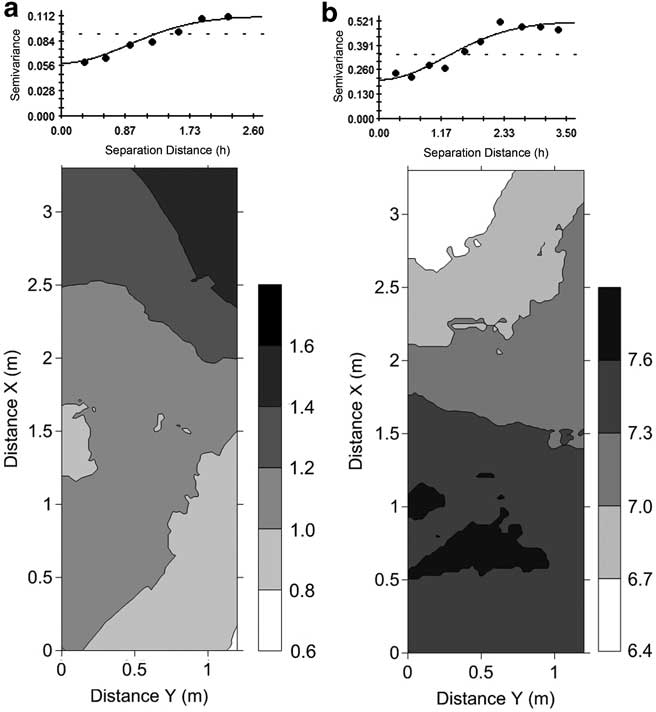
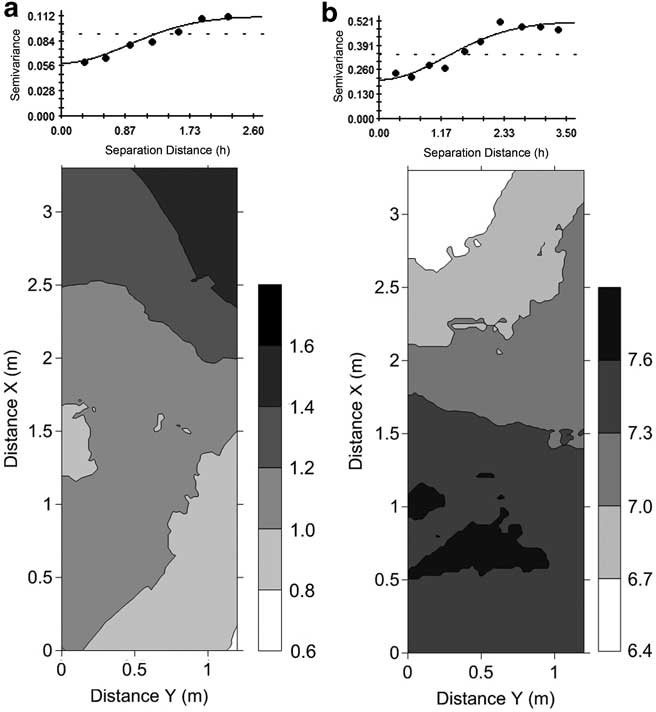
Semivariance as function of distance and kriging maps of soil CO2 emission (μmol m-2 s-1), and b. soil temperature (°C) in site I.
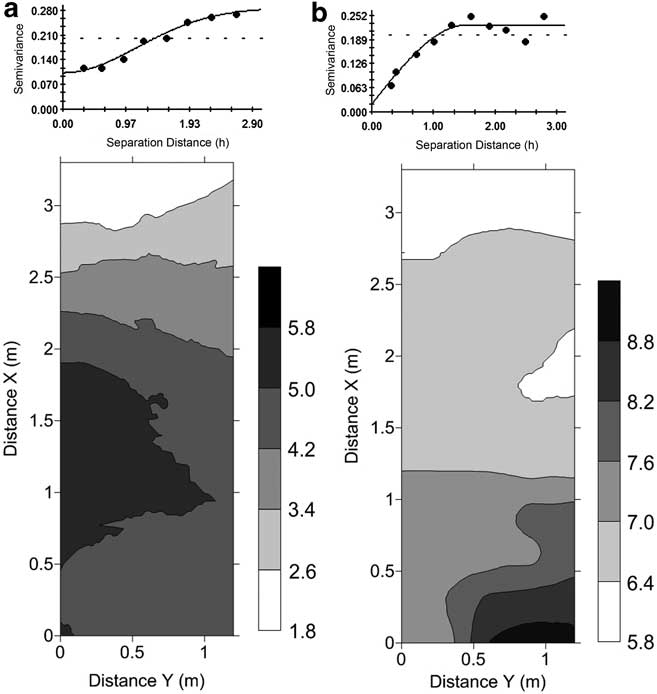
Semivariance as function of distance and kriging maps of soil CO2 emission (μmol m-2 s-1), and b. soil temperature (°C) in site II.
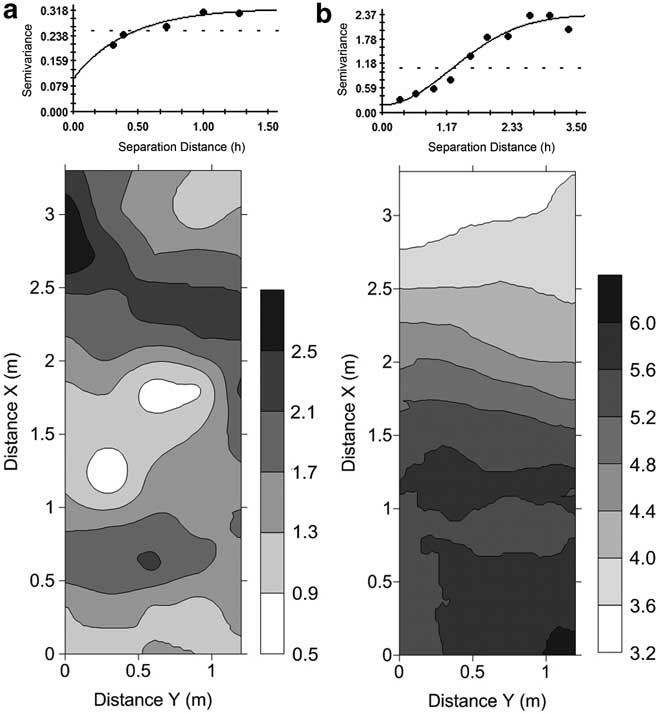
Semivariance as function of distance and kriging maps of soil CO2 emission (μmol m-2 s-1), and b. soil temperature (°C) in site III.
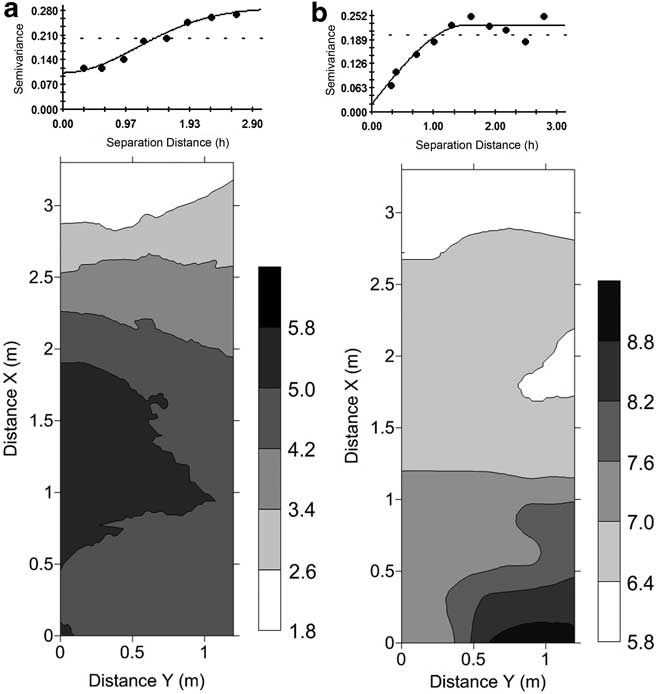
The local scale of the spatial variability is represented by C0 parameter that was similar for all sites, with a slightly lower value for site II. The spatial variability structure, expressed by the C1 parameter, indicates similar values for all studied sites, with site II again having a slightly lower trend. The most used parameter in this case is the so-called degree of spatial dependence (DSD, Table III) expressed by C0/C0 + C1 ratio (Cambardella et al. Reference Cambardella, Moorman, Novak, Parkin, Karlen, Turco and Konopka1994). In the present work, the DSD was moderate (0.25 < DSD < 0.75) for emissions in all the studied sites. Similar studies have presented DSD for soil CO2 emission, varying mostly from weak to moderate (La Scala et al. Reference La Scala, Marques, Pereira and Corá2000, Stoyan et al. Reference Stoyan, De-Polli, Böhm, Robertson and Paul2000, Ishizuka et al. Reference Ishizuka, Iswandi, Nakajima, Yonemura, Sudo, Tsuruta and Muriyarso2005), but DSD has been shown to vary seasonally or even with the grid size (working scale) (Ohashi & Gyokusen Reference Ohashi and Gyokusen2007, Kosugi et al. Reference Kosugi, Mitani, Ltoh, Noguchi, Tani, Matsuo, Takanashi, Ohkubo and Nik2007, Konda et al. Reference Konda, Ohta, Ishizuka, Aria, Ansori, Tanaka and Hardjono2008). With regard to temperature, the DSD was strong (DSD < 0.25) for sites I and III and moderate in site II.
Range value is an important aspect in the spatial variability model as it indicates the spatial dependence among neighbour’s points. CO2 emission ranges were 1.3, 2.2 and 2.8 m for sites I, II, III, respectively. According to Trangmar et al. (Reference Trangmar, Yost and Uehara1985) range values can tell us about the heterogeneity of data when considering its spatial distribution in a grid. Higher range values observed in site II and III suggest higher homogeneity of emission values, implying that more points would be necessary at site I to have an appropriate emission measurement. This was expected since site I data represents two different vegetation covers. Deschampsia antarctica had an overall higher mean emission (1.49 μmol m-2 s-1) compared with remaining points under mosses (1.32 μmol m-2 s-1). This feature is consistent with the CO2 emission map (Fig. 2a), illustrating higher emission rates on Deschampsia antarctica.
Soil temperature ranged from 1.5°C in site III to 3°C in sites I and II, suggesting there is no coupling with the spatial variability structure (models and ranges) of soil CO2 emission. This is consistent with fact that soil temperature has little direct effect on the spatial variability of soil CO2 emission at each site. This can also be observed by relating CO2 emission to temperature in each site: when the 60 point measurements are linearly related, no significant result is found (P > 0.10).
Kriging maps of soil CO2 emission and soil temperature at each site are presented in Figs 2–4, together with the semivariograms and adjusted models. There is clearly more continuity of isolines for emission maps from sites II and III, compared to site I. This can also be observed in soil temperature maps, suggesting that vegetation cover may also control the continuity or discontinuity of both properties in space. Therefore distribution of soil CO2 emission and soil temperature did not appear to be related to soil type, but was associated with the vegetation distribution at each site.
Conclusions
1. In the present study, organic-rich soils with high nutrient availability covered with Deschampsia were the main sources of CO2 emission from the terrestrial ecosystem back to the atmosphere. Apart from being the major organic C sinks in Antarctic terrestrial ecosystems, soils influenced by penguin manure, once colonized with Deschampsia, are potentially the highest terrestrial C source to the atmosphere.
2. Our data also suggests that under similar soil and climate conditions, Deschampsia antarctica communities emit similar amounts of CO2 when compared to Sanionia uncinata carpets. Further studies are necessary to validate this on a broader scale.
3. Spatial variability models derived for soil CO2 emission indicate smaller ranges (1.3 m) for moss carpets. Soil temperature did not appear to be related to the spatial variability of CO2 emission. On the other hand, the vegetation distribution was clearly associated with this variability.
Acknowledgements
We acknowledge CNPq (Conselho Nacional de Desenvolvimento Científico e Tecnológico) and FAPESP (Fundação de Amparo a Pesquisa do Estado de São Paulo), Brazil, for financial support. This work is a contribution of INCT-Criosfera TERRANTAR group.