Implications
In this study, net portal release of dietary and intestinal available amino acids (AA) varied with dry matter intake (DMI). However, the pattern of variation was not uniform among AA and across treatments and did not follow the same pattern of change in DMI. This may be because of the impact of other factors such as the nature and amount of available substrates (AA and energy) in the gut as well as the AA/energy balance across treatments. These factors should be taken into account when building predictive models for portal absorption of AA in ruminants.
Introduction
It is well recognized that the portal-drained visceral (PDV) tissues metabolism greatly modify the pattern and quantity of amino acids (AA) available to peripheral tissues in relation to those that absorbed from or infused into the small intestine of ruminants (Tagari and Bergman, Reference Tagari and Bergman1978; MacRae et al., Reference MacRae, Bruce, Brown and Calder1997a and Reference MacRae, Bruce, Brown, Farningham and Franklin1997b; Berthiaume et al., Reference Berthiaume, Dubreuil, Stevenson, McBride and Lapierre2001). These modifications probably reflect a significant net uptake of dietary and arterial AA by the PDV tissues before reaching the peripheral tissues. However, net uptake by the PDV tissues is not constant for all AA (Lobley et al., Reference Lobley, Shen, Le, Bremner, Milne, Calder, Anderson and Dennison2003), rather it appears to vary with intestinal protein or AA supply (El-Kadi et al., Reference El-Kadi, Sunny, Oba, Owens and Bequette2004), energy needs of the gut (Reeds et al., Reference Reeds, Burrin, Stoll and Jahoor2000) and feed intake level (Lapierre et al., Reference Lapierre, Bernier, Dubreuil, Reynolds, Farmer, Ouellet and Lobley2000).
Increased feed intake level has been shown to increase net portal appearance (NPA) of AA (Lapierre et al., Reference Lapierre, Bernier, Dubreuil, Reynolds, Farmer, Ouellet and Lobley2000). However, most experiments have been carried out at levels of intake higher than maintenance using two levels of intake of the same diet (MacRae et al., Reference MacRae, Bruce, Brown and Calder1997a and Reference MacRae, Bruce, Brown, Farningham and Franklin1997b). In studies where more than two levels of intake were used, feeding has been limited to mixed high-concentrate diets (Lapierre et al., Reference Lapierre, Bernier, Dubreuil, Reynolds, Farmer, Ouellet and Lobley2000). To develop rational feeding standard for ruminants, it is necessary to evaluate various feeds with net flux of nitrogen (N) metabolites with more considering the effect of low levels of intake and protein/energy misbalance on NPA of dietary and intestinal available AA. Thus, the aim of this study was to evaluate the NPA of dietary AA when feed intake differ and to assess how this difference in feed intake affect the portal recovery rate of abomasally infused AA in mature sheep fed lucerne hay cubes. We assume that varying feed intake will alter the NPA and recovery of dietary and infused AA, respectively.
Material and methods
Animals and treatments
Surgical procedures and dietary regimens have been described (EL-Sabagh et al., Reference EL-Sabagh, Goto, Sugino, Obitsu and Taniguchi2013). Briefly, four Suffolk mature sheep (61.4 ± 3.6 kg BW, 4.1 ± 1.9 years old) were surgically fitted with abomasal cannulae and catheters in the hepatic portal vein, mesenteric vein and caudal aorta. Sheep were fed, in a replicated 4 × 4 Latin square design, four equally spaced levels of lucerne hay cubes (8.82 MJ metabolizable energy (ME)/kg of dry matter (DM), 19.0% CP and 40.6% NDF), ranging from 0.4 to 1.6 fold the ME requirements for maintenance according to the Agricultural and Food Research Council (AFRC, 1993). The diets also supplied 0.75, 1.43, 2.11 and 2.88 of metabolizable protein (MP) for maintenance (AFRC, 1993). Feed was delivered in 12 equal portions at 2-h intervals from an automatic feeder to ensure a near steady state for nutrient flux necessary to simplify the study of AA metabolism. Each of the four experimental periods lasted 17 days: 7 days for diet adaptation, 5 days for determination of digestibility, N balance and nutrient net flux under basal pre-infusion conditions, and a final 5 days for measurement of nutrient net flux under abomasal infusion of an AA mixture.
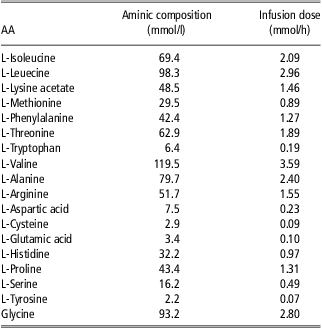
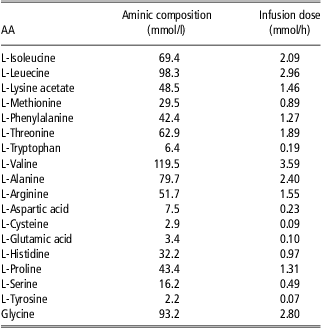
The AA infusate (AAI: Aminic; Ajinomoto pharma Co, Ltd, Japan) composition and daily infusion dose are shown in Table 1. The daily infusion dose of AA (584 mmol AA, equivalent to 11 g N/day) was calculated to cover the N requirements for maintenance (AFRC, 1993) to assess the effect of dry matter intake (DMI) on the recovery rate of AA available in the small intestine when MP/ME balance is different across treatments. The final MP supply relative to maintenance requirements was 1.75, 2.42, 3.11 and 3.87 at 0.4, 0.8, 1.2 and 1.6 M, respectively. In addition, the AAI provided 1.63 MJ ME/day (18% of ME requirements for maintenance). The AAI lasted for 5 days at a rate of 0.5 ml/min and the daily infusions were given over 23 to 24 h using multichannel peristaltic pumps. A new infusion began at 0800 each day.
Aminic composition and infusion dose
Sample collection and analyses
Nitrogen balance
Feed and feces sampling and analysis for DM, organic matter (OM) and NDF have been described previously (EL-Sabagh et al., Reference EL-Sabagh, Goto, Sugino, Obitsu and Taniguchi2013). Urine was collected into plastic collection vessels containing 100 ml of 10 N H2SO4 to inhibit ammonia volatilization. A 10% aliquot of the daily urinary output was composited within animal and period, and frozen at −20°C for later laboratory analysis. Feed, feces and urine were analyzed for Kjeldahl N according to the Association of Official Analytical Chemists (AOAC, 1990). Urine was analyzed for urinary urea-N (Ceriotti, Reference Ceriotti1971).
Nutrient net flux
Blood flow across the PDV was determined using p-amino-hippuric acid (PAH; 4%, wt/vol; pH 7.4; Katz and Bergman, Reference Katz and Bergman1969) infused continuously (0.6 ml/min) through a sterile 45-μm filter into the mesenteric vein catheter following a prime injection (15 ml). PAH infusion began 1 h before blood sampling. Six sets of heparinized blood samples (10 ml) were simultaneously taken at 30-min intervals from the arterial and venous catheters on the last day of both basal and infusion phases. Ammonia-N was determined in whole blood by the phenol-hypochlorite method (Okuda et al., Reference Okuda, Fujii and Kawashima1965) whereas plasma were assayed for urea-N by the diacetyl monoxime-antipyrine method (Ceriotti, Reference Ceriotti1971), PAH using standards prepared from infusion solutions without the deacetylation step (Harvey and Brothers, Reference Harvey and Brothers1962) and individual AA by ion-exchange chromatography (Hamilton, Reference Hamilton1963) using an amino acid analyzer (JLC-500, JEOL, Tokyo).
Calculations
Blood (or plasma) flow (l/h) and nutrient net flux (mmol/h) across the PDV were calculated as described by Katz and Bergman (Reference Katz and Bergman1969). Nutrient net flux across the PDV was calculated using the following equation: PDV flux = PPF (C p – C a), where PPF is portal plasma flow (l/h), and C a and C p are nutrient concentrations in arterial and portal plasma, respectively. Intra-abomasally AAI was assumed to be completely disappeared from the small intestine. The portal recovery of AAI was calculated for each sheep as the NPA of AA under infusion condition corrected for baseline. The baseline was defined as the NPA of AA under basal, pre-infusion condition.
Statistical analysis
Data were analyzed using the GLM procedure of SAS (SAS, 2000) according to a 4 × 4 Latin square design with treatment, period and sheep as the main factors. Statistical analysis for data with and without AAI was conducted separately. Treatments means were compared with orthogonal contrasts. Differences were considered significant when P < 0.05 and tendencies are discussed when P < 0.1.
Results
Diet digestibility and N balance
Diet digestibility has been described in detail (EL-Sabagh et al., Reference EL-Sabagh, Goto, Sugino, Obitsu and Taniguchi2013).
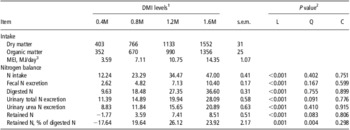
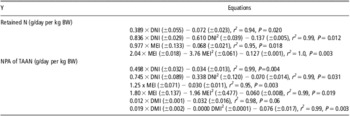
Increasing DMI level induced linear increases in fecal and urinary N losses and N retention along with a quadratic effect of DMI on urinary total N and N balance (Table 2). N balance was negative at 0.4 M and increased linearly (P < 0.001) with increasing DMI. The proportion of retained N to digestible N (DN) increased from 0.8 M (19.6%) to 1.2 M (26.9%) and then decreased at 1.6 M (23.9%; Table 2). Retained N (g/day per kg BW) was linearly and quadratically linked to both DN (g/day per kg BW) and metabolizable energy intake (MEI) (MJ/day per kg BW), respectively (Table 6).
Nutrient intake and nitrogen balance (g/day) in mature sheep fed lucerne hay cubes at four levels of DMI

DMI = dry matter intake; s.e.m. = standard error of means; MEI = metabolizable energy intake; N = nitrogen.
1Multiple of metabolizable energy (MEm) requirement (AFRC, 1993).
2L = linear effect; Q = quadratic effect; C = cubic effect.
3MEI was estimated by 0.0157 times digestible organic matter intake (AFRC, 1993).
Nutrient net flux
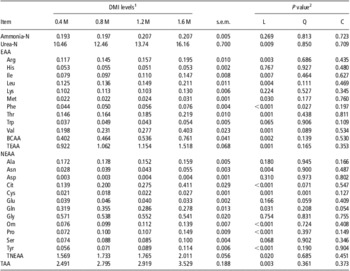
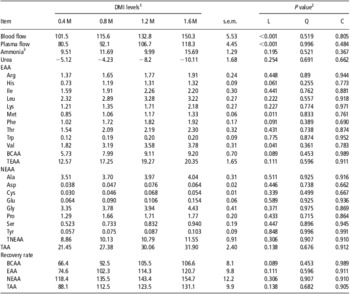
Arterial plasma concentrations of urea-N and total AA (TAA), essential AA (EAA), non-essential AA (NEAA) and branched-chain AA (BCAA) increased linearly (P < 0.05), while arterial blood concentrations of ammonia-N was not affected by increasing DMI (Table 3). Taken individually, increasing DMI linearly increased (P < 0.05) arterial Arg, Ile, Leu, Met, Phe, Thr and Val, tended to increase Trp (P < 0.1), but did not affect His and Lys concentrations. Both linear and quadratic responses were significant for Phe and Val. Arterial concentrations of Glu and Gln increased from 0.4 to 0.8 M and then decreased from 0.8 to 1.6 M.
Arterial concentrations of ammonia-N, urea-N and amino acids (mmol/l) in mature sheep fed lucerne hay cubes at four levels of DMI

DMI = dry matter intake; s.e.m. = standard error of means; EAA = essential amino acids; BCAA = branched-chain amino acids; NEAA = non-essential amino acids; TAA = total amino acids.
1Multiple of metabolizable energy (MEm) requirement (AFRC, 1993).
2L = linear effect; Q = quadratic effect; C = cubic effect.
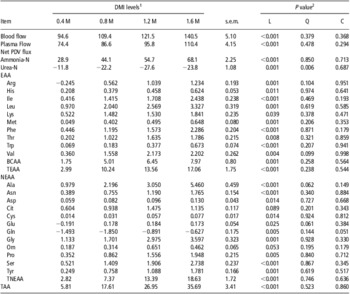
Blood and plasma flows with the basal diet are presented in detail in the companion paper (EL-Sabagh et al., Reference EL-Sabagh, Goto, Sugino, Obitsu and Taniguchi2013). Blood and plasma flows of the portal vein increased linearly (P < 0.05) with increasing DMI of the basal diet (Table 4). With AAI, blood flows followed the same trend as with basal diet (Table 5).
Blood and plasma flows (l/h) and net portal-drained visceral flux of ammonia-N, urea-N and amino acids (mmol/h) in mature sheep fed lucerne hay cubes at four levels of DMI

DMI = dry matter intake; s.e.m. = standard error of means; PDV = portal-drained viscera; EAA = essential amino acids; BCAA = branched-chain amino acids; NEAA = non-essential amino acids; TAA = total amino acids.
1Multiple of metabolizable energy (MEm) requirement (AFRC, 1993).
2L = linear effect; Q = quadratic effect; C = cubic effect.
Blood and plasma flows (l/h) and net portal recovery (mmol/h) of infused AA (AAI-basal) in mature sheep fed lucerne hay cubes at four levels of DMI and abomasally infused with an amino acid mixture

AA = amino acids; AAI = AA infusate; DMI = dry matter intake; s.e.m. = standard error of means; EAA = essential amino acids; BCAA = branched-chain amino acids; NEAA = non-essential amino acids; TAA = total amino acids.
1Multiple of metabolizable energy (MEm) requirement (AFRC, 1993).
2L = linear effect; Q = quadratic effect; C = cubic effect.
3Ammonia and urea calculated as the AAI-basal phase difference.
NPA of ammonia-N, TAA, EAA, NEAA and BCAA increased linearly (P < 0.05), whereas net PDV uptake of urea-N showed quadratic responses with increasing DMI of the basal diet (Table 4). NPA of each AA, except for citrulline and ornithine, also linearly increased (P < 0.05) with increased DMI.
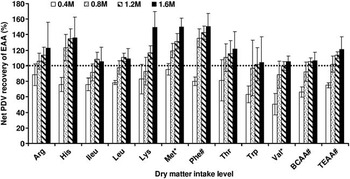
With AAI, the net recovery ratio showed great variations between treatments and across individual AA (Table 5; Figure 1). Across the EAA, the net recovery ratios (calculated as average across treatments) were higher for Phe (1.27), Met (1.24) and His (1.17); intermediate for Lys (1.10), Arg (1.08) and Thr (1.07) and lower for Leu (0.99), Ile (0.95), Trp (0.92) and Val (0.86). In case of the NEAA, net recovery ratios increased with increasing DMI and were higher for Ala (1.59), Ser (1.56) and Gly (1.38); intermediate for Pro (1.23), Tyr (1.21) and Glu (1.01) and lower for Asp (0.25) and Cys (0.57).
Net portal-drained viscera (PDV) recovery of essential amino acids (EAA) infused into the abomasum of mature sheep fed lucerne hay cubes at four levels of dry matter intake ( 0.4, 0.8, 1.2 and 1.6 M = 0.4, 0.8, 1.2 and 1.6 times the maintenance energy requirements, respectively). Data are expressed as means ± s.e.m. #P < 0.10 (linear effect), *P < 0.05 (linear effect).

Discussion
In this study, the response of N metabolites net flux by the PDV in mature sheep supplied with wide-ranged DMI from lucerne hay cubes was investigated. Lucerne hay cubes used in this study created an MP/ME imbalance and this imbalance was further enlarged by AAI (adequate MP intake for below maintenance energy level). This design was relevant to test our hypothesis (i.e. the NPA of AA does not occur at a uniform rate with changes in DMI) for the following reasons. Firstly, a high ruminal N excess would permit a base for a high digestible protein to clearly define the proportion of the infused protein that would be recovered into portal blood. In addition, we could not find any literatures on adequate MP intake for below maintenance energy level. Finally, other studies with a small increase in MP with different dietary protein sources failed to detect the increase in NPA of AA by PDV.
N balance
Obtained results for N balance in this study implies that there was an increase in the efficiency of N use in response to increasing DMI probably because of increased N and energy supply with subsequent increase in the amount of N digested. The efficiency increased from 0.4 to 1.2 M till the energy became limiting at 1.6 M as indicated by the increased urinary urea-N excretion at 1.6 M. Alternatively, the increased urinary urea-N excretion at 1.6 M may result from AA catabolism because of physiological limitation for protein deposition by mature sheep used in this experiment, or from restricted AA uptake by peripheral tissues because of limited available energy (Harris et al., Reference Harris, Skene, Buchan, Milne, Calder, Anderson, Connell and Lobley1992). The negative N balance at the 0.4 M diet may reflect AA catabolism by body tissues together with lowered microbial protein synthesis because of limited energy supply. Energy supply determines the protein turnover rate in ruminants by decreasing protein degradation and, subsequently, increasing protein deposition (Asplund, Reference Asplund1994). Decreased N retention was previously observed after the reduction of level of feed intake (Lapierre et al., Reference Lapierre, Bernier, Dubreuil, Reynolds, Farmer, Ouellet and Lobley2000) or of energy intake only (Kraft et al., Reference Kraft, Gruffat, Dardevet, Rémond, Ortigues-Marty and Savary-Auzeloux2009). As retained N was linearly and quadratically linked to both DN and MEI in this study, the variations in the efficiency of N utilization between treatments may be related to the nature and quantity of the substrates (AA and energy) available in the gut.
Nutrient net flux with basal diet
Ammonia-N and urea-N
In this study, relative to DN, both ammonia-N release and urea-N uptake by the PDV decreased linearly (P < 0.05) with increasing DMI representing 101%, 80%, 68% and 62%; and 42%, 40%, 34% and 22% of DN at 0.4, 0.8, 1.2 and 1.6 M, respectively. The decrease in portal net release of ammonia-N with increasing DMI may relate to a decreased rumen ammonia-N concentration because of the increase in energy available for microbes. In relative term, the reduced urea-N recycling with increasing DMI may be because of increasing urea-N recycling through saliva. Salivary secretion increases with the physically effective fiber content of the diet (Huntington, Reference Huntington1989). The relative decrease of PDV urea-N removal at 1.6 M is in accordance to the large increase of urinary urea-N excretion.
Amino acids
Different responses in arterial AA concentrations in this study may be related to the differential AA removal by the splanchnic tissues and peripheral use. The extent of AA removal by the splanchnic tissues has been shown to vary with level of feed intake (Savary-Auzeloux et al., Reference Savary-Auzeloux, Hoskin and Lobley2003).
The increased NPA of AA observed with increasing DMI in this study is consistent with previous reports in cattle (Huntington et al., Reference Huntington, Varga, Glenn and Waldo1988; Lapierre et al., Reference Lapierre, Bernier, Dubreuil, Reynolds, Farmer, Ouellet and Lobley2000) and sheep (Nozière et al., Reference Nozière, Rémond, Bernard and Doreau2000; Hoskin et al., Reference Hoskin, Savary, Zuur and Lobley2001) and may reflect increased intestinal absorption of AA as a result of increased duodenal flow of dietary, microbial and endogenous AA because of increased available energy (Guerino et al., Reference Guerino, Huntington and Erdman1991; Taniguchi et al., Reference Taniguchi, Huntington and Glenn1995). Clark et al. (Reference Clark, Klusmeyer and Cameron1992) showed that faster rate of passage of feed residues and the microbes out of the rumen at higher intakes resulted in a higher duodenal flow of dietary protein and non-ammonia nitrogen and an increase in microbial protein synthesis. However, the NPA of TAA-N was not proportional to DMI (difference was 5.50 g/day between 0.4 and 0.8 M; 4.68 g/day between 0.8 and 1.2 M and 3.46 g/day between 1.2 and 1.6M). In addition, regression analysis (Table 6) revealed a linear and quadratic response between NPA of TAA-N (g/day per kg BW) and both of MEI (MJ/day per kg BW) and DN (g/day per kg BW) indicating a possible variations between treatments in the AA profile of MP entering the duodenum. This also may imply a non-constant uptake of AA by gut tissues with different energy intake levels probably because of the higher MP/ME ratio supplied by lucerne hay cubes. As a percentage of DN, the NPA of TAA-N showed linear (P < 0.05) and curvilinear (P < 0.1) responses to the increased DMI representing 23%, 40%, 45% and 43% of DN at 0.4, 0.8, 1.2 and 1.6 M, respectively. The curvilinear response of AA flux across the PDV was because of the dramatic decrease at 0.4 M diet. The lower recovery of DN as TAA-N at 0.4 M may imply either a lower microbial protein synthesis relative to available N or an increased AA catabolism by the intestinal tissues because of low available energy. When diets are generally not deficient in rumen-degradable N, rumen ammonia capture by microorganisms and microbial protein synthesis would depend primarily on MEI. This can be confirmed in this study by the marked release of ammonia-N relative to TAA-N and the greater PDV uptake of Glu and Gln at 0.4 M diet. Glu and Gln are the major oxidative substrates for the small intestine and are removed by the PDV for energetic purposes (Nozière et al., Reference Nozière, Rémond, Bernard and Doreau2000; Reeds et al., Reference Reeds, Burrin, Stoll and Jahoor2000; Rémond et al., Reference Rémond, Bernard, Chauveau, Nozière and Poncet2003). However, in the current study, Glu flux was positive from 0.4 to 1.6 M, and Gln uptake was decreased with increased DMI suggesting an energy-sparing effect on AA metabolism.
Prediction equations of retained N and NPA of TAAN in response to intake

NPA = net portal appearance; TAAN = total amino acid nitrogen; DNI = digestible nitrogen intake (g/day per kg BW); MEI = metabolizable energy intake (MJ/day per kg BW); DMI = dry matter intake (g/day per kg BW).
Portal recovery of infused AA
An increase of 11 g/day in total MP intake by AAI elevated TAA-N NPA by 9.5, 12.2, 13.4 and 14.3 g/day with the recovery ratio of 87%, 111%, 122% and 131% at 0.4, 0.8, 1.2 and 1.6 M, respectively. Many factors may contribute to the higher PDV recovery of infused AA with higher DMI in this study. One explanation for higher PDV recovery in this study may be partially attributed to a decrease in the absorptive PDV use of AA because of increased available energy substrates. Several reports have demonstrated that greater flow of post-ruminal AA increases the small intestinal OM and starch digestibility (Richards et al., 2002) and increases portal glucose appearance (Taniguchi et al., 1995), and consequently improve AA absorption from the basal diet probably by sparing gut-tissue AA from breakdown. In addition, it was reported that the additional energy supplied by excess AA can improve the absorption of other limiting AA (Schroeder and Titgemeyer, Reference Schroeder and Titgemeyer2008). In our study, the AAI was rich in BCAA, His, Met and Arg compared with microbial protein (Storm and Orskov, Reference Storm and Orskov1983) and provided 1.63 MJ ME/day (18% of ME requirements for maintenance). This energy-sparing effect may be supported by the lower proportion of DN recovered as ammonia-N. With AAI, NPA of ammonia-N represented on average 60% of DN compared with 78% with basal diet. Another factor may be the increased secretion and re-absorption of endogenous proteins (biliary and pancreatic secretions) in response to AA infusion. In addition, AAI may decrease the arterial AA use by the PDV because of increased arterial input of AA. However, the net recovery ratio of infused AA varied among DMI levels and across AA. Across the individual EAA, the net PDV recovery of infused Met and Val increased linearly (P < 0.05) and that of Phe and BCAA tended to increase linearly (P < 0.1) with increasing DMI (Figure 1). The different response of recovery ratio of EAA with DMI may imply different PDV use among these AA because the type of energy substrates including AA used by PDV tissues may alter with energy intake level. At the lowest DMI, there were considerable losses of EAA (25%) with AAI especially for BCAA and His probably because of the relatively higher profile of BCAA and His in AAI compared with that of microbial protein (Storm and Orskov, Reference Storm and Orskov1983). In addition, the lower recovery of Val compared with Leu and Ile may be explained, in part, by the role of Leu in BCAA catabolism through activation of branched-chain ketoacid dehydrogenase (Block and Harper, Reference Block and Harper1984) in addition to its presence in proteins secreted from the gut tissues such as mucins which are poorly reabsorbed by the hindgut and consequently lost in the feces (Mukkur et al., Reference Mukkur, Watson, Saini and Lasdelles1985).
Regarding the NEAA, the low recovery ratio of Asp and Glu is probably because of their PDV use for energetic purposes (Reeds et al., Reference Reeds, Burrin, Stoll and Jahoor2000). The low recovery of Cys in the portal blood is probably related to the great use by the PDV for mucin production (Rémond et al., Reference Rémond, Bernard, Chauveau, Nozière and Poncet2003) and glutathione synthesis (Reeds et al., Reference Reeds, Burrin, Stoll, Jahor, Wykes, Henty and Frazer1997). Regarding the non-infused AA, Gln absorption was increased with AAI, probably because of elevated conversion of other AA by PDV in response to the AA infusion. Overall, increasing the level of DMI induced relative changes in incremental recoveries of infused AA. These results indicate that the assumption of a single PDV recovery ratio of AA across a broad range of energy supply is unlikely to be appropriate.
Conclusion
In summary, increasing DMI increased portal release of AA and enhanced N retention. At 0.4 M intake, there was a marked release of ammonia-N relative to AA across the PDV. PDV urea-N uptake quadratically increased with increasing DMI. The relative decrease of PDV urea-N removal at 1.6 M was in accordance to the large increase of urinary urea-N excretion. The net recovery ratio of infused AA across the PDV increased linearly with increasing DMI accounting for 88%, 112%, 123% and 131% for 0.4, 0.8, 1.2 and 1.6 M, respectively. In addition, across the individual AA, the net recovery ratios of infused Met, Phe and BCAA by the PDV increased with increasing DMI. These results indicated that DMI affects net recovery of AA available in the small intestine of mature sheep. These data may be incorporated into nutritional models for accurately predicting nutrient delivery to post-absorptive tissues, hence predicting animal performance.
Acknowledgment
This study was carried out as a part of the research project (Technical Development of Livestock Production System Based on Domestic Feed) supported by MAFF, Japan.