


Impact Statement
This study addresses a key challenge in ocean forecasting: the ability to produce accurate short-term predictions from sparse satellite observations. By adapting a state-of-the-art deep learning model, 4DVarNet, to a forecasting context, we demonstrate that neural networks can effectively predict global sea surface dynamics over a seven-day horizon, even from incomplete data. Our work contributes to the growing field of machine learning for Earth system science and is integrated into the OceanBench initiative, which aims to standardize and accelerate progress in ocean AI research. The approach has practical implications for operational oceanography, offering a scalable and data-efficient alternative to traditional numerical models, particularly valuable in real-time scenarios with limited observational input.
1. Introduction
The short-term forecasting of the ocean is of key interest for a variety of applications, including among others offshore operations (Le Traon et al., Reference Le Traon, Reppucci, Alvarez Fanjul, Aouf, Behrens, Belmonte, Bentamy, Bertino, Brando, Kreiner, Benkiran, Carval, Ciliberti, Claustre, Clementi, Coppini, Cossarini, De Alfonso Alonso-Muñoyerro, Delamarche, Dibarboure, Dinessen, Drevillon, Drillet, Faugere, Fernández, Fleming, Garcia-Hermosa, Sotillo, Garric, Gasparin, Giordan, Gehlen, Gregoire, Guinehut, Hamon, Harris, Hernandez, Hinkler, Hoyer, Karvonen, Kay, King, Lavergne, Lemieux-Dudon, Lima, Mao, Martin, Masina, Melet, Buongiorno Nardelli, Nolan, Pascual, Pistoia, Palazov, Piolle, Pujol, Pequignet, Peneva, Pérez Gómez, Petit de la Villeon, Pinardi, Pisano, Pouliquen, Reid, Remy, Santoleri, Siddorn, She, Staneva, Stoffelen, Tonani, Vandenbulcke, von Schuckmann, Volpe, Wettre and Zacharioudaki2019), maritime traffic routing (Davidson et al., Reference Davidson, Allen, Brassington, Breivik, Daniel, Kamachi, Sato, King, Lefevre and SuttonMand Kaneko2009), ocean extremes (Hobday et al., Reference Hobday, Alexander, Perkins, Smale, Straub, Oliver, Benthuysen, Burrows, Donat, Feng, Holbrook, Moore, Scannell, Sen Gupta and Wernberg2016) and sampling strategies of scientific surveys. State-of-the-art operational systems rely on data assimilation schemes (Lellouche et al., Reference Lellouche, Greiner, Le Galloudec, Regnier, Benkiran, Testut, Bourdalle-Badie, Drevillon, Garric and Drillet2018) to combine a physical model of the ocean dynamics with different observation sources, usually both in situ and satellite-derived observations. The resulting short-term ocean forecasts typically involve an estimation of the current observation given past available observations. The physical model then propagates the state over the targeted time horizon, typically over a week. Numerous studies support the relevance of the operational ocean forecasting schemes, but also reveal significant uncertainty levels (Lellouche et al., Reference Lellouche, Le Galloudec, Drévillon, Régnier, Greiner, Garric, Ferry, Desportes, Testut, Bricaud, Bourdallé-Badie, Tranchant, Benkiran, Drillet, Daudin and De Nicola2013).
Recently, neural forecasting schemes have emerged as appealing solutions for ocean dynamics, with striking examples for short-term ocean forecasting (Wang et al., Reference Wang, Wang, Hu, Wang, Huo, Wang, Wang, Wang, Zhu and Xu2024; Cui et al., Reference Cui, Wu, Zhang, Zhu, Liu, Shi, Chen, Liu, Zhou, Su, Jing, An and Wu2025; El Aouni et al., Reference El Aouni, Gaudel, Regnier, Van Gennip, Le Galloudec, Drevillon, Drillet and Lellouche2025). These neural schemes involve emulators of the physical model, trained from reanalysis datasets. These schemes now reach state-of-the-art forecasting performance for short-term ocean forecasts and can even outperform data assimilation-based systems for specific case studies and metrics (El Aouni et al., Reference El Aouni, Gaudel, Regnier, Van Gennip, Le Galloudec, Drevillon, Drillet and Lellouche2025). While those neural forecasting schemes emerge, the characteristics of ocean observing systems may however question whether one should also address uncertainties in the estimation of initial state by data assimilation schemes. Satellite-derived observations, such as the sea surface height (SSH) and sea surface temperature (SST), involve large sampling gaps, which prevent data assimilation schemes to recover fine-scale dynamics, typically below one or 200 kilometers for sea surface currents (SSCs) (Ballarotta et al., Reference Ballarotta, Ubelmann, Pujol, Taburet, Fournier, Legeais, Faugère, Delepoulle, Chelton, Dibarboure and Picot2019). The sampling of the interior of the ocean by ARGO floats or moorings is obviously even scarcer. Optimal interpolation (OI) has long been the reference approach to deliver gap-free observation-based products, but end-to-end neural mapping schemes (Beauchamp et al., Reference Beauchamp, Amar, Febvre and Fablet2021; Martin et al., Reference Martin, Manucharyan and Klein2023, Reference Martin, Manucharyan and Klein2024; Febvre et al., Reference Febvre, Le Sommer, Ubelmann and Fablet2024) have shown a great potential to better exploit sparse observation datasets and improve the reconstruction of ocean processes.
This study explores how end-to-end neural schemes could contribute to improved short-term ocean forecasts through the direct exploitation of sparse ocean observation datasets. Following the above-mentioned advances in neural interpolation schemes, we state the short-term forecasting of ocean states as an end-to-end neural mapping problem from gappy observations to targeted ocean forecasts. As demonstration testbed, we focus on SSH forecasts, as SSH is a key signature of global ocean circulation and is associated with sparse satellite altimetry observations (Ducet et al., Reference Ducet, Le Traon and Reverdin2000). Adapting a state-of-the-art neural mapping scheme (Fablet et al., Reference Fablet, Chapron, Drumetz, Mémin, Pannekoucke and Rousseau2021; Febvre et al., Reference Febvre, Le Sommer, Ubelmann and Fablet2024), we do not only adapt the 4DVarNet scheme, but also introduce the state-of-the-art UNet architecture for the forecasting task. Our approach integrates both neural architectures to predict SSH from sparse satellite observations. Numerical experiments, conducted with a one-year real satellite altimetry dataset, demonstrate the potential of these deep learning models to significantly enhance short-term ocean forecasts, compared to the state-of-the-art data assimilation-based methods. We discuss further these findings toward the evolution of neural ocean forecasting approaches.
This article is organized as follows: Section 2 provides a brief introduction to short-term ocean forecasting. We present the proposed deep learning approach in Section 3. Section 3.3 describes the considered dataset and benchmark, and we report our results in Section 4. Section 5 discusses our main findings with respect to the state-of-the-art.
2. Problem statement and related work
Operational forecasting systems for the earth systems rely on data assimilation schemes (Lahoz and Schneider, Reference Lahoz and Schneider2014; Buizza et al., Reference Buizza, Balmaseda, Brown, English, Forbes, Geer, Haiden, Leutbecher, Magnusson, Rodwell, Sleigh, Stockdale, Vitart and Wedi2018). They state the short-term forecasting of a state of interest as a two-step process. The analysis step solves an initial condition problem and the forecasting comes to propagate the initial condition over the targeted forecasting window using the physical dynamical model. Such assimilation-based systems leverage state-of-the-art general circulation models and data assimilation schemes. The GLO12 ocean forecasting system (Lellouche et al., Reference Lellouche, Greiner, Le Galloudec, Regnier, Benkiran, Testut, Bourdalle-Badie, Drevillon, Garric and Drillet2018) falls into this category. It combines the NEMO ocean model (Madec and the NEMO team, Reference Madec2015) with a Kalman assimilation scheme (Brasseur and Verron, Reference Brasseur and Verron2006) to deliver 10-day global forecasts at 1/12° resolution, providing both hourly and daily averages based on different observation datasets (mainly satellite altimetry, satellite-derived SST and ARGO float data). While representative of the state-of-the-art in terms for forecasting performance (Lellouche et al., Reference Lellouche, Le Galloudec, Drévillon, Régnier, Greiner, Garric, Ferry, Desportes, Testut, Bricaud, Bourdallé-Badie, Tranchant, Benkiran, Drillet, Daudin and De Nicola2013), assimilation-based forecasts may involve significant uncertainties especially for time scales below a week and horizontal scales below a few hundreds of kilometers. This may be critical for a variety of applications such as maritime traffic routing (Davidson et al., Reference Davidson, Allen, Brassington, Breivik, Daniel, Kamachi, Sato, King, Lefevre and SuttonMand Kaneko2009; Lellouche et al., Reference Lellouche, Greiner, Ruggiero, Bourdallé-Badie, Testut, Le Galloudec, Benkiran and Garric2023) and the forecasting of ocean BGC dynamics (Fennel et al., Reference Fennel, Mattern, Doney, Bopp, Moore, Wang and Yu2022).
From a methodological point of view, assimilation-based system addresses the forecasting of the entire physical state and does not focus on specific variables of interest. We denote by
$ \mathbf{x} $
 the space-time state of interest, whose evolution is governed by a dynamical operator
$ \mathcal{M} $
 and by
$ \mathbf{y} $
 the observation process, which relates to state
$ \mathbf{x} $
 through an observation operator
$ {\mathcal{H}}_t $
 . This observation operator can be time-dependent to account for irregularly sampled observation data due to the geometry of the observing system (e.g., polar-orbiting earth observation satellites) as well as the impact of atmosphere conditions onto the passive satellite sensing of the ocean surface (e.g., infrared and multispectral satellite sensors). Let
$ {t}^{\ast } $
 denote the current time at which a forecast is provided, distinct from the running time variable
$ t $
 . Forecasting the state
$ \mathbf{x} $
 from time
$ {t}^{\ast } $
 to time
$ {t}^{\ast }+N\cdot \Delta $
 involves two sub-problems:
-
• the estimation of the state $ \hat{\mathbf{x}}\left({t}^{\ast}\right) $
 , often stated as a minimization problem:


with
$ \mathcal{J} $
 the cost function,
$ \mathbf{y}\left({t}_{<}^{\ast}\right) $
 the observation time series available up to time
$ {t}^{\ast } $
 and
$ \mu $
 the set of hyperparameters of the cost function. Variational data assimilation methods (Cummings and Smedstad, Reference Cummings and Smedstad2013) are examples of such schemes.
-
• the iterative application of a time-stepping operator $ {\Phi}_{\mathcal{M},\Delta} $
for dynamical model
$ \mathcal{M} $
and time step
$ \Delta $
from initial condition
$ {\hat{\mathbf{x}}}_0 $
such that:


This formulation makes explicit two main sources of uncertainty in assimilation-based ocean forecasts: uncertainty in the estimate
$ {\hat{\mathbf{x}}}_0 $
 of the initial state from available partial observations and uncertainty associated with the approximation of the true dynamics of state
$ \mathbf{x} $
 by the time-stepping operator
$ {\Phi}_{\mathcal{M},\Delta} $
 . Quantifying these two sources of uncertainty jointly remains challenging, due to the nonlinear growth of initial-condition errors under
$ \mathcal{M} $
 and to the difficulty of characterizing non-Gaussian model and observation errors statistics at the scales relevant to operational forecasting (Lermusiaux et al., Reference Lermusiaux, Chiu, Gawarkiewicz, Abbot, Robinson, Miller, Haley, Leslie, Majumdar, Pang and Lekien2006; Hoteit et al., Reference Hoteit, Chassignet and Bell2025).
A very recent literature has emerged regarding neural short-term forecast for earth system dynamics (Wang et al., Reference Wang, Wang, Hu, Wang, Huo, Wang, Wang, Wang, Zhu and Xu2024; Cui et al., Reference Cui, Wu, Zhang, Zhu, Liu, Shi, Chen, Liu, Zhou, Su, Jing, An and Wu2025; El Aouni et al., Reference El Aouni, Gaudel, Regnier, Van Gennip, Le Galloudec, Drevillon, Drillet and Lellouche2025), neural schemes for short-term weather forecasts being the most impactful examples (Lam et al., Reference Lam, Sanchez-Gonzalez, Willson, Wirnsberger, Fortunato, Alet, Ravuri, Ewalds, Eaton-Rosen, Hu, Merose, Hoyer, Holland, Vinyals, Stott, Pritzel, Mohamed and Battaglia2022; Bi et al., Reference Bi, Xie, Zhang, Chen, Gu and Tian2023). Interestingly, different neural architectures, including purely data-driven schemes (El Aouni et al., Reference El Aouni, Gaudel, Regnier, Van Gennip, Le Galloudec, Drevillon, Drillet and Lellouche2025) and hybrid models using neural correction terms (Liu et al., Reference Liu, Bracco and Brajard2023), have rapidly reached state-of-the-art performance on a global scale compared with model-based forecasts. They typically exploit end-to-end learning strategies from reanalysis datasets and state the short-term forecasting as the prediction of a time series of states over a given time window from a gap-free initial condition. The best neural schemes generalize to real-time forecast configurations to compete or outperform operational systems such as ECMWF IFS schemes (Bi et al., Reference Bi, Xie, Zhang, Chen, Gu and Tian2023). Similar learning strategies have also been explored for short-term ocean forecasts (Xiong et al., Reference Xiong, Xiang, Wu, Zhou, Sun, Ma and Huang2023; Wang et al., Reference Wang, Wang, Hu, Wang, Huo, Wang, Wang, Wang, Zhu and Xu2024) and point to the potential improvement of assimilation-based ocean forecasts. Most neural forecasting schemes exploit autoregressive formulations and can be regarded as replacing the model-based time-stepping operator by a neural time-stepping operator
$ {\Phi}_{NN,\Delta} $
 (where the
$ NN $
 refers to neural-network configuration):

As a consequence, such neural forecasting schemes focus on improving forecasting skill associated with uncertainties in the model-based time-stepping operator
$ {\Phi}_{\mathcal{M},\Delta} $
 , while still relying on a previously estimated initial condition
$ {\hat{\mathbf{x}}}_0 $
 .
Regarding ocean dynamics, the scarcity of the available satellite-derived and in situ observation datasets for the ocean may however call into question the underlying assumption that uncertainties in the estimation of the initial state can be neglected. Whereas OI methods and assimilation-based schemes remain the state-of-the-art operational approaches for most operational oceanography products, numerous studies point out how neural mapping schemes, trained from real observation or simulation-only datasets, could better exploit real gappy datasets for a wide range of missing data rates and patterns, as illustrated among others for satellite altimetry (Beauchamp et al., Reference Beauchamp, Amar, Febvre and Fablet2021; Martin et al., Reference Martin, Manucharyan and Klein2023), ocean color products (Dorffer et al., Reference Dorffer, Jourdin, Nguyen, Devillers, Mouillot and Fablet2025) and SSTs (Barth et al., Reference Barth, Alvera-Azcárate, Licer and Beckers2020). These findings invite to question how they translate to short-term ocean forecasts. Through a case study for satellite altimetry datasets, we explore neural ocean forecasts stated as an end-to-end neural mapping from a series of partial observations to the targeted time series of states in the future (see Figure 1), that is to say trainable neural operators as:

In this study we consider the neural operator
$ \Psi $
 to be based on: (i) the neural data assimilation scheme introduced in (Fablet et al., Reference Fablet, Chapron, Drumetz, Mémin, Pannekoucke and Rousseau2021) or (ii) the state-of-the-art UNet model.
Proposed end-to-end neural scheme for short-term forecasting: input satellite observations are fed to the end-to-end neural architecture providing a full SSH forecasted field.

Unlike the auto-regressive neural operator
$ {\Phi}_{NN,\Delta} $
 of Equation (3), which emulates the physical time-stepping operator from a gap-free initial condition, the operator
$ \Psi $
 introduced here maps the full sequence of past partial observations directly to the future state trajectory in a single end-to-end step, without requiring an explicit initial condition.
In the remainder, we describe those two architectures adapted to the forecast task, as well as the proposed benchmark for the short-term neural forecast of the SSH from satellite altimetry data at the global scale.
3. Proposed approach
3.1. End-to-end neural schemes for short-term forecasting
The forecasting problem is formulated as a nonlinear mapping from observed sparse fields at time
$ t $
 to predicted gap-free fields over the subsequent seven days. Formally:

where
$ {\mathcal{X}}_t $
 denotes the sparse input and
$ {\mathcal{Y}}_{t+1:t+7} $
 the target future sequence.
Inspired by recent advances in the neural mapping of gappy observation fields (Fablet et al., Reference Fablet, Febvre and Chapron2023; Martin et al., Reference Martin, Manucharyan and Klein2023; Febvre et al., Reference Febvre, Le Sommer, Ubelmann and Fablet2024), we address the short-term forecasting problem (2.4) as the end-to-end learning of a neural parameterization of operator
$ \Psi $
 . The underlying statement resorts to considering the short-term forecasting problem as an interpolation problem with observation data available only in the past, that is, before time step
$ {t}^{\ast } $
 . Specifically, in this study, we consider a 14-day temporal window in the past.
Considering that the observation data are provided as gridded fields with missing data, any state-of-the-art image-to-image architectures could potentially apply. Among others, we may cite UNet, Transformer and ConvLTSM architectures (Ronneberger et al., Reference Ronneberger, Fischer and Brox2015; Shi et al., Reference Shi, Chen, Wang, Yeung, Wong and Wc2015; Vaswani, Reference Vaswani, Shazeer, Parmar, Uszkoreit, Jones, Gomez, Kaiser and Polosukhin2017). As ocean observation data usually involve large missing data rates, neural mapping schemes recently explored for the space–time interpolation of the sea level anomaly (SLA) from satellite altimetry data (Fablet et al., Reference Fablet, Febvre and Chapron2023; Martin et al., Reference Martin, Manucharyan and Klein2023) also appear as appealing solutions.
As described above, in this study we leverage (i) the 4DVarNet architecture, originally designed for spatiotemporal interpolation, and (ii) UNet, the state-of-the-art neural architecture widely used in computational imaging, and adapt them to perform sequence-to-sequence forecasting from incomplete SLA observations. We refer the reader to Beauchamp et al. (Reference Beauchamp, Amar, Febvre and Fablet2021) and Fablet et al. (Reference Fablet, Chapron, Drumetz, Mémin, Pannekoucke and Rousseau2021) and to the associated Github page for the details on the 4DVarNet framework. The UNet code used in this study is an implementation of Ronneberger et al. (Reference Ronneberger, Fischer and Brox2015) and is available in this GitHub repository.
3.2. OSSE-based training scheme
Following Febvre et al. (Reference Febvre, Le Sommer, Ubelmann and Fablet2024), we consider a supervised training scheme from simulation data, while we assess the performance of trained model on real ocean observation data. We detail the considered training dataset in Section 3.3. Let us denote by
$ {\left\{{\mathbf{x}}_n^{true},{\mathbf{y}}_n\right\}}_n $
 the training dataset formed by pairs of true state and associated gappy observation data (see Figure 2), with the latter corresponding to real nadir altimeter sampling patterns. For the 4DVarNet neural scheme, the training loss combines the following three elementary losses for each sample index
$ n $
 (while for the UNet it only combines first two):


where
$ {K}_O=14 $
 and
$ {K}_f=7 $
 , respectively, denote the number of past (observed) and future (forecast) daily time steps considered in the loss, consistent with the 14-day observation window and 7-day forecast horizon introduced in Section 3, and
$ {\omega}_k $
 is a weight that increases linearly with
$ k $
 over the observation window (
$ k=-{K}_O,\dots, 0 $
 ), reaching its maximum value at the reference time (
$ k=0 $
 ), and decreases linearly over the forecast window (
$ k=0,\dots, +{K}_f $
 ). The first two losses are MSE losses for state
$ \mathbf{x} $
 and its spatial gradient
$ \nabla \mathbf{x} $
 , whereas the third loss acts as a regularization loss (Fablet et al., Reference Fablet, Chapron, Drumetz, Mémin, Pannekoucke and Rousseau2021). Overall, the training phase amounts to minimizing a weighted sum of these three losses:
$ \mathrm{\mathcal{L}}={\sum}_n{\alpha}_{\mathbf{x}}{\mathrm{\mathcal{L}}}_{\mathbf{x},n}+{\alpha}_{\nabla \mathbf{x}}{\mathrm{\mathcal{L}}}_{\nabla \mathbf{x},n}+{\alpha}_{\Phi}{\mathrm{\mathcal{L}}}_{\Phi, n} $
 (for the UNet, only the first two terms are used, i.e.,
$ {\alpha}_{\Phi}=0 $
 ). Weights
$ {\alpha}_{\mathbf{x}} $
 ,
$ {\alpha}_{\nabla \mathbf{x}} $
 and
$ {\alpha}_{\Phi} $
 were tuned empirically to 50, 1,000 and 1, respectively, for the 4DVarNet, and to 50 and 50, respectively, for
$ {\alpha}_{\mathbf{x}} $
 and
$ {\alpha}_{\nabla \mathbf{x}} $
 for the UNet.
Input and target of the proposed end-to-end neural scheme for short-term forecasting. (a) Global SLA field at the reference time
$ {t}^{\ast } $
 ; the red box marks the region shown in (b, c). (b) Input to the end-to-end neural model: partial along-track SLA observations for a subset of the 14-day past observation window (blank panels indicate future days, for which no observation exists). (c) Target: the corresponding complete SLA fields across the same window, including the 7-day forecast horizon.

Figure 2. Long description
Panel a is a global map showing S L A in meters. A color scale on the right ranges from dark blue at negative 0.4 to dark red at positive 0.4. A red bounding box is centered over the North Atlantic Ocean.
Panel b shows a sequence of regional maps corresponding to the North Atlantic box. From left to right, the maps are labeled day minus 14, day minus 3, day minus 2, and day minus 1. These maps show sparse, linear tracks of data points in blue and red against a white background. The final three frames in the sequence are empty white boxes.
Panel c shows a corresponding sequence of reconstructed regional maps for the same time steps, plus day 0, day plus 1, and day plus 6. Unlike panel b, these maps show a continuous, fluid field of S L A. A prominent dark blue cyclonic feature is visible in the upper left of each frame, evolving slightly in shape and position over the 20-day period.
3.3. Data preparation
Training is conducted using the GLORYS12 operational ocean reanalysis product, which provides daily global SLA fields at a 1/4° spatial resolution. To simulate real-world altimetric coverage, we generate synthetic nadir-like sampling patterns from the GLORYS12 SLA fields (Importantly, this SLA is derived from the related SSH field by substracting the corresponding mean dynamic topography (MDT) doi:10.48670/moi-00021) and couple them to the corresponding gap-free fields (see Figure 2). These sampled tracks serve as input to the model, while the corresponding future full-field GLORYS12 outputs are used as ground truth during training. During the inference phase, we use real satellite altimetry data from near-real-time dataset (doi:10.48670/moi-00147).
The GLORYS12 SLA fields are used as global fields rather than regional patches. Each input tensor has a shape of
$ 1440\times 680\times 14 $
 and each target tensor has a shape of
$ 1440\times 680\times 7 $
 , corresponding to the global domain at 1/4° resolution.
3.4. Model training
The models were trained on data from the 2010 to 2018 period, with data from 2019 kept for the validation, using the Adam optimizer and a learning rate of
$ {10}^{-3} $
 . Inputs consist of sequences of spatial SLA fields with missing values due to the nadir sampling mask application and outputs are the corresponding complete SLA sequences over a 7-day forecast horizon. Land points are excluded from the loss using a land-sea mask derived from the target field. The training process was performed using one A100 GPU and it took a couple of days for the 4DVarNet to converge and around a day for the UNet. We refer the reader to our PyTorch code for further details.
3.5. Evaluation metrics
The performance of the forecasting system is quantitatively evaluated through a set of diagnostics assessing the accuracy and spatial fidelity of the predicted SLA and SSC fields. All metrics are computed by comparing model forecasts against independent observational datasets: SLA from along-track delayed-time Saral/AltiKa dataset (doi:10.48670/moi-00146) and velocities of drifter trajectories at 15-m depth (doi:10.17882/86236), which were filtered by daily averaging, similarly to Garcia et al. (Reference Garcia, Larroche, Pesnec, Bull, Archambault, Moschos, Stegner, Charantonis and Béréziat2025).
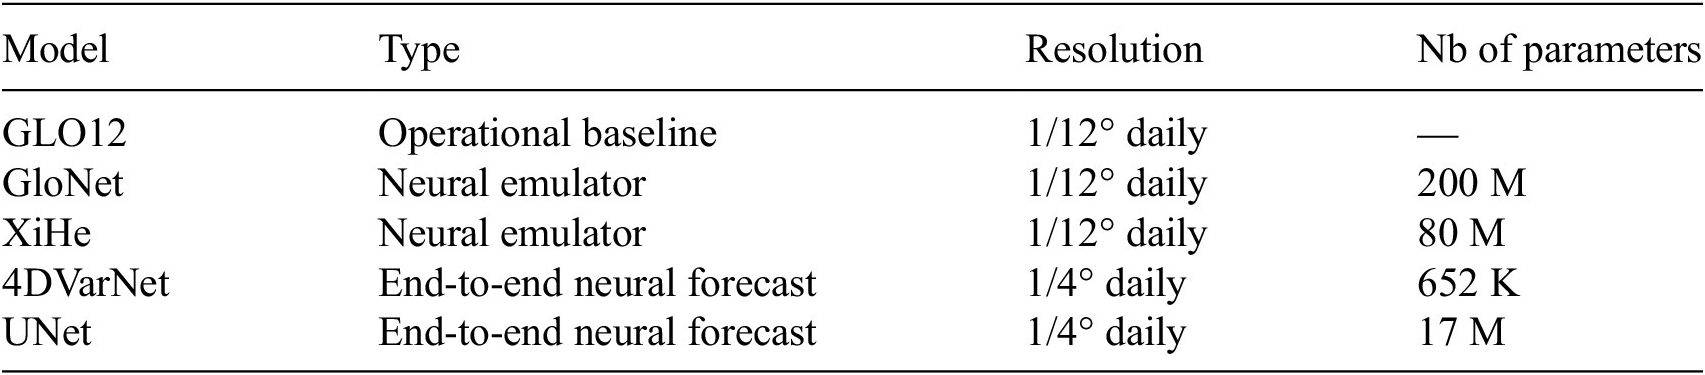
We evaluate the forecasted SSH outputs of (i) operational ocean forecast GLO12 provided in real time by Copernicus Marine (doi:10.48670/moi-00016), (ii) state-of-the-art neural ocean emulators (El Aouni et al., Reference El Aouni, Gaudel, Regnier, Van Gennip, Le Galloudec, Drevillon, Drillet and Lellouche2025; Wang et al., Reference Wang, Wang, Hu, Wang, Huo, Wang, Wang, Wang, Zhu and Xu2024), and (iii) the SLA of the studied end-to-end neural ocean forecasts 4DVarNet and UNet. As summarized in Table 1, these models span two native spatial resolutions: 1/12° for GLO12, GloNet and XiHe, and 1/4° for the proposed end-to-end schemes 4DVarNet and UNet.
Benchmarked models and their specifications

Table 1. Long description
The columns of table are: Model, Type, Resolution and Number of parameters. The raws are: GLO12, GloNet, XiHE, 4DVarNet and Unet. GLO12 is an operational forecasting model, GloNet and XiHE are neural emulators and 4DVarNet and Unet are the proposed end-to-end neural schemes. The GLO12, GloNet and XiHE have 1/12° spatial and daily temporal resolution, while 4DVarNet and Unet have 1/4° spatial and daily resolution.
Following the evaluation protocol of the Ocean Data Challenge for SSH mapping, we compare all forecasts at the observation locations rather than on a common grid. The forecasted fields are interpolated onto the sparse observation points. Specifically, for the SLA metrics, we interpolate the forecasted data along nadir tracks, while for SSC, we perform the interpolation at the drifters’ locations. In contrast to the SSH mapping evaluation introduced in the mentioned Data Challenge, in this study we adapt the framework to respect a strictly forecast-oriented evaluation workflow. We define the leadtime
$ \tau $
 as the number of days between the reference time
$ {t}_0 $
 and the target forecast date, and the nominal forecast leadtime as the calendar date
$ {t}_0+\tau $
 . We only consider one forecasted field per week for each leadtime (where the first leadtime corresponds to Wednesday). As consequence, in order to ensure temporal consistency of the evaluation, for a given leadtime
$ \tau $
 , we consider only observations acquired within a temporal window of
$ \pm 0.5 $
 days around the nominal forecast leadtime
$ {t}_0+\tau $
 in the computation of the metrics described below, so that the observations used to score a given leadtime are temporally collocated with the target date. It is important to mention that a particular attention during the evaluation process is put into the choice of MDT (Le Traon et al., Reference Le Traon, Dibarboure, Jacobs, Martin, Rémy, Schiller, Stammer and Cazenave2017) to derive SLA from provided SSH outputs and vice-versa. We consider the MDT distributed by Copernicus Marine in order to depict the SSH-derived variables provided by model-based forecasts (GLO12 [Lellouche et al., Reference Lellouche, Greiner, Le Galloudec, Regnier, Benkiran, Testut, Bourdalle-Badie, Drevillon, Garric and Drillet2018], GloNet [El Aouni et al., Reference El Aouni, Gaudel, Regnier, Van Gennip, Le Galloudec, Drevillon, Drillet and Lellouche2025] and [Wang et al., Reference Wang, Wang, Hu, Wang, Huo, Wang, Wang, Wang, Zhu and Xu2024]) and the MDT provided in the corresponding altimetry product (doi:10.48670/moi-00146).
Following the oceanic regime masks of the SSH Mapping OSE Data Challenge (Ballarotta et al., Reference Ballarotta, Ubelmann, Pujol, Taburet, Fournier, Legeais, Faugère, Delepoulle, Chelton, Dibarboure and Picot2019), coastal regions are defined as points located within 200 km of the coastline, while the offshore domain is split into high- and low-variability regions by a threshold of 200 cm
$ {}^2 $
 (0.02 m
$ {}^2 $
 ) on the SLA variance from the DUACS product.
We use the normalized root mean squared error (nRMSE) and the average effective resolution to assess the SLA forecast accuracy. The nRMSE quantifies the relative amplitude of model-observation discrepancies, normalized by the observed variability:

where
$ {\hat{y}}_i $
 and
$ {y}_i $
 represent the predicted and observed data, respectively, and
$ N $
 the total number of observation samples.
The average effective resolution, or
$ {\lambda}_x $
 , is defined as the first wavelength
$ \lambda $
 , where the noise to signal ratio (NSR) falls below the chosen threshold
$ \alpha $
 = 0.5 (Ballarotta et al., Reference Ballarotta, Ubelmann, Pujol, Taburet, Fournier, Legeais, Faugère, Delepoulle, Chelton, Dibarboure and Picot2019; see Equation [9]). Here, the NSR is computed as the ratio of the power spectral density of the difference between the forecasted and observed signals to the power spectral density of the observed signal, following Ballarotta et al. (Reference Ballarotta, Ubelmann, Pujol, Taburet, Fournier, Legeais, Faugère, Delepoulle, Chelton, Dibarboure and Picot2019).

$ {\lambda}_x $
 is a diagnostic of the spectral content reconstructed by each product and may be sensitive to the models’ grid resolutions, although the resolution alone does not determine it, as models sharing the same grid exhibit different
$ {\lambda}_x $
 values (see Figure 4).
Benchmark of SSH forecasts (and derived SSC), provided by GLO12, GloNet, XiHe and proposed end-to-end neural forecasts 4DVarNet and UNet. The benchmark presents the following metrics: nRMSE score and average effective resolution of the SSH with respect to SARAL/AltiKa, % correctly predicted SSC angles and magnitudes with respect to drifters. Colors indicate relative gain in % compared to the baseline GLO12, with blue indicating better performances.

In order to obtain the forecasted geostrophic SSC, we differentiate the corresponding SLA forecasts (except the
$ \pm 2{}^{\circ} $
 equator area) and apply drifters-based corrections
$ {MDT}_u $
 and
$ {MDT}_v $
 from the MDT product doi:10.48670/moi-00150:


where
$ u $
 and
$ v $
 are zonal and meridional components of geostrophic current; parameters
$ g $
 and
$ f $
 represent the gravitational acceleration and the Coriolis parameter.
Following the SSC evaluation described in Garcia et al. (Reference Garcia, Larroche, Pesnec, Bull, Archambault, Moschos, Stegner, Charantonis and Béréziat2025), we use here two metrics: percentage of correctly predicted velocity directions (
$ {P}_{\theta } $
 ) and percentage of correctly predicted velocity magnitudes (
$ {P}_{\mid u\mid } $
 ), both compared to the drifters’ velocities at 15-m depth.
$ {P}_{\theta } $
 quantifies the proportion of locations where the angular deviation between forecasted and observed velocities is within a tolerance angle
$ \Delta {\theta}_{\mathrm{max}} $
 fixed at
$ 45{}^{\circ} $
 (see Equation [12]) and
$ {P}_{\mid u\mid } $
 measures the proportion of points where the relative error in speed remains below a threshold
$ {\Delta}_{\mid u\mid, \max } $
 fixed at 25%, (see Equation [13]).


where
$ N $
 is the total number of collocated observation samples and
$ \unicode{x1D540}\left(\cdot \right) $
 denotes the indicator function.
4. Results
In this section, we present the results of the evaluation of the benchmarked forecast models (see Section 4.1). We focus on the performance of the presented forecasts in comparison to the Mercator Ocean operational forecast. The evaluation is performed globally, followed by an analysis of regime-dependent performances across different dynamical regimes.
4.1. Benchmarked models
In this study, we benchmark state-of-the-art neural ocean emulators (Wang et al., Reference Wang, Wang, Hu, Wang, Huo, Wang, Wang, Wang, Zhu and Xu2024; El Aouni et al., Reference El Aouni, Gaudel, Regnier, Van Gennip, Le Galloudec, Drevillon, Drillet and Lellouche2025) and end-to-end neural ocean forecast models against the operational baseline GLO12 (Lellouche et al., Reference Lellouche, Greiner, Le Galloudec, Regnier, Benkiran, Testut, Bourdalle-Badie, Drevillon, Garric and Drillet2018; Lellouche et al., Reference Lellouche, Greiner, Ruggiero, Bourdallé-Badie, Testut, Le Galloudec, Benkiran and Garric2023). The models considered are summarized in Table 1. They are categorized into two groups: neural ocean emulators, which aim to propagate in time the initial state provided by assimilation-based products, and end-to-end neural forecasts, which directly predict the SLA from sparse inputs without relying on any physical model. We evaluate all models at leadtimes ranging from 0 to 7 days, with their predictions compared against independent altimeter and drifter observations. The benchmark focuses on their ability to reproduce SLA and SSC on the set of the evaluation metrics presented in Section 3.5.
4.2. Global-scale performance
Figure 3 shows the SLA predicted by end-to-end neural ocean forecasts at leadtime 0 on January 18, 2023. Figure 4 shows the evaluation metrics across leadtimes 0, 3 and 5 for the benchmarked neural emulators models, all compared to the baseline GLO12, with the colorbar corresponding to the respective relative gains in %. The 4DVarNet consistently outperforms baseline GLO12 and other state-of-the-art neural forecasts across the nRMSE SSH score, remaining stable over leadtimes. Furthermore, 4DVarNet also improves the derived SSC, particularly improving the forecast of SSC angles compared to drifters velocity vectors, suggesting a more accurate capture of flow directions. It is worth recalling that all metrics are computed by interpolating the gridded forecasts onto the nadir track locations. Since this interpolation step cannot add any spectral content beyond what is already present in the forecasted field, the effective resolution metric may be sensitive to each model’s native grid resolution, where a finer resolved grid may be penalized more than a coarser one. Interestingly, this is not observed in our benchmark, as the end-to-end schemes 4DVarNet and UNet at coarser resolutions achieve finer average effective resolutions than the finer grids GLO12 and GloNet. This may suggest that the reported gains could reflect a real forecast-quality improvement rather than the grid-resolution-related bias.
SLA predicted by proposed end-to-end neural forecasts 4DVarNet (left column) and UNet (right column) at leadtime 0 on 2023-01-18.

Figure 3. Long description
A two-panel global map visualization.
* Scale: A vertical color bar on the far right is labeled S L A in meters. It ranges from negative 1.0 in dark blue to 0 in white, up to positive 1.0 in dark red.
* Left Panel: Titled 4 D Var Net. The map shows the global ocean with landmasses in white. Light red shading, indicating slightly positive sea level anomalies, is widespread across the Pacific and Indian Oceans. Concentrated clusters of dark red and dark blue pixels, representing high-magnitude anomalies, are visible in the Southern Ocean near Antarctica and in the Northwest Pacific near Japan.
* Right Panel: Titled U Net. This map displays a nearly identical distribution of S L A values to the left panel. The spatial patterns of light red across the tropics and the high-intensity mesoscale features in the Southern Ocean and Northwest Pacific are preserved, though the U Net visualization appears slightly smoother in texture compared to the 4 D Var Net panel.
4.3. Regime-dependent performance
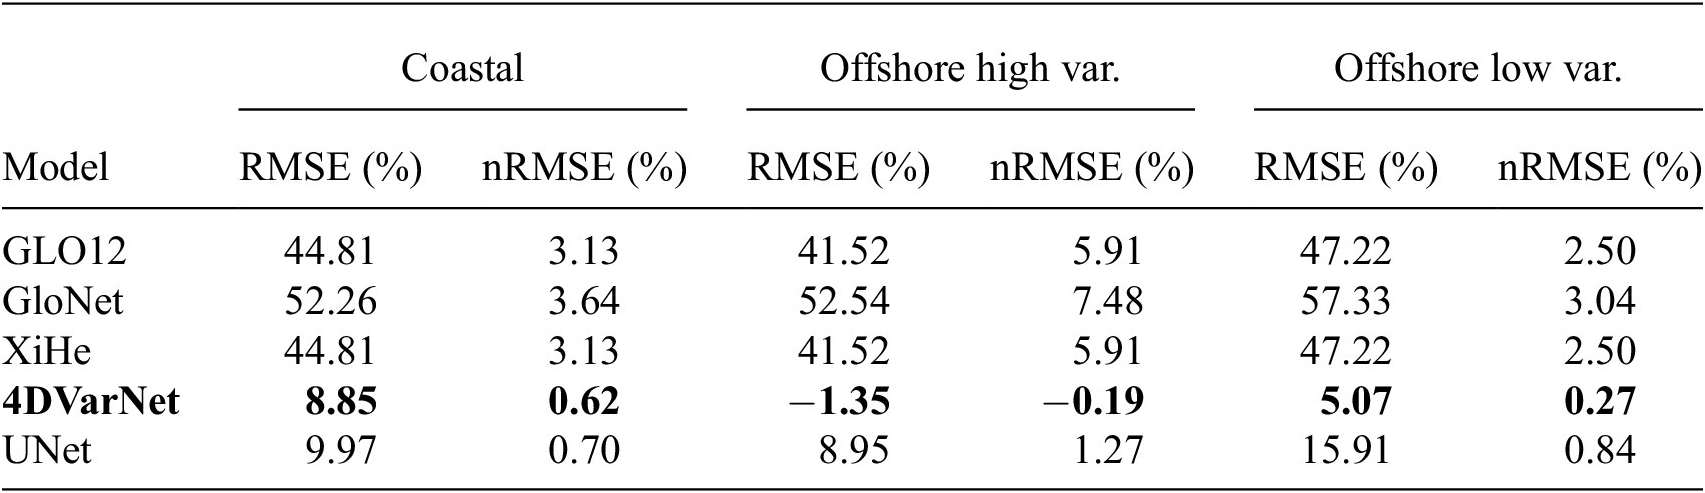
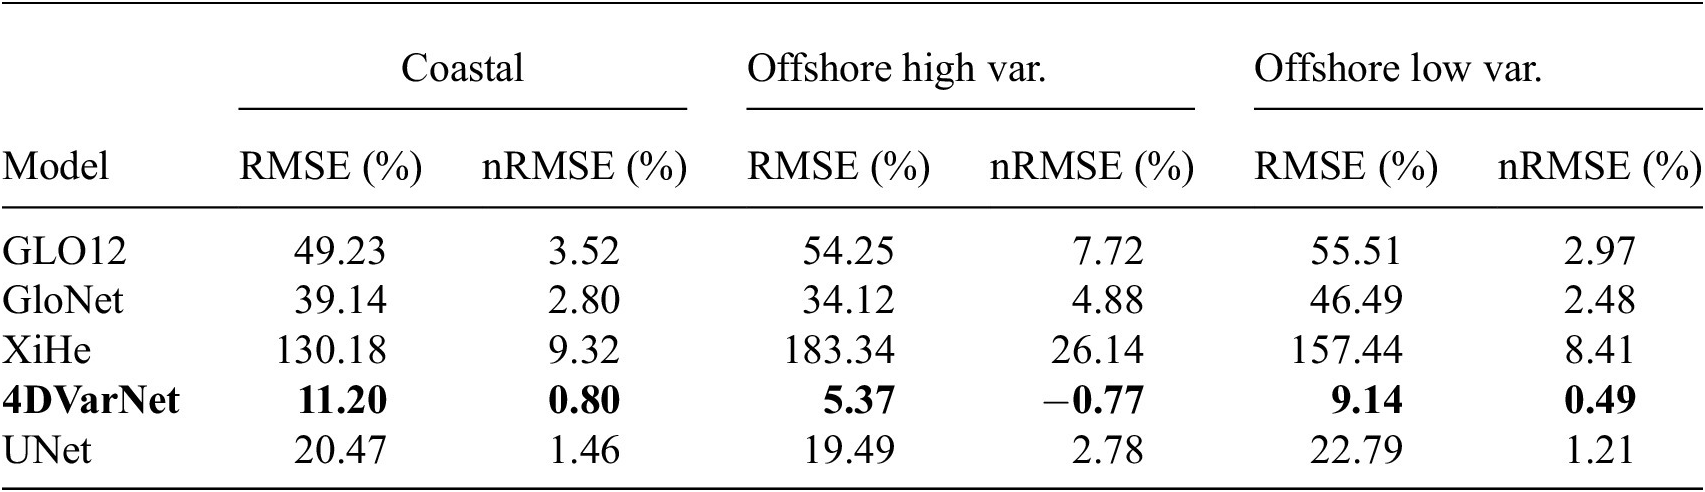
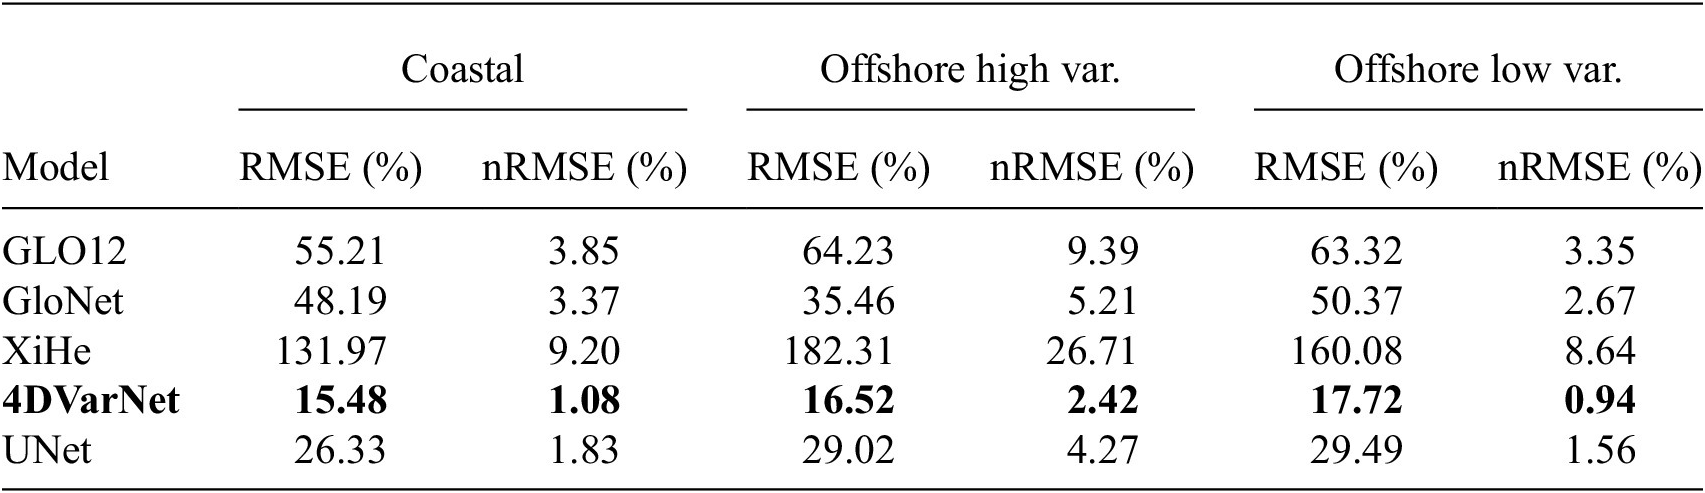
Tables 2–4 assess the performance of the benchmarked models across leadtimes 0, 3 and 5 and three oceanic regimes: coastal, offshore high-variability and offshore low-variability regions. Here we inter-compare the benchmarked models against the observation-based delayed-time product DUACS (Taburet et al., Reference Taburet, Sanchez-Roman, Ballarotta, Pujol, Legeais, Fournier, Faugere and Dibarboure2019). DUACS uses an OI algorithm applied to sparse altimetry data (Ballarotta et al., Reference Ballarotta, Ubelmann, Pujol, Taburet, Fournier, Legeais, Faugère, Delepoulle, Chelton, Dibarboure and Picot2019; Le Traon et al., Reference Le Traon, Dibarboure, Lellouche, Pujol, Benkiran, Drevillon, Drillet, Faugère and Remy2025). We emphasize that, for a given leadtime, DUACS product exploits past and future altimetry observations. This is the reason why we do not include it in the benchmark among the tested approaches. It provides us with a means to compute relative performance metrics in our regime-dependent analysis. DUACS can better reflect the spatial structures of SLA compared to assimilation-based model analyses, especially in highly dynamic regions (Ballarotta et al., Reference Ballarotta, Ubelmann, Pujol, Taburet, Fournier, Legeais, Faugère, Delepoulle, Chelton, Dibarboure and Picot2019). To quantify forecasts’ accuracies relative to the DUACS baseline, we compute percentage gains of each metric relative to the corresponding DUACS score (both evaluated with respect to Saral/AltiKa observations) (see Tables 2–4). At leadtime 0, 4DVarNet achieves the best performance compared to GLO12 baseline across all regions. It remains the closest to the DUACS reconstruction and is even able to outperform it in offshore high-variability regions. UNet performs slightly worse than 4DVarNet, however outperforms GLO12, especially in coastal regions. GloNet underperforms 4DVarNet and UNet, while XiHe is at the same level of performance as GLO12, as its first leadtime is defined as the one provided by the reanalysis. At leadtime 3, 4DVarNet maintains strong performance across all regimes, consistently achieving the lowest RMSE and highest nRMSE, reaching positive gains relative to DUACS. UNet shows competitive performance in low-variability areas, but is worse than GloNet in coastal regions, which gains in performance compared to the first leadtime. By leadtime 5, 4DVarNet still consistently outperforms GLO12 across all regimes and is considerably outperforming DUACS reconstruction especially in coastal and offshore low-variance regions. UNet remains competitive especially in low-variance areas. It is worth mentioning that the nadir data are known to contain additional errors closer to the coast (Ballarotta et al., Reference Ballarotta, Ubelmann, Pujol, Taburet, Fournier, Legeais, Faugère, Delepoulle, Chelton, Dibarboure and Picot2019), which may introduce some bias in the present comparison. While this source of variability is shared by all the products evaluated near the coast, it still may introduce some additional penalization to fields presenting more small-scale variability compared to coarser products. Overall, all models lose performance relative to their first leadtime as forecasts advance, yet 4DVarNet keeps the lowest level of relative errors with respect to DUACS, highlighting the ability of this end-to-end neural architecture to remain close to a purely observations-based product even at longer leadtimes.
Relative error (%) of RMSE and nRMSE metrics of the forecasted SLA at leadtime 0 with respect to DUACS mapping product
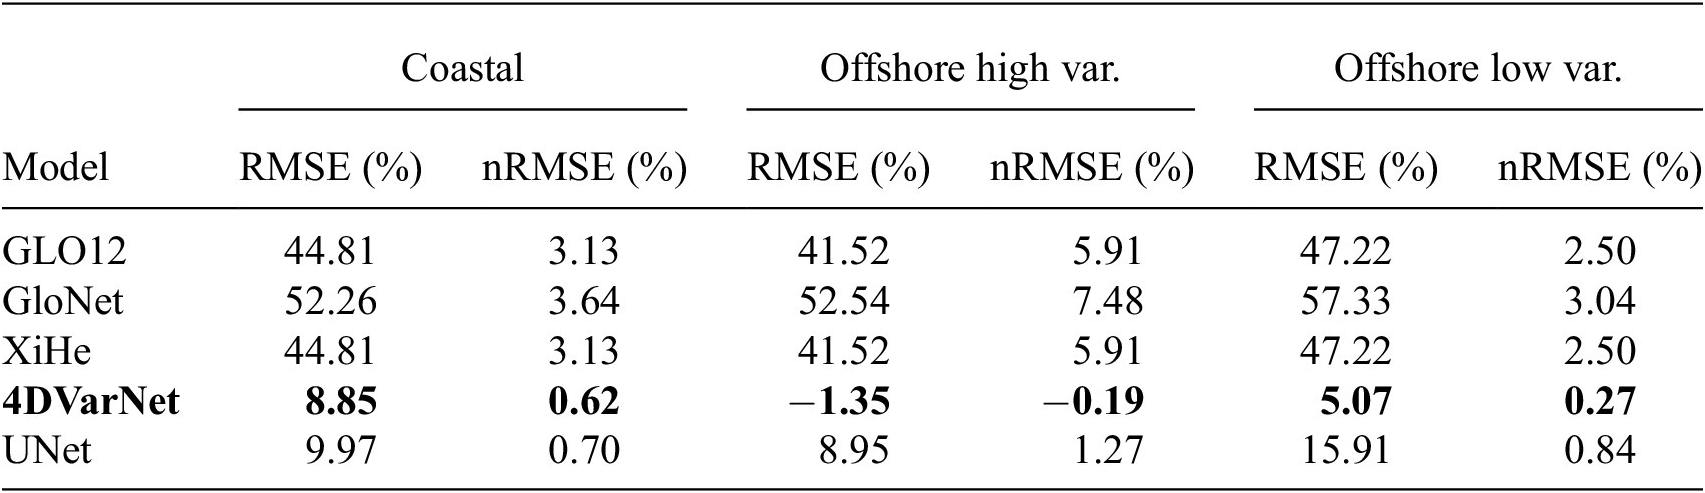
Table 2. Long description
Positive values indicate degradation relative to DUACS, negative values indicate improvement. Compared to the benchmarked forecasts, DUACS SLA relies on past and future altimetry observations for a given leadtime. 4DVarNet shows the best performances compared to DUACS across all regions, in both RMSE and nRMSE metrics.
Note. The metrics are calculated for three dynamical regions: coastal, offshore high-variability and offshore low-variability regions. Positive values indicate degradation relative to DUACS, negative values indicate improvement. Compared to the benchmarked forecasts, DUACS SLA relies on past and future altimetry observations for a given leadtime. Best results are shown in bold.
Relative error (%) of RMSE and nRMSE metrics of the forecasted SLA at leadtime 3 with respect to DUACS at the same leadtime

Table 3. Long description
Positive values indicate degradation relative to DUACS, negative values indicate improvement. Compared to the benchmarked forecasts, DUACS SLA relies on past and future altimetry observations for a given leadtime. 4DVarNet shows the best performances compared to DUACS across all regions, in both RMSE and nRMSE metrics.
Note. The metrics are calculated for three dynamical regions: coastal, offshore high-variability and offshore low-variability regions. Positive values indicate degradation relative to DUACS, negative values indicate improvement. Best results are shown in bold.
Relative error (%) of RMSE and nRMSE metrics of the forecasted SLA at leadtime 5 with respect to DUACS at the same leadtime

Table 4. Long description
Positive values indicate degradation relative to DUACS, negative values indicate improvement. Compared to the benchmarked forecasts, DUACS SLA relies on past and future altimetry observations for a given leadtime. 4DVarNet shows the best performances compared to DUACS across all regions, in both RMSE and nRMSE metrics.
Note. The metrics are calculated for three dynamical regions: coastal, offshore high-variability and offshore low-variability regions. Positive values indicate degradation relative to DUACS, negative values indicate improvement. Best results are shown in bold.
Figures 5 and 6 further illustrate this comparison by displaying the SLA fields from GLO12, proposed end-to-end forecasts 4DVarNet and UNet at leadtimes 0 and 5, but also DUACS L4 product for the corresponding dates, in two high-variability regions: Gulf Stream and Agulhas. As expected, GLO12 struggles to correctly position some dynamical structures in comparison to observation-based product DUACS. In the contrast, the end-to-end neural forecasts better recover spatial patterns and are more consistent with DUACS. At leadtime 5, however, the UNet forecast shows a noticeable loss of energy, reflected in a reduced SLA variance, a phenomenon which is not observed in the 4DVarNet forecasts.
SLA reconstructed by OI-based DUACS product vs baseline forecast GLO12 and proposed end-to-end neural forecasts 4DVarNet and UNet at leadtimes 0 and 5 in the Gulf Stream on 18 January, 2023 and 23 January, 2023.

Figure 5 Long description
The compared models are: referenced GLO12, 4DVarNet and Unet. All models are compared to the OI-based reconstruction of the SLA provided by DIUACS product. 4DVarNet and Unet show eddies structures visually closer to the OI-based product DUACS than the reference GLO12. Unet seems to be less energetic at leadtime 5 than at the leadtime 0, compared to the 4DVarNet.
SLA reconstructed by OI-based DUACS product vs baseline forecast GLO12 and proposed end-to-end neural forecasts 4DVarNet and UNet at leadtimes 0 and 5 in the Agulhas region on January 18, 2023 and 23 January, 2023.

Figure 6 Long description
The compared models are: referenced GLO12, 4DVarNet and Unet. All models are compared to the OI-based reconstruction of the SLA provided by DIUACS product. 4DVarNet and Unet show eddies structures visually closer to the OI-based product DUACS than the reference GLO12. Unet seems to be less energetic at leadtime 5 than at the leadtime 0, compared to the 4DVarNet.
5. Conclusion and discussion
This study introduces a deep learning-based framework for short-term ocean forecasting, proposing an end-to-end neural architecture, particularly the 4DVarNet scheme and a state-of-the-art UNet, in a novel forecasting setup. Trained on simulated nadir altimetry data, the model demonstrates state-of-the-art performance in predicting global SSH over a seven-day horizon. Integrated within the OceanBench benchmark setup (Johnson et al., Reference Johnson, Febvre, Gorbunova, Metref, Ballarotta, Le Sommer and Fablet2023; El Aouni et al., Reference El Aouni, Gaudel, Johnson, REGNIER, Le Sommer, Van Gennip and Le Traon2026), our approach provides a standardized and reproducible framework for neural ocean forecasting. The results of the present benchmark open promising avenues for future improvements in operational oceanography using machine learning. Our findings demonstrate the relevance of end-to-end neural networks for short-term ocean forecasting. The ability of both 4DVarNet and UNet to handle sparse observations and to produce accurate forecasts is of particular interest for an operational context, where real-time data are often incomplete or noisy.
One of the limitations of the present benchmark concerns the comparison of forecasts provided at different spatial resolutions: 1/4° for the proposed end-to-end schemes (4DVarNet, UNet) against 1/12° (GLO12, GloNet and XiHe) (see Table 1). The presented point-wise evaluation protocol (see Section 3.5) scores every model against the same independent sparse SARAL/AltiKa and drifter observations rather than on a common grid. This avoids the degradation of the 1/12° products to coarser resolution. This approach cannot however fully separate the purely forecasting performance from the intrinsic resolution bias, such as the relative smoothness of the coarser fields. One of the implications may concern the strong performance of the 1/4° end-to-end schemes in offshore low-variability regions (Section 4.3) as a coarser grid tends to smooth the dynamics and thus introduce less fine-scale variability. Furthermore, higher resolved products may be penalized twice, especially in regions where smaller structures may be correctly reconstructed in amplitude but be mispositioned (Crocker et al., Reference Crocker, Maksymczuk, Mittermaier, Tonani and Pequignet2020). In our benchmark, we observed that in the high-variability regions, 4DVarNet, despite its coarser resolution, outperforms both GLO12 and DUACS (see Section 4.3), in contrast to what we would expect from spatial averaging which would tend to degrade rather than improve performance in dynamically active regimes. Thus, we state this as evidence that at least part of the reported gains reflect the forecasting accuracy. Assessing the impact of resolution on the present benchmark would require a dedicated comparison, such as re-gridding all products to a common resolution before computing the presented metrics or after retraining the end-to-end schemes at higher resolution.
In addition, the present study benchmarks two state-of-the-art image-to-image architectures, 4DVarNet and UNet, chosen, respectively, for their variational data assimilation grounding and their common use in computational imaging. Beyond these two architectures, the transformer-based one constitutes a promising direction for the end-to-end forecasting task. Recent studies suggest that such models can outperform convolutional architectures such as UNet on forecasting tasks (Gao et al., Reference Gao, Shi, Wang, Zhu, Wang, Li and Yeung2022). We note, however, that within the present benchmark, the transformer-based neural emulator XiHe underperforms the more conventional CNN-based GloNet, suggesting that architecture choice alone does not guarantee improved performance in the proposed setting, but the training strategy and dataset design play an important role.
While we only rely on training strategies based on reanalysis datasets and simulated observation data, future work could explore the potential of using real observation datasets (Martin et al., Reference Martin, Manucharyan and Klein2024; Dorffer et al., Reference Dorffer, Jourdin, Nguyen, Devillers, Mouillot and Fablet2025). In this context, the benefit of wide-swath altimetry data could be highly valuable (Ballarotta et al., Reference Ballarotta, Ubelmann, Bellemin-Laponnaz, Le Guillou, Meda, Anadon, Laloue, Delepoulle, Faugère, Pujol, Fablet and Dibarboure2025; Fouchet et al., Reference Fouchet, Benkiran, Le Traon and Remy2025). Accounting for uncertainty quantification in the proposed end-to-end neural forecasts is also a key challenge. We aim to explore the combination of 4DVarNet schemes and generative approaches (Li et al., Reference Li, Carver, Lopez-Gomez, Sha and Anderson2024) as recently explored for SLA mapping (Beauchamp et al., Reference Beauchamp, Fablet, Benaichouche, Tandeo, Desassis and Chapron2025).
Data availability statement
The data used in this study are publicly available at Copernicus Marine Data Store. The code of the proposed benchmark workflow is available at https://github.com/CIA-Oceanix/4dvarnet-starter/tree/forecast-glorys12.
Author contribution
Conceptualization: D.B., L.G., J.L.S., C.d.B.M., A.e.A. and R.F.; Data curation: D.B.; Data visualization: D.B. and L.G.; Methodology: D.B., P.H., J.L.S. and R.F.; Writing original draft: D.B., L.G. and R.F.
Funding statement
This work has been carried out as part of the Copernicus Marine Service OceanBench-STOF project. Copernicus Marine Service is implemented by Mercator Ocean in the framework of a delegation agreement with the European Union. This work was partially supported by the French ANR OceaniX (ANR-19-CHIA-0016). It also benefited from HPC and GPU resources provided by GENCI-IDRIS (Grant 2021-101,030) and the CPER AIDA GPU cluster, supported by the Regional Council of Brittany, Brest Métropole and Fonds Européen de DEveloppement Régional (FEDER).
Competing interests
The authors declare no conflicts of interest.
Ethics statement
The research meets all ethical guidelines, including adherence to the legal requirements of the study country.






 Open access


Comments
Dear editor,
We wish to submit a research article entitled “Neural ocean forecasting from sparse satellite-derived observations: a case-study for SSH dynamics and altimetry data”. We confirm that this work is original and has not been published elsewhere, nor is it currently under consideration for publication elsewhere.
In this paper, we present an end-to-end deep learning framework for short-term forecasting of global sea surface dynamics based on sparse satellite altimetry data. Building on two state-of-the-art architectures, U-Net and 4DVarNet, we adapt them to forecast the sea level anomaly and sea surface currents over a 7-day horizon using sequences of sparse nadir altimeters observations. The model is trained on data from the GLORYS12 operational ocean reanalysis, with synthetic nadir sampling patterns applied to simulate realistic observational coverage. The forecasting task is formulated as a sequence-to-sequence mapping, with the input comprising partial sea level anomaly snapshots and the target being the corresponding future full-field SLA maps.
We have no conflicts of interest to disclose.
Please address all correspondence concerning this manuscript to us at daria.botvynko@imt-atlantique.fr.
Thank you for your consideration of this manuscript.