Introduction
Phaseolus is a large genus of the family Fabaceae that comprises about 80 species across the globe (Ulloa Ulloa et al., Reference Ulloa Ulloa, Acevedo-Rodríguez, Beck, Belgrano, Bernal and Berry2018; Chacón-Sánchez et al., Reference Chacón-Sánchez, Martínez-Castillo, Duitama and Debouck2021). Five species namely, Phaseolus vulgaris L. (common bean), Phaseolus lunatus L. (lima bean), Phaseolus acutifolius A. Gray (tepary bean), Phaseolus coccineus L. (runner bean) and Phaseolus dumosus or Phaseolus polyanthus Greenman (year bean) are the dominant species of this family (Mina-Vargas et al., Reference Mina-Vargas, McKeown, Flanagan, Debouck, Kilian, Hodkinson and Spillane2016; Nadeem et al., Reference Nadeem, Habyarimana, Ciftci, Nawaz, Karaköy, Shahid, Hatipoğlu, Yeken, Ali, Ercişli, Chung and Baloch2018). Common bean has been diversified based on various characters like pod features, seed types, etc. However, it is found to be highly complex by its growth habit. Common bean is categorized into six or seven domesticated races due to the presence of high level of diversity (Hao et al., Reference Hao, Song, Cui, Hua, Zhu, Wu, Wang, Chen and Zhang2023). It is believed to be domesticated approximately 8000 years ago in Central America (Chacón-Sánchez et al., Reference Chacón-Sánchez, Martínez-Castillo, Duitama and Debouck2021) and later on introduced in other parts of the world by the Portuguese traders. Two major diverse gene pools of common bean have been reported – Mesoamerican and Andean (Angioi et al., Reference Angioi, Rau, Attene, Nanni, Bellucci, Logozzo, Negri, Zeuli and Papa2010). The Mesoamerican gene pool has been distributed from Mexico throughout the Central America, into Columbia and Venezuela, while the Andean gene pool has its distribution throughout the Southern Peru, Chile, Bolivia and Argentina (Rana et al., Reference Rana, Sharma, Tyagi, Chahota, Gautam, Singh, Sharma and Ojha2015; Choudhary et al., Reference Choudhary, Hamid, Singh, Khandy, Sofi, Bhat and Mir2017). In India, common bean was dispersed mainly by Portuguese, English, Dutch and French traders in the beginning of the 16th century via the Red and Arabian Seas and Chinese through the Hindustan Silk Route (Rana et al., Reference Rana, Sharma, Tyagi, Chahota, Gautam, Singh, Sharma and Ojha2015). Since then, the species has undergone an adaptive evolutionary process for approximately 400 years in these areas (Westphal, Reference Westphal1974; Choudhary et al., Reference Choudhary, Hamid, Singh, Khandy, Sofi, Bhat and Mir2017). The morphological, biochemical and molecular evaluation of common bean revealed that the Mesoamerican-originated wild community differs from the Andean (Angioi et al., Reference Angioi, Rau, Attene, Nanni, Bellucci, Logozzo, Negri, Zeuli and Papa2010; Desiderio et al., Reference Desiderio, Bitocchi, Bellucci, Rau, Rodriguez, Attene, Papa and Nanni2013). Another differentiating factor is the S or T type of phaseolin protein found in the seeds of common bean (Choudhary et al., Reference Choudhary, Hamid, Singh, Khandy, Sofi, Bhat and Mir2017). Molecular markers based on microsatellite repeats [simple sequence repeats (SSRs)] have been used frequently in common bean due to their abundance and fairly even dispersal in the genome, as well as their ease of analysis and comparisons between studies and germplasm sets, despite of the fact that numerous types of markers have been used in the last few decades for genetic studies. Several authors (Angioi et al., Reference Angioi, Rau, Attene, Nanni, Bellucci, Logozzo, Negri, Zeuli and Papa2010; Dutta et al., Reference Dutta, Singh, Chatterjee, Boopathi, Singh and Saha2016; Gioia et al., Reference Gioia, Logozzo, Marzario, Spagnoletti Zeuli and Gepts2019; Vidak et al., Reference Vidak, Šatović, Liber, Grdiša, Gunjača, Kilian and Carović-Stanko2021) confirmed SSR as a resourceful genetic tool for diversity and population structure studies in common bean.
Common bean (also known as kidney bean or rajmash) is one of the most ancient legumes cultivated over a 90% growing area globally for its edible seeds as dry and green beans (Celmeli et al., Reference Celmeli, Sari, Canci, Sari, Adak, Eker and Toker2018). The global annual production of bean grain is about 31 million tonnes and Brazil is the leading producer of common bean, followed by India, Myanmar, China, United States and Mexico (FAOSTAT 2020; Delfini et al., Reference Delfini, Moda-Cirino, Neto, Ruas, Sant'Ana, Gepts and Gonçalves2021). In India, Uttarakhand produces 40.22 tonnes of common bean and acquires 16th position at national level [National Horticulture Board (NHB), 2017–2018]. Immature pods, known as snap beans, are eaten as vegetable, and straw from the plant is utilized as fodder. Common bean is consumed worldwide as a major reservoir of protein, dietary fibres and microelements (Broughton et al., Reference Broughton, Hernandez, Blair, Beebe, Gepts and Vanderleyden2003; Głowacka et al., Reference Głowacka, Gruszecki, Szostak and Michałek2019). It is highly proteinaceous (14–33%) and consumed preferentially as a vegetarian protein reserve (Venkidasamy et al., Reference Venkidasamy, Selvaraj, Nile, Ramalingam, Kaia and Nile2019; Flores-sosa et al., Reference Flores-Sosa, Aquino-Bolaños, Cardador-Martínez, Chávez-Servia, Vera-Guzmán, Carrillo-Rodríguez and Jiménez2020). In addition, it is a prosperous resource of iron, zinc, folic acid, potassium, phosphorous, magnesium, manganese, selenium, etc. (Broughton et al., Reference Broughton, Hernandez, Blair, Beebe, Gepts and Vanderleyden2003; Petry et al., Reference Petry, Boy, Wirth and Hurrell2015). Besides this, essential amino acids like phenylalanine + tyrosine (53–105 mg/g), lysine (10–104 mg/g) and leucine (14–92 mg/g) have been recorded in common bean. However, the species is deficient in the sulphur-containing amino acids: methionine + cysteine (Moraes and Angelucci, Reference Moraes and Angelucci1971; Flores-sosa et al., Reference Flores-Sosa, Aquino-Bolaños, Cardador-Martínez, Chávez-Servia, Vera-Guzmán, Carrillo-Rodríguez and Jiménez2020).
Generally, common bean is a self-pollinating crop grown in tropical, semi-tropical and temperate regions of the world (Wang et al., Reference Wang, Ding, Hu, Lin, Wang, Wang, Zhang and Zhou2012; Gupta et al., Reference Gupta, Zargar, Salgotra, Sharma, Gupta and Rai2019). In India, common bean has been cultivated in the plains of Uttar Pradesh, Andhra Pradesh and Maharashtra during autumn, and in hilly areas such as Uttarakhand, it is grown as a kharif crop during summer and winter (Sharma and Singh, Reference Sharma and Singh2014). Many well-known landraces named Auli, Harshil and Munsiyari have been cultivated in the high mountain regions of Uttarakhand which are morphologically different and include considerable adaptability to local environmental settings (Rana et al., Reference Rana, Sharma, Tyagi, Chahota, Gautam, Singh, Sharma and Ojha2015). Although, the genetic characterization of few local accessions/varieties of common bean gathered from Pantnagar (Uttarakhand) have been investigated using microsatellite markers (Kumar et al., Reference Kumar, Singh, Rai, Bhaskar and Datta2013), local accessions of the species from the Uttarakhand have not been evaluated systematically and scientifically till date. Therefore, the present study is attempted (i) to investigate the level of variations in physical diversity of common bean accessions; (ii) to assess the genetic polymorphism, diversity and population composition among common bean accessions using newly designed chloroplast markers; and (iii) to investigate the cross-transferability among the selected members of the genus.
Materials and methods
Plant materials
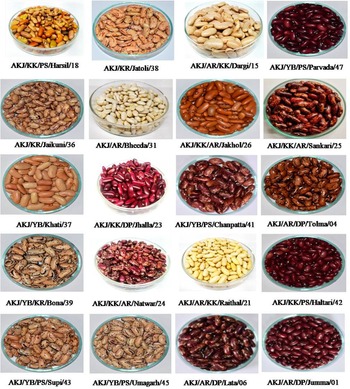
Altogether, 119 genotypes of 20 diverse common bean accessions were gathered from local farmers' fields in Uttarakhand, India and subjected to further study (Table 1; Fig. 1). Local cultivars such as Vigna radiata (mung bean), Macrotyloma uniflorum (gahat), Glycine max (soybean) and Vigna mungo (black gram) were also collected from the farmers of Jakholi, Rudraprayag, Uttarakhand and used for evaluating the cross-transferability of cpSSR markers. Common bean seeds collected from various locations were brought into the laboratory and sown in a seedling tray. After 33 days of seed sowing (seed sowed in off season – December), the fresh young juvenile leaves were harvested, washed and used for further experimentation.
Common bean accessions collected from diverse locations of Uttarakhand

Seeds of 20 different accessions of common bean collected from Uttarakhand to study genetic variations.

Estimation of physical parameters
Common bean seeds from each accession were selected randomly and three major dimensions: length, width and thickness were measured using a Vernier calliper. Seed weight of each accession was determined using electronic balance (Citizen Scale India, Pvt. Ltd.). Ten determinations were used to calculate the mean value (Wani et al., Reference Wani, Sogi, Wani and Gill2017).
Chloroplast microsatellites (cpSSR) marker designing
The complete common bean chloroplast genome (Guo et al., Reference Guo, Castillo-Ramirez, Gonzalez, Bustos, Fernandez-Vazquez, Santamaria, Arellano, Cevallos and Davila2007) was retrieved from the National Center for Biotechnology Information (NCBI:https://www.ncbi.nlm.nih.gov/nuccore/NC_009259.1/). The Microsatellite Search Module (MISA) programme was implemented for the identification of SSRs (Thiel et al., Reference Thiel, Michalek, Varshney and Graner2003). The minimum length threshold condition applied to investigate SSRs was six for dinucleotide, four for trinucleotide, and three for tetra, penta and hexanucleotide respectively, while mononucleotides were debarred from the evaluation. Ideal and compound SSRs were determined by means of the MISA pipeline. The repeat sequences were interrupted by non-repeat sequences (100 bp) in the case of compound SSRs. The Batch Primer-3 version 1.0 programme developed by You et al. (Reference You, Huo, Gu, Luo, Ma, Hane and Lazo2008) was accustomed to design primers flanking repeated regions of chloroplast SSR containing sequences in the genome. The cpSSR primers were developed using parameters as follows: (i) primer length ranged from 18 to 23 bp, (ii) product size ranged from 100 to 300 bp and (iii) an optimum GC content of 50% with a range of 40–70% (Table 2). The identified chloroplast-based markers were designated as PV_cpSSR (P. vulgaris chloroplast SSRs) primers.
Chloroplast simple sequence repeats (cpSSR) markers applied for genetic diversity evaluation of various accessions of common bean

Tm, melting temperature; IGS, intergenic spacer; PIC, polymorphic information content.
DNA isolation and cpSSR marker amplification
The fresh, young, juvenile leaves at the apex of the plant were used for genomic DNA extraction using the CTAB (cetyl tri-methyl ammonium bromide) buffer assay with slight alterations (Jugran et al., Reference Jugran, Bhatt, Rawal, Nandi and Pande2013a, Reference Jugran, Rawat, Dauthal, Mondal, Bhatt and Rawal2013b). The quality of extracted DNA samples was examined by electrophoresing on an agarose gel (1%) prepared in 0.5× TBE (Tris-HCl, Boric acid, EDTA) buffer. DNA fragments were visualized under the gel documentation system (I Gene Labserve, India) using a standard DNA ladder. Genomic DNA was amplified through polymerase chain reaction (PCR) using 20 μl of reaction mixture having 1 μl template DNA (4–5 ng/μl), 10 mM DNTPs (final concentration – 0.15 mM), 10 picomole of each forward and reverse primer, 1 U Taq polymerase, 10× PCR buffer and 25 mM MgCl2 (final concentration – 1.25 mM) by following Sharma et al. (Reference Sharma, Hyvönen and Poczai2020). All reactions were conducted in a thermocycler (Biometra, Germany) using the following reaction conditions: early denaturation for 2 min at 94°C, 35 cycles of denaturation for 30 s at 94°C, 1 min annealing at 55°C, 2 min extension at 72°C and final extension at 72°C for 5 min. PCR products (amplicon) were qualitatively analysed on a 3% agarose gel (Bio Rad, USA) and fragment size was estimated using the 100 bp DNA ladder (O’ Gene Ruler, HiMedia) as a reference. A total of 15 newly designed cpSSR markers were utilized for DNA amplification, of which only eight markers showed polymorphism after initial screening and these primer pairs were used for final amplification of common bean samples. Likewise, the cross-transferability of cpSSR markers among other Fabaceae members namely V. radiata, M. uniflorum, G. max and V. mungo was also evaluated using the same method.
Data analysis
Physical parameters like seed weight, length, width and thickness data were expressed as a mean value ± standard error (SE) using 10 replicates from each accession. To estimate the degree of variation in physical parameters, the coefficient of variation (CV) of each parameter was calculated as follows: CV = s/x, where x is the average value and s is the standard deviation. Relationship among physical and genetic parameters was established by using Pearson correlation coefficient using SPSS software version 17.0 (SPSS Inc., Chicago, IL, USA). A correlogram was developed using CORRPLOT programme in R studio.
Out of 15 primer pairs screened, only eight primer pairs exhibited polymorphism and produced clear and reproducible fragments, and therefore used for final study. A total of 119 genotypes of 20 common bean accessions from Uttarakhand were subjected to detect polymorphism at genetic level using eight primer pairs. Markers that produced the same-sized fragments throughout the common bean genotypes were designated as monomorphic, while cpSSRs producing varied fragments were considered polymorphic. A genotype that does not cause any type of amplification under standard circumstances is considered a null allele. The polymorphic information content (PIC) of each marker was measured using the following formula mentioned in Anderson (Reference Anderson1993): PIC = 1 − Ʃp 2ij, where pij is the frequency of the patterns (j) for each cpSSR marker (i).
Markers showing polymorphism were utilized to assess various attributes related to variability in common bean. The SSR fragments were scored on the basis of the occurrence (1) or non-occurrence (0) in all the samples examined. The binary data of each sample from diverse accessions were investigated using POPGENE version 32 (Yeh et al., Reference Yeh, Yang and Boyle1999). The matrix was used to determine polymorphic loci number (Np), polymorphic loci per cent (Pp%), number of observed alleles (Na), effective alleles per locus (Ne), heterozygosity (He = Nei's gene diversity), Shannon's information index (I), gene flow estimation (Nm) and genetic differentiation (Gst) using the POPGENE programme. The haplotypic richness (Rh), a measure of genetic diversity greatly impacted by rare alleles and effective population size among studied accessions, was determined (Petit et al., Reference Petit, El Mousadik and Pons1998) using haplotype analysis software (Eliades and Eliades, Reference Eliades and Eliades2009). The PHYLIP version 3.68 software was employed to create a dendrogram of studied accessions by first transforming binary data into PHYLIP format, followed by generating matrices using the SEQBOOT and GENEDIST programme. Ultimately, the NEIGHBOR programme, followed by the CONSENSE programme from PHYLIP, was employed using 1000 bootstraps (replications) to create an unrooted phylogenetic tree (Felsenstein, Reference Felsenstein1995). A principal coordinate analysis (PCoA) was executed to evaluate the genetic relationship between accessions based on Nei's genetic distance using a covariance standardized PCoA method in GenAlEx 6.5 (Peakall and Smouse, Reference Peakall and Smouse2012). An analysis of molecular variance (AMOVA) was performed to partition hereditary differences among accessions using the above-mentioned programme. Cross-transferability and fragment size produced with cpSSR markers were recorded for all studied species. The degree of mixing and population composition were estimated based on the Bayesian clustering algorithm by using STRUCTURE software version 2.3.4 (Pritchard et al., Reference Pritchard, Stephens and Donnelly2000). Sub-populations within common bean samples were measured by three independent interactions as K values from 1 to 10 initially with different interactions and a burning length period to remove additional load on the computer. Final analysis was performed at 100,000 interactions with a 300,000-burn period using 20 interactions of K1 to 5 by employing an admixture model throughout the previously allocated population as a sampling location and with the frequency of linked alleles among populations. The numbers of best possible K groups were determined by estimating ΔK parameter using Structure Harvester programme (Earl and VonHoldt, Reference Earl and VonHoldt2012) as projected by Evanno's method (Evanno et al., Reference Evanno, Regnaut and Goudet2005).
Results
Assessment of physical variations in common bean accessions
Among the studied parameters, maximum seed weight (0.618 g) was recorded in AKJ/YB/KR/Bona/39 accession, whereas, minimum seed weight (0.237 g) was observed in AKJ/AR/DP/Jumma/01 accession (online Supplementary material Fig. S1a). Seed length was found highest (16.090 mm) in AKJ/AR/KK/Raithal/21 accession and lowest (8.670 mm) in AKJ/AR/Bheeda/31 accession. Seed width was found maximum (8.380 mm) in AKJ/YB/KR/Bona/39 accession while it was minimum (5.210 mm) in AKJ/AR/Bheeda/31 accession. Likewise, seed thickness was found maximum (6.467 mm) in AKJ/YB/PS/Chanpatta/41 accession and minimum (2.760 mm) in AKJ/AR/PD/Lata/06 accession. In further analysis, highest seed length–width ratio (2.06) was recorded in AKJ/YB/KR/Bona/39 and AKJ/AR/KK/Dargi/15 accessions while the lowest (1.51) value for length–width ratio was observed in AKJ/KR/Jaikuni/36 accession (online Supplementary material Fig. S1b). The CV of seed weight extended from 11 to 25%. Among them, seed weight had the largest CV while seed width had the smallest CV.
Data mining and cpSSR marker development
Common bean chloroplast genome (NCBI Reference Sequence: NC_009259.1) was downloaded from the NCBI and used for mining of SSRs. Fifteen primers were developed which qualified different parameters during the process, and all the selected primers were synthesized and used for validation of amplification in 119 individuals from 20 common bean accessions. With the availability of complete genomic sequences of common bean and co-dominant property, ease of use, repeatability and multi-allelic nature establish SSRs as the preferred marker of choice to measure genetic inconsistency (Kumar et al., Reference Kumar, Vijeshwar, Shahi, Qazi and Balyan2006; Matondo et al., Reference Matondo, Yao, Kyalo, Skilton, Nkongolo, Mumba, Tshilenge and Lubobo2017).
Genetic variability of common bean accessions
Eight cpSSR primer pairs were utilized for DNA amplification of 119 individuals of common bean. Average number of polymorphic loci was recorded 10.9 from 119 individuals. The study showed that marker PV_cpSSR3 was reasonably informative (0.25 < PIC < 0.5) while the remaining seven markers were highly informative in nature (0.5 < PIC > 0.75). The PIC value ranged from 0.428 (PV_cpSSR3) to 0.817 (PV_cpSSR12), with a mean of 0.615 (Table 2). Further, the allele size varied from 112 to 300 bp (Table 2; online Supplementary material Fig. S2a). Highest (80%) polymorphic loci per cent was detected in AKJ/KK/PS/Harshil/18 accession and lowest (40%) in AKJ/YB/Khati/37 and AKJ/KK/AR/Natwar/24 accessions using cpSSR markers. The Na ranged from 1.40 (AKJ/YB/Khati/37 and AKJ/KK/AR/Natwar/24 accession) to 1.80 (AKJ/KK/PS/Harshil/18 accession) with a mean of 1.55, Ne ranged from 1.229 (AKJ/YB/PS/Supi/43 accession) to 1.510 (AKJ/KK/DP/Jhalla/23 accession) with a mean value of 1.370, I varied from 0.223 (AKJ/YB/PS/Supi/43 accession) to 0.431 (AKJ/KK/PS/Harshil/18 accession). Heterozygosity (He) was recorded at its maximum (0.292) in AKJ/KK/DP/Jhalla/23 accession while it was observed minimum (0.145) in AKJ/YB/PS/Supi/43 accession (Table 3). Haplotype analysis demonstrated maximum (3.524) haplotypic richness in AKJ/KR/Jatoli/38 accession and minimum (1.667) in AKJ/AR/DP/Tolma/04 accession. Mean haplotypic richness (Rh) in all studied accessions was found to be 2.576 in this study (Table 3).
Characteristics of eight chloroplast microsatellite markers in 20 accessions of common bean

Na, observed number of alleles; Ne, effective number of alleles; He, gene diversity; I, Shannon's information index; Rh, haplotypic richness.
Genetic differentiation and gene flow
Total genetic variation was partitioned by subjecting the common bean samples to evaluate the molecular variance (AMOVA) by estimating the variance among populations and within populations. The high within-population variations (99%) was recorded as compared to the among (1%) population variations (online Supplementary material Table S1). These findings were somewhat complemented by the Gst (0.264), which also demonstrated high within-population diversity (73.6%) in the studied accessions. The gene flow level was observed to be 1.396 among common bean accessions under the study.
Genetic relationships and population composition
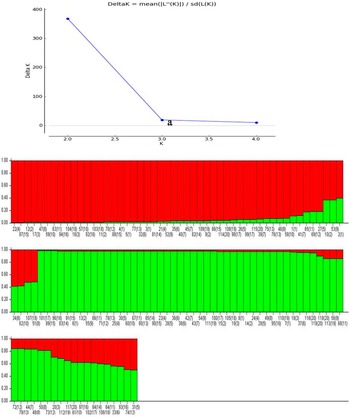
The pair-wise genetic dissimilarity between accessions was evaluated to measure the relationship between them using Nei's approach (Nei's, Reference Nei1978). A maximum (0.198) genetic distance was recorded between AKJ/KR/Jatoli/38 and AKJ/KK/PS/Harshil/18 accessions, while it was minimum (0.017) between AKJ/AR/DP/Lata/06 and AKJ/AR/DP/Jumma/01 accessions (online Supplementary material Table S2). The dendrogram construction through the neighbor-joining method separated all studied accessions into two main groups: group A and B. Group A encompasses the sample gathered from Jhalla, while group B contains the remaining 19 accessions. Group B was further separated into two sub-clusters, BI and BII (online Supplementary material Fig. S3). To estimate the genetic structure, PCoA showed distribution of 20 accessions in a three-dimension space constructed on on the basis of genetic distances. The genetic variance percentage defined by all three PCoA coordinates in the study was 8.57, 16.73 and 24.44% (online Supplementary Fig. S4). The relationship among populations in the two components is similar to the clustering pattern obtained in the study. In order to culminate the possible genetic populations, 119 genotypes were assessed by STRUCTURE software using an admixture model. Evano's ΔK statistics were utilized to select the ideal K value based on the increase in possibility ratios between runs. The ideal sub-populations were found to be K = 2 (Fig. 2). Based on K = 2 groups, population structure investigation exhibited that all common bean samples were distributed into two major groups. Population structure of common bean relies on binary data obtained using cpSSR markers; it was investigated by Pritchard et al.'s (Reference Pritchard, Stephens and Donnelly2000) method and demonstrated that the log-likelihood approximations increased regularly as K increased and started to decrease when K = 2 [Fig. 2(a)]. A mean log-likelihood plot is prepared by placing values over 10 runs for K values ranging from 1 to 5. The optimum K value was 2 as assessed by the ΔK statistic assessed by STRUCTURE software based on obtained markers data [Fig. 2(b)]. It was observed that the best possible sub-group number was reasonably low as compared to the total studied accessions, exhibited extensive gene flow levels, either presently or historically. At probability threshold (Q) of 0.60 using cpSSR marker's structure analysis, generally the samples were visibly isolated to a definite cluster. Of which, 39 individuals (32.773%) were dispersed among cluster 1 and 76 individuals (63.866%) were found in cluster 2. No clear pattern of allocation of the 4 individuals was obtained among studied accessions in clusters 1 and 2, depending on the threshold of 60% in structure analysis.
(a) Estimation of most possible number of subpopulations based on the delta K value determined using the programme Structure Harvester. (b) Population structure of 119 individuals of 20 common bean accessions concluded from cpSSR markers. Each individual is represented by a vertically colour-coded segment indicating the ideal fraction to the K value = 2.

Relationship among physical and genetic attributes
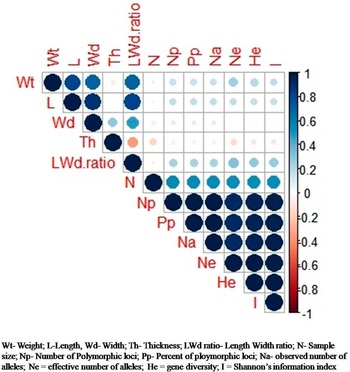
Pearson correlation analysis among the seed physical attributes of common bean accessions displayed a significant (p < 0.05) positive relationship among studied parameters. A significantly positive (p < 0.05) relationship of seed weight was found with seed length (r = 0.813), seed width (r = 0.692) and seed length–width ratio (r = 0.694) using Pearson correlation analysis (Fig. 3). Likewise, seed length exhibits a significantly positive (p < 0.05) relationship with seed width (r = 0.886) and seed length–width ratio (r = 0.825). Although genetic attributes evaluated during the study exhibit relationship with each other, no relationship was observed between all studied physical and genetic diversity parameters in this study (Fig. 3).
Correlogram displaying relationship between physical and genetic parameters of common bean accessions collected from Uttarakhand.

Taxon analysis and marker transferability
Four commonly growing pulse species namely, G. max, M. uniflorum, V. mungo and V. radiata along with common bean samples were evaluated for genetic variability and transferability using cpSSR markers designed for the aforementioned study. In sum, markers displayed polymorphism in the samples and the existence of transferability in the studied samples (online Supplementary material Table S3; Fig. S2b).
Discussion
The Indian Himalayan region is the prime centre of biodiversity, and common bean is one of the extensively cultivated legume crops in this region. Designing seed metering mechanisms, sizing, separating and designing machinery for harvesting, sorting, cleaning, packaging, storing and processing requires considerable understanding of the size and shape features of seeds, such as their dimensions (length, breadth and thickness) (Mazhar et al., Reference Mazhar, Sayinci, Elkoca, Öztürk and Özmen2013; Wani et al., Reference Wani, Sogi, Wani and Gill2017). Large seed results in amplified germination, earlier advent and improved seedling growth. Higher and earlier germination have been seen in the large-seeded cultivar along with increased shoot and root growth of the plant. Additionally, in conditions of inadequate phosphorus supply, seed reserves affect plant nutritional efficiency, including shoot growth and phosphorus uptake (Lima et al., Reference Lima, Santiago, Araújo and Teixeira2005). Prerequisite information on genetic multiplicity of common bean is essential to achieve effective breeding programmes. Among molecular markers, SSR marker is considered accurate and reliable tool to characterize genetic variability among legume crops. The cpSSR markers used to assess 119 individuals from 20 accessions in this study amplified 218 alleles ranging from 8 (AKJ/YB/Khati/37 and AKJ/KK/AR/Natwar/24) to 16 (AKJ/KK/PS/Harshil/18) polymorphic alleles per loci with a mean of 10.9. In the present investigation, the range of alleles falls between the study of Mahajan et al. (Reference Mahajan, Zargar, Singh, Salgotra, Farhat and Sonah2017) in 138 genotypes from Jammu and Kashmir and one variety from VPKAS, Almora (India). Few recent studies such as Ozkan et al. (Reference Ozkan, Haliloğlu, Türkoğlu, Özturk, Elkoca and Poczai2022), Hao et al. (Reference Hao, Song, Cui, Hua, Zhu, Wu, Wang, Chen and Zhang2023) and Catarcione et al. (Reference Catarcione, Paolacci, Alicandri, Gramiccia, Taviani, Rea, Costanza, De Lorenzis, Puccio, Mercati and Ciaffi2023) reported alleles per locus ranging from 2 to 10, 2 to 12 and 2 to 14, respectively, under SSR-based study which are comparable with the present investigation. The study of Valentini et al. (Reference Valentini, Gonçalves-Vidigal, Elias, Moiana and Mindo2018) reported a mean of four alleles per SSR locus when studying the 109 accessions from Brazil, whereas from the genetic assessment of 102 genotypes from Jammu, Kashmir and Ladakh, India, Bashir et al. (Reference Bashir, Bashir, Mahajan, Nazir, Mir, Nehvi and Zargar2020) demonstrated the incidence of 30 alleles per locus of SSR. The reason for a smaller number of alleles as compared to Bashir et al. (Reference Bashir, Bashir, Mahajan, Nazir, Mir, Nehvi and Zargar2020) might be due to the use of chloroplast SSRs in our study, as genomic SSRs can resolve within gene pool variation.
In the present study, the percentage of polymorphic loci ranged from 40 to 80% for different SSR primers with a mean of 54.5% which is approximately parallel to (66.7%) the study of Hegay et al. (Reference Hegay, Geleta, Bryngelsson, Gustavsson, Hovmalm and Ortiz2012). Percentage of polymorphic loci may vary from 0 (Hegay et al., Reference Hegay, Geleta, Bryngelsson, Gustavsson, Hovmalm and Ortiz2012) to 100% (Asfaw et al., Reference Asfaw, Blair and Almekinders2009; Avican and Bilgen, Reference Avican and Bilgen2022). Furthermore, Pp% was found to be 83.33% in an inter simple sequence repeat marker-based study involving 28 accessions from Jammu and Kashmir, India (Dar et al., Reference Dar, Verma and Rehman2016). The present study showed average gene diversity (expected heterozygosity) as 0.213, which is nearly similar to other studies on common bean (Mercati et al., Reference Mercati, Leone, Lupini, Sorgonà, Bacchi, Abenavoli and Sunseri2013; Pratap et al., Reference Pratap, Gupta, Tomar, Malviya, Maurya, Pandey, Mehndi and Singh2016; Mahajan et al., Reference Mahajan, Zargar, Singh, Salgotra, Farhat and Sonah2017). However, expected heterozygosity was observed lower as compared to the investigation of Bilir et al. (Reference Bilir, Özmen, Özcan and Kibar2019) in 102 genotypes from Turkey, the study of Mir et al. (Reference Mir, Choudhary, Bawa, Jan, Singh, Bhat, Paliwal, Kumar, Chitikineni, Thudi and Varhney2021) in 96 genotypes from Jammu and Kashmir (India) and the most recent study of Avican and Bilgen (Reference Avican and Bilgen2022), Ozkan et al. (Reference Ozkan, Haliloğlu, Türkoğlu, Özturk, Elkoca and Poczai2022) and Catarcione et al. (Reference Catarcione, Paolacci, Alicandri, Gramiccia, Taviani, Rea, Costanza, De Lorenzis, Puccio, Mercati and Ciaffi2023) where the expected heterozygosity was approximately 0.6 in SSR-based study. Higher heterozygosity in compared studies is due to the abundant sampling of common bean genotypes which were cultivated in different parts of the world. As stated by Petit et al. (Reference Petit, El Mousadik and Pons1998), haplotypic richness, a more accurate measure of historical demographic changes, was equal to 2.576, indicating a high level of genetic variations in common bean accessions. PIC is the distinguishing ability of a particular marker, predominantly based on alleles per locus and allele frequency in studied germplasm (Mercati et al., Reference Mercati, Leone, Lupini, Sorgonà, Bacchi, Abenavoli and Sunseri2013; Suvan et al., Reference Suvan, Patel and Kumar2019). As stated by Bashir et al. (Reference Bashir, Bashir, Mahajan, Nazir, Mir, Nehvi and Zargar2020), SSR-based PIC values can be exploited to detect the capability of the marker to detect genetic multiplicity. The mean PIC value was found to be 0.615 which was in the agreement with the values 0.692 and 0.634 reported by Mahajan et al. (Reference Mahajan, Zargar, Singh, Salgotra, Farhat and Sonah2017) in Indian germplasm and Matondo et al. (Reference Matondo, Yao, Kyalo, Skilton, Nkongolo, Mumba, Tshilenge and Lubobo2017) in DR-Congo germplasm, respectively. The findings of this study also correspond with the recent studies of Ozkan et al. (Reference Ozkan, Haliloğlu, Türkoğlu, Özturk, Elkoca and Poczai2022), Hao et al. (Reference Hao, Song, Cui, Hua, Zhu, Wu, Wang, Chen and Zhang2023) and Catarcione et al. (Reference Catarcione, Paolacci, Alicandri, Gramiccia, Taviani, Rea, Costanza, De Lorenzis, Puccio, Mercati and Ciaffi2023) which stated average PIC > 0.5. It was found to be lesser than the earlier studies from Mizoram, India (Dutta et al., Reference Dutta, Singh, Chatterjee, Boopathi, Singh and Saha2016) and Jammu and Kashmir and Ladakh, India (Bashir et al., Reference Bashir, Bashir, Mahajan, Nazir, Mir, Nehvi and Zargar2020). The lower PIC values are obtained from closely related genotypes and higher values for genetically distant genotypes. On the other hand, the PIC value in the present study was found to be higher as compared to six traditional common bean varieties studied in Himachal Pradesh, India (Sharma and Singh, Reference Sharma and Singh2014) and 135 genotypes studied from northern India (Gupta et al., Reference Gupta, Zargar, Singh, Nazir, Mahajan and Salgotra2020). Based on the study of Bashir et al. (Reference Bashir, Bashir, Mahajan, Nazir, Mir, Nehvi and Zargar2020), the high level of polymorphism is due to huge diversity among genotypes and selection of highly polymorphic markers. Likewise, Sharma and Singh (Reference Sharma and Singh2014) stated that a marker with a PIC ranging from 0.3 to 0.8 is considered functional for the measurement of genetic differences in the population. PIC value (0.428–0.817) reported in this study indicated that microsatellite markers are considerably useful and possess good discrimination capacity. The PIC value (0.409) of different pulse species assessed in the present study was lower than 0.60 (Suvan et al., Reference Suvan, Patel and Kumar2019) for the SSR marker in black gram and mung bean (0.60) (Pratap et al., Reference Pratap, Gupta, Tomar, Malviya, Maurya, Pandey, Mehndi and Singh2016) and higher (0.199) than soybean (Bisen et al., Reference Bisen, Khare, Nair and Tripathi2015) and more or less comparable (0.50) in gahat (Chahota et al., Reference Chahota, Shikha, Rana, Sharma, Nag, Sharma, Rana, Hirakawa and Isobe2017). Pratap et al. (Reference Pratap, Gupta, Tomar, Malviya, Maurya, Pandey, Mehndi and Singh2016) also stated the higher transferability of SSR markers fraction was transferred from common bean to mung bean which indicates the higher possibility of SSR transfer to other legumes. Previously, it was already established that primer pairs devised for one species can be used for other species of the same genus along with different genera of the same family (Oliveira et al., Reference Oliveira, Pádua, Zucchi, Vencovsky and Vieira2006). This microsatellite attribute is known as transferability or cross-species amplification, which can be explored as a tool to measure the genetic variability of related species or genera. Consequently, variation detected in alleles per loci, heterozygosity and PIC may be credited to the germplasm size and versatility, ecogeographical locations of collected germplasm and number of polymorphic markers used in the study.
The amount of molecular variance studied showed that within population holds large level of genetic variations (99%) as compared to among population (1%). These findings are relatively comparable to the study from Mexico (Gill-langarica et al., Reference Gill-Langarica, Muruaga-Martínez, Vargas-Vázquez, Rosales-Serna and Mayek-Pérez2011), where 93.8% variance was discovered within populations and 0.87 and 5.32% variance among populations within groups and among groups, respectively. Likewise, the study from Ethiopia and Kenya displayed 66% variance within gene pool and 34% among gene pools (Asfaw et al., Reference Asfaw, Blair and Almekinders2009). Somewhat analogous outcomes were also recorded from Jammu and Kashmir (India), where high (75%) within and low (25%) among accessions diversity was detected (Dar et al., Reference Dar, Verma and Rehman2016). The comparative analysis indicates that topographical structure can be the accountable factor for constraining genetic discrimination among populations, which may lead to much superior genetic variation within populations (Gill-langarica et al., Reference Gill-Langarica, Muruaga-Martínez, Vargas-Vázquez, Rosales-Serna and Mayek-Pérez2011). Likewise, in this study, average genetic differentiation (Gst) was found to be 0.264 which was less than 0.41 reported by Zhang et al. (Reference Zhang, Blair and Wang2008). Similarly, gene flow (Nm) was measured to be 1.396 which was less than 2.6 and 3.927 in accessions described by Zhang et al. (Reference Zhang, Blair and Wang2008) and Asfaw et al. (Reference Asfaw, Blair and Almekinders2009), respectively. To estimate the evolution of a particular species, it is important to separate populations according to the geographical location. The unweighted neighbor-joining method categorized collected germplasm into two main groups. Further, the PCoA coordinates showed clear division of genotypes by accessions in the present study. Likewise, population architecture assessment based on Bayesian method exhibited the formation of two sub-populations (K = 2) in our study. The outcomes of the present study support the earlier report published by Choudhary et al. (Reference Choudhary, Hamid, Singh, Khandy, Sofi, Bhat and Mir2017), which states that in the Indian Himalayan Region (north-western), common bean germplasm was made up of two gene pools – Mesoamerican and Andean. Their phaseolin analysis showed two main types of phaseolin – S- and T-type from Indian Himalayan region with the prominence of T-type (Andean) phaseolin in local bean landraces from Jammu and Kashmir. However, other previous studies have separated common bean population into 2–7 sub-populations based on population structure assessment (Valentini et al., Reference Valentini, Gonçalves-Vidigal, Elias, Moiana and Mindo2018; Bashir et al., Reference Bashir, Bashir, Mahajan, Nazir, Mir, Nehvi and Zargar2020; Avican and Bilgen, Reference Avican and Bilgen2022; Catarcione et al., Reference Catarcione, Paolacci, Alicandri, Gramiccia, Taviani, Rea, Costanza, De Lorenzis, Puccio, Mercati and Ciaffi2023; Hao et al., Reference Hao, Song, Cui, Hua, Zhu, Wu, Wang, Chen and Zhang2023). Maternal inheritance characteristics of cpSSR markers make them able to observe changes in population composition in most angiosperms (Angioi et al., Reference Angioi, Rau, Attene, Nanni, Bellucci, Logozzo, Negri, Zeuli and Papa2010). Therefore, they are broadly used in the analysis of population genetics, genetic diversity and evolutionary studies of different plants (Pan et al., Reference Pan, Li, Guo, Wu, Hu and Chen2014). The cpSSR markers may perhaps contribute to distinctiveness, uniformity and stability (DUS) characterization and plant varietal registration, linkage studies, etc. (Cabral et al., Reference Cabral, Soares, Lima, Miranda, Souza and Gonçalves2011; Matondo et al., Reference Matondo, Yao, Kyalo, Skilton, Nkongolo, Mumba, Tshilenge and Lubobo2017). The genetic variations revealed by cpSSR markers in this study established their usefulness for studying other legume crops as well. Genetic diversity demonstrated by these markers will furnish breeders with essential knowledge to be employed in advanced breeding programmes in India for better-quality germplasm selection of common bean.
Conclusion
Information on the distribution of wild and cultivated germplasm of a species is essentially needed to estimate its genetic multiplicity. This study gives the first insights about the genetic diversity, population structure and correlation with physical properties of common bean accessions from Uttarakhand. The proportion of seeds varied significantly across the examined accessions of the common bean, indicating that equipment design would need to be altered for separating, sizing, transporting, packaging and storage of the common bean seeds. They are also crucial for the design of food processing systems and seed drills.
A few common bean accessions have a considerable genetic diversity that has been found and evaluated, which underlines the crop's potential commercial significance for finding beneficial traits in common bean accession from Uttarakhand. Moreover, molecular information from this study can help to safeguard accessions and make it easier to register accessions for public awareness and conservation. In this study, designed SSR markers from the chloroplast portion of the species have displayed high variation that could be utilized in genome-wide association mapping in near future. Thus, genetic resources developed through this study could be utilized by breeders for the large-scale screening and DNA fingerprinting of common bean accessions and other Fabaceae members for conservation and genotypic improvement.
Supplementary material
The supplementary material for this article can be found at https://doi.org/10.1017/S1479262123000606.
Data
All data linked with this manuscript are available within this manuscript.
Acknowledgements
The authors are thankful to Er. Kireet Kumar, Scientist ‘G’ and Co-ordinator, National Mission on Himalayan Studies (NMHS), G.B. Pant National Institute of Himalayan Environment (GBPNIHE). Also, thanks to Professor Sunil Nautiyal, Director, GBPNIHE and late Dr. R. S. Rawal, Ex Director, GBPNIHE for facilities and encouragement. A. K. J. especially thanks Dr. I. D. Bhatt, Scientist ‘F’ & Head, Centre for Biodiversity Conservation & Management (CBCM), GBPNIHE for his constant guidance and support. Help received from members of GRC, GBPNIHE, Srinagar, Uttarakhand is highly acknowledged.
Author contributions
A. K. J. conceptualized and mentored the study. Y. B., H. S. and A. K. J. standardized methodology and conducted the experiments. Y. B. and A. K. J. performed data analysis. A. K. J. contributed to management of resources and funds. All authors contributed to writing – review and editing of the manuscript.
Financial support
This work is supported from the National Mission on Himalayan Studies (NMHS) funded project (NMHS/2019-20/MG_60) under medium grant scheme.
Competing interest
All authors have shown that there are no competing financial gains that may appear to persuade the work reported in this manuscript.
Ethical standards
This manuscript comprises the original work of the authors which has not been previously published elsewhere. This article is not currently considered in other publications.
Code availability
Not applicable.
Consent to participate
Not applicable.
Consent for publication
All the authors are informed and agreed to submit this manuscript to the Plant Genetic Resources Journal for publication.