

Introduction
This paper is about the impact of a passive form of workplace aggression, work harassment, which negatively impacts social service providers such as nurses (Brunetto, Xerri et al., Reference Brunetto, Xerri, Trinchero, Farr-Wharton, Shacklock and Borgonovi2015). Although there is some debate as to whether the label is correct (see Branch, Ramsay, & Barker, Reference Branch, Ramsay and Barker2013; Einarsen & Nielsen, Reference Einarsen and Nielsen2015), harassment generally refers to ‘… acts that repeatedly and persistently aimed to torment, wear down, or frustrate a person, and all repeated behaviors which ultimately would provoke, frighten, intimidate, or bring discomfort to the victim’ (Brodsky (Reference Brodsky1976), as cited in Einarsen, Reference Einarsen2000, p. 382). However, because of the complex nature and substance of the different forms of workplace aggression, researchers and practitioners have not been able to agree on a definition that captures its different forms, and argue instead that an all-encompassing definition is probably not possible (Branch, Ramsay, & Barker, Reference Branch, Ramsay and Barker2013; Einarsen & Nielsen, Reference Einarsen and Nielsen2015). For example, in the Scandinavian bullying literature, harassment is used as a general term to refer to all negative behaviours such as mobbing, bullying, sexual and work harassment, whereas in other countries such as the UK, there is greater debate about the specific meaning of each different type of negative behaviour (Branch, Ramsay, & Barker, Reference Branch, Ramsay and Barker2013; Einarsen & Nielsen, Reference Einarsen and Nielsen2015). For example, in the UK 2010 Equity Act, the term harassment is used in relation to age, disability, gender reassignment disability, race, religion or belief, sex, sexual orientation, marriage and civil partnership, and pregnancy and maternity.
Bullying affects many workplaces, and the research suggests that both males and females can be affected (Einarsen, Reference Einarsen2000; Einarsen & Nielsen, Reference Einarsen and Nielsen2015). However, there is agreement that all types of harassment are negative work behaviours and that they are characterised by a power difference between the perpetrator and victim(s) and all types of harassment result in varying degrees of negative impact(s) on the individual. This paper is about a form of negative work behaviour that differs from physical and verbal bullying, labelled work harassment. Work harassment is a phenomenon that is positioned on a small but growing platform of research (Brunetto, Xerri et al., Reference Brunetto, Xerri, Trinchero, Farr-Wharton, Shacklock and Borgonovi2015; Tummers, Brunetto, & Teo, Reference Tummers, Brunetto and Teo2016; Xerri, Farr-Wharton, Brunetto, & Lambries, Reference Xerri, Farr-Wharton, Brunetto and Lambries2016) and it describes the systemic use of high workloads, coupled with high accountability, within the social services and involving large numbers of frontline staff.
Work harassment differs from the concept of organisational bullying. Organisational bullying refers to how the whole organisation (and the dynamics within) contribute to, and therefore impacts on, the relationship between the bully and the victim (Fox & Spector, Reference Fox and Spector2005; Cilliers, Reference Cilliers2012), whereas work harassment captures prolonged work intensification and excessive accountability directed at many employees, resulting in high workloads (Brunetto, Xerri et al., Reference Brunetto, Xerri, Trinchero, Farr-Wharton, Shacklock and Borgonovi2015; Tummers, Brunetto, & Teo, Reference Tummers, Brunetto and Teo2016; Xerri et al., Reference Xerri, Farr-Wharton, Brunetto and Lambries2016). Dick (Reference Dick2010) argues that it is a type of bullying directed at task completion with excessive accountability. Brunetto, Xerri et al. (Reference Brunetto, Xerri, Trinchero, Farr-Wharton, Shacklock and Borgonovi2015) and Xerri et al. (Reference Xerri, Farr-Wharton, Brunetto and Lambries2016) argue that it differs from bullying because instead of involving isolated victims, it is far more systemic, impacting many employees at the frontline. It is becoming particularly evident in countries such as Australia, USA and the UK where a combination of increased accountability, some of which is linked to professional codes of practices, and under-resourcing have negatively impacted employee work practices (Brunetto, Xerri et al., Reference Brunetto, Xerri, Trinchero, Farr-Wharton, Shacklock and Borgonovi2015; Tummers, Brunetto, & Teo, Reference Tummers, Brunetto and Teo2016). This issue has now been identified as a growing phenomenon facing social service providers such as local government employees and health care professionals more broadly (Brunetto, Xerri et al., Reference Brunetto, Xerri, Trinchero, Farr-Wharton, Shacklock and Borgonovi2015; Brunetto, Shacklock, Teo, Farr-Wharton, & Nelson, Reference Brunetto, Shacklock, Teo, Farr-Wharton and Nelson2015; Xerri et al., Reference Xerri, Farr-Wharton, Brunetto and Lambries2016; Brunetto et al., Reference Brunetto, Xerri, Trinchero, Beattie, Shacklock, Farr-Wharton and Borgonovi2018).
From a management perspective, bullying is caused by three categories of antecedents (individual factors, work group factors and organisational factors); in contrast, work harassment is largely an organisational tool for facilitating work intensification to reduce labour costs (Tummers, Brunetto, & Teo, Reference Tummers, Brunetto and Teo2016). Work harassment is associated with a deliberate organisational drive to achieve efficiency while reducing operational costs, leading to, for example, nurses having to work harder and longer to complete tasks, some of which involve working extra unpaid hours (Diefenbach, Reference Diefenbach2009). However, such strategies are not without consequences.
The provision of nursing services is typically the greatest budget item for hospitals and the retention of nurses is a major concern of all healthcare managers, especially in many OECD countries where nurses are in short supply and training and replacement costs are high (Farr-Wharton, Brunetto, & Shacklock, Reference Farr-Wharton, Brunetto and Shacklock2011). A registered nurse (RN) takes 4 years to complete an undergraduate degree in the UK and it is similar for the USA, although a RN can work as a nurse in the USA with an associate degree (Social Community for Nurses Worldwide, 2018). Whilst poor management practices have been identified as a major cause of increased turnover intentions amongst nurses in Australia, USA and the UK (Brunetto et al., Reference Brunetto, Xerri, Shriberg, Farr-Wharton, Shacklock, Newman and Dienger2013; Brunetto et al., Reference Brunetto, Xerri, Trinchero, Beattie, Shacklock, Farr-Wharton and Borgonovi2018), it is unclear why work harassment continues, especially when previous research has shown it to negatively impact nurse outcomes (Brunetto, Xerri et al., Reference Brunetto, Xerri, Trinchero, Farr-Wharton, Shacklock and Borgonovi2015). For example, Brunetto, Xerri et al. (Reference Brunetto, Xerri, Trinchero, Farr-Wharton, Shacklock and Borgonovi2015) identified the negative impact of work harassment on nurses’ wellbeing and engagement in Australia and Italy and Xerri et al. (Reference Xerri, Farr-Wharton, Brunetto and Lambries2016) found similar findings for local government employees in the USA and Australia. Work harassment causes increased stress levels that potentially increase the incidence of stress-related illnesses. Additionally, in the case of nurses, the impact of work harassment is compounded because nursing work involves caring for the physical and emotional needs of patients when they are likely to be vulnerable, which can be emotionally draining. Recent research on doctors by Petitta, Jiang, & Härtel (Reference Petitta, Jiang and Härtel2016) found that people who are attracted to the caring industries are more likely to suffer from the contagion effect which means that they are drawn to, and tend to be more affected by the patient's negative emotions (fear, sadness, anger), which further contributes to their stress. Hence work harassment compounds the existing difficult work conditions of nurses.
While there are numerous definitions and conceptualisations of employee wellbeing, one definition is that it refers to the emotional health of staff (Brunetto et al., Reference Brunetto, Shacklock, Teo, Farr-Wharton and Nelson2015), and Shuck and Reio (Reference Shuck and Reio2014) used a psychological framework to conceptualise that low wellbeing was associated with burnout for nurses and doctors working in Italian hospitals. Building from this, in this paper we seek to examine the broader impact of work harassment on nurse outcomes. To do this we use two frameworks Social Exchange Theory (SET) (Cropanzano & Mitchell, Reference Cropanzano and Mitchell2005) and Similarity-Attraction (SA) theory (Byrne, Reference Byrne1971) to explain the emerging negative work phenomenon of work harassment.
SET explains work behaviours by arguing that over time, positive interactions between, for example, a supervisor and an employee build trust and respect, and as a consequence, mutual reciprocity develops, which means that the supervisor feels obliged to adequately resource and support the employee and in return the employee reciprocates with higher work outcomes delivering services (Cropanzano & Mitchell, Reference Cropanzano and Mitchell2005). An opposing result occurs when a poor relationship develops, and the employee is likely to simply undertake the work task expected based on the formal employment contract (Lapierre & Hackett, Reference Lapierre and Hackett2007).
The SET argument holds not only for those who have a traditional direct dyadic relationship, but also for those who have indirect relationships because they work in groups that generate normative mutually reciprocal obligations of behaviour (Blau, Reference Blau1964). SET was used by Parzefall and Salin (Reference Parzefall and Salin2010) to conceptualise bullying as a function of poor management; however, as previously noted, the target is usually an individual, and abusive management tends to involve sustained verbal or nonverbal hostile behaviours using threats or humiliation. In the case of work harassment, it can be argued that this results from the poor management of both financial and human resources. Using the conceptualisation of poor management, the supervisor has an integral role in enabling or thwarting work harassment for nurses.
A second way of conceptualising the supervisor–employee relationship is via the SA theory (Byrne, Reference Byrne1971). This theory argues that if supervisors and subordinates share similar beliefs and values, then it is likely to enhance the quality of their relationships and the impact will be even greater than the impact of surface-level similarities, such as age or gender (Kacmar, Harris, Carlson, & Zivnuska, Reference Kacmar, Harris, Carlson and Zivnuska2009). Using SA theory, those employees who have been socialised into a particular profession are more likely to share the values and beliefs of that profession (Farr-Wharton, Brunetto, & Shacklock, Reference Farr-Wharton, Brunetto and Shacklock2011). There is also an added socialising component, in that to be a professional, supervisors are expected to mentor those professionals who report to them. The mentoring expectation exists even when organisational directives dictate a less developmental coaching role and require a more controlling mandate to achieve organisational goals and budget targets (Brunetto, Xerri et al., Reference Brunetto, Xerri, Trinchero, Farr-Wharton, Shacklock and Borgonovi2015; Brunetto et al., Reference Brunetto, Shacklock, Teo, Farr-Wharton and Nelson2015).
Nursing is often associated with being a caring profession and there is an expectation that nurses carry a heavy emotional and physical burden because they are predisposed to empathise with their patients (Petitta, Jiang, & Härtel, Reference Petitta, Jiang and Härtel2016). As each new wave of nurses enters the nursing profession, they are socialised into accepting the associated norm of chronically high workloads. In addition to these heavy workloads, the SA model explains work harassment as the growing acceptance in nursing of the combined impact of increasing organisational demands for operational efficiency, as well as the increased use of legitimacy tools, such as the professional codes of practices. Professional codes of practice expect higher standards of practice and accountability, thus further increasing nurses’ workloads.
We use both a SET and an SA lens to understand the link between the supervisor–nurse relationships, work harassment, wellbeing and turnover intentions for nurses in the USA and the UK. The reason for this research is that whilst both have experienced significant management reforms (Diefenbach, Reference Diefenbach2009), recent research suggests growing differences in how reforms have influenced work practices for different employee types (Brunetto et al., Reference Brunetto, Farr-Wharton, Farr-Wharton, Shacklock, Azzopardi, Saccon and Shriberg2017; Brunetto et al., Reference Brunetto, Xerri, Trinchero, Beattie, Shacklock, Farr-Wharton and Borgonovi2018; Xerri et al., Reference Xerri, Farr-Wharton, Brunetto and Lambries2016). Hence, whilst nurses across these two countries may undertake the same work, the way they work postmanagement reforms may be different. The research question guiding this study is:
RQ1: What are the similarities and differences of the impact of the supervisor–nurse relationship on perceptions of work harassment, employee wellbeing and turnover intentions for nurses in the USA and UK?
Background
The supervisor–nurse relationship
An example of a SET variable is the Leader Member Exchange (LMX) relationship. LMX is a SET variable because its premise is that sustained effective workplace relationships between the supervisor and the employee deliver benefits to the employees, the supervisor and the organisation overall. LMX begins with a positive interaction with the supervisor that triggers a positive response from employees, such that they undertake extra services out of proportion to the initial positive act (Cropanzano & Mitchell, Reference Cropanzano and Mitchell2005). However, LMX theory varies from SET as it is based on supervisors developing different types of relationships with different employees. When the supervisor–employee relationship is based on trust, respect and adequate resourcing, then this insider status ensures that the supervisor also benefits from employee support for his/her ideas. In contrast, outsider status is created by poor interactions such as when nurses perceive that task orders issued by a supervisor are not reciprocated with sufficient support (i.e., work is transactional), and/or are selectively issued to some subordinates but not others (i.e., favouritism amongst subordinates) (Pellegrini & Scandura, Reference Pellegrini and Scandura2008; Dulebohn, Bommer, Liden, Brouer, & Ferris, Reference Dulebohn, Bommer, Liden, Brouer and Ferris2012). Previous research suggests that younger nurses perceive that older nurses receive fairer treatment from older supervisors (Shacklock & Brunetto, Reference Shacklock and Brunetto2012). Over time these conditions erode the supervisor–nurse relationship, and particularly in the case of an unequitable distribution of work tasks, may sit at the heart of their perceptions of work harassment.
Using SA theory (Byrne, Reference Byrne1971), the relationship between the supervisor and the nurse is supported by a socialisation process based on their shared beliefs and values (Kacmar et al., Reference Kacmar, Harris, Carlson and Zivnuska2009). To this end, a generational cohort perspective was shown by Shacklock & Brunetto (Reference Shacklock and Brunetto2012) to explain a better relationship between supervisors and nurses in Australia who belonged to the same cohort, probably because more of the older nurses had similarly undergone on-the-job hospital training rather than attending university. Such a theory would help explain nurses’ acceptance of higher levels of work intensity and increasing work harassment as part of the price of achieving a professional code of practice. However, the theory would also suggest that an effective supervisor would work towards mitigating the impact of increased employee workloads because of their shared professional values. In this way, a supervisor who mitigates the impact of increased workloads is likely to enhance the positive perceptions of employees’ wellbeing, which in turn, reduces their turnover intentions. Turnover intention is used to conceptualise nurses’ intention to leave their job. Hence, the first hypothesis is:
(H1) LMX has an inverse relationship with work harassment, a positive relationship with employee wellbeing, and an inverse relationship with turnover intention for nurses.
Work harassment
Building from Dick's (Reference Dick2010) work, we differentiate work harassment from bullying because it is an organisational tool impacting a large number of employees delivering a social service – such as nurses working with patients. Work harassment has emerged as an issue because of increased fiscal pressure on social services’ (including health care) budgets globally, along with poor management practices in countries like the USA and UK (Diefenbach, Reference Diefenbach2009; Brunetto, Xerri et al., Reference Brunetto, Xerri, Trinchero, Farr-Wharton, Shacklock and Borgonovi2015; Tummers, Brunetto, & Teo, Reference Tummers, Brunetto and Teo2016). However, the concept remains a contested terrain. From a SET perspective, this study has similarities to Parzefall and Salin's (Reference Parzefall and Salin2010) study of bullying because both assume that poor workplace relationships (usually involving a power imbalance) are part of the equation. Employees may perceive that the supervisor is responsible for their workload (and therefore those employees experiencing a poor supervisor relationship may blame their perceived unrealistically high workloads on the supervisor). In reality, resourcing of a department is determined by senior management. Hence, decisions about resourcing and the expected burden on employees generally are deliberately strategic.
Over time, the combined impact of continued poor resourcing coupled with the increasing importance of professional codes of practice may lead to a growing acceptance of work intensification and, in turn, play a part in giving credibility to normalising nursing as a high workload occupation (Brunetto, Xerri et al., Reference Brunetto, Xerri, Trinchero, Farr-Wharton, Shacklock and Borgonovi2015).
In contrast, the SA theory explains the increasing acceptance of high workloads and high accountability in nursing, irrespective of the work context (public, private, NFP), as a function of the evolving values and beliefs associated with the profession. It could be that each new wave of nursing graduates becomes socialised into adopting the higher workloads as part of becoming a nurse. A past study by Brunetto, Xerri et al. (Reference Brunetto, Xerri, Trinchero, Farr-Wharton, Shacklock and Borgonovi2015) suggested that work harassment for nurses negatively impacted employee wellbeing for Australian and Italian nurses, and therefore we expect to see evidence of the same for nurses in the UK and USA. We also expect that high work harassment will be associated with high turnover intention.
(H2) Work harassment is inversely related to employee wellbeing, and positively related with turnover intention.
To qualify this hypothesis, however, using the lens of SA theory, we argue that as nurses and their supervisors are both professionals, unequal task order distribution may not always be interpreted as a form of work harassment underpinning the supervisor–subordinate relationship. Instead, nurses, as part of their job, are professionally required to respond to life-threatening and other non-life-threatening situations as they come to hand, irrespective of whether the response is mandated by a supervisor. As a result, we propose that a mediation relationship exists between nurses’ perceptions of LMX, work harassment and employee wellbeing, whereas work harassment mediates the relationship between LMX and wellbeing. Thus, a nurse may interpret high work demands as either being part of the inherent nature of the profession (because patients heal at different rates) or as work harassment stemming from a poor relationship with the supervisor. Also, there could be a threshold whereupon which too many work demands stemming from the supervisor may be interpreted as work harassment, and hence detract from nurses’ wellbeing.
(H3) Work harassment mediates the relationship between LMX and employee wellbeing.
Employee wellbeing and turnover intention
Employee wellbeing is associated with employees’ feelings of happiness, positive emotions towards their work and undertaking work consistent with their values, but differs from job satisfaction because it includes more than their attitudes and feelings about their job (Grant, Christianson, & Price, Reference Grant, Christianson and Price2007; Farr-Wharton, Shacklock, Brunetto, Teo, & Farr-Wharton, Reference Farr-Wharton, Shacklock, Brunetto, Teo and Farr-Wharton2017). As such, the concept of employee wellbeing includes a wider perception of both tangible and intangible aspects of the work context. Past research shows that employees with high perceptions of wellbeing have higher levels of job-related performance and job satisfaction (Brunetto et al., Reference Brunetto, Shacklock, Teo, Farr-Wharton and Nelson2015). We hypothesise that nurses with higher wellbeing will be less likely to express turnover intention.
(H4) Employee wellbeing is negatively related to turnover intention.
Past research shows that the quality of the supervisor–subordinate relationship and perceptions of bullying are both predictors of turnover (Parzefall & Salin, Reference Parzefall and Salin2010; Brunetto et al., Reference Brunetto, Xerri, Shriberg, Farr-Wharton, Shacklock, Newman and Dienger2013). Results from Brunetto, Shacklock, Teo and Farr-Wharton (Reference Brunetto, Shacklock, Teo and Farr-Wharton2014) show that LMX predicts both wellbeing and turnover intentions for police officers and nurses, and Wright and Bonett (Reference Wright and Bonett2007) found that wellbeing predicted turnover. Because previous research has demonstrated that work harassment predicted wellbeing for Italian and Australian nurses (Brunetto, Xerri et al., Reference Brunetto, Xerri, Trinchero, Farr-Wharton, Shacklock and Borgonovi2015), we expect nurses’ perceptions of work harassment and wellbeing to mediate the relationship between supervisor–nurse relationships and turnover intention (i.e., double mediation model).
(H5) Employee perceptions of work harassment and employee wellbeing mediate the relationship between supervisor–nurse relationships and turnover intention.
Different countries: UK and USA
This study was undertaken on nurses in private sector hospitals of the USA and the UK as the context of nursing in the USA and UK is similar – in that nurses in both countries typically undergo formal education, and there are similar kinds of professional standards with which nurses must comply in order to continue working in the profession. In the USA, 1,060 from a total of 5,686 hospitals are private sector (approximately 1:6) and they tend to be significantly smaller than public sector hospitals (based on the American Hospital Association Annual Survey, 2014). In the UK, private sector hospitals account for 15% of the UK healthcare system, and this figure is growing (Chang, Peysakhovich, Wang, & Zhu, Reference Chang, Peysakhovich, Wang and Zhu2011). Whilst all hospitals are expected to stabilise emergency patients, private sector hospitals have more control in determining the entry of patients and previous research by Brunetto, Xerri et al. (Reference Brunetto, Xerri, Trinchero, Farr-Wharton, Shacklock and Borgonovi2015) of nurses working in private and public hospitals in Australia and Italy identified lower perceptions of work harassment from those working in the public sector hospitals.
Evidence suggests that work harassment is a growing phenomenon in social service provision – not just in the healthcare sector (see Mänttäri-van der Kuip, Reference Mänttäri-van der Kuip2016; Travis, Lizano, & Mor Barak, Reference Travis, Lizano and Mor Barak2016). In particular, the rise of work harassment appears to have paralleled the rise of significant management reform as a result of the implementation of New Public Management (NPM) – as is the case for both the USA and the UK (Diefenbach, Reference Diefenbach2009). In particular, one aspect of the reform involved implementing managerialism, which refers to the adoption of an array of private sector management tools aimed at improving organisational efficiency (Pollitt & Bouckaert, Reference Pollitt and Bouckaert2017). However, the impact of reforms has NOT been uniform, even in those countries that have similarly implemented significant reforms. For example, a comparative study of nurses working in the UK and Australian hospitals found that nurses in the UK perceived less autonomy to control their workloads compared with those in Australia (Brunetto, Shacklock, & Farr-Wharton, 2012). Similarly, in a comparison of police management in Australia, Malta and the USA, US police officers perceived higher autonomy, suggesting that the impact of reforms had not affected them as much as in other countries (Brunetto et al., Reference Brunetto, Farr-Wharton, Farr-Wharton, Shacklock, Azzopardi, Saccon and Shriberg2017). Hence, we expect the perception of work harassment to be higher in nurses in the UK because of the depth and substance of reforms speared on by public sector reform (Diefenbach, Reference Diefenbach2009).
(H6) Perceptions of work harassment are higher for UK nurses.
The study
Aim
A cross-sectional design using surveys was used to examine the relationship between the supervisor–nurse relationship, work harassment, wellbeing and turnover intentions.
Participants and data collection and demographics: (random sample)
To gather data, nurses working in 15 private sector hospitals within England and Scotland were surveyed and 189 from 800 anonymous printed surveys were completed and returned in sealed return-paid envelopes to the researcher (24% response rate) (16 males/173 females). To gather data from the USA, nurses from two private sector hospitals in mainland USA were surveyed and 401 from 1,815 nurses completed a voluntary online survey (22% response rate) (13 males/388 females). With regard to the respondents’ age groups, 9% of the UK sample and 26% of the US sample were aged between 18 and 31 years; 33% UK and 34% USA were between 32 and 46 years; and 58% UK and 40% USA were aged over 47 years.
Ethics
Ethical clearance from both the university and the hospitals was obtained before the projects began.
Data analysis
Samples were checked for normality by assessing the skewness and kurtosis of each item, and all items were within the acceptable thresholds of −2 and +2 (George & Mallery, Reference George and Mallery2010). Further normality testing was conducted through Q–Q plot scanning (Field, Reference Field2013), and yielded no significant deviations from the expected normal distribution.
Survey instruments and measures
We used previously validated scales to operationalise the constructs in the path model. To represent the supervisor–nurse relationship, we modified the LMX instrument developed by Graen and Uhl-Bien (Reference Graen and Uhl-Bien1995) by adding two more questions to capture the professional relationship involving a similarity in professional values and beliefs. An example of an original item from the LMX instrument is: ‘My supervisor is satisfied with my work’. An example of an added item used to operationalise a professional LMX relationship and in line with the SA theory is: ‘My supervisor and I share similar values and beliefs’. Work harassment was one of the three scales developed to capture task-attack, personal-attack and intimidation by Rayner (Reference Rayner2002). We used the three items related to ‘task-directed attack’, including the item, ‘[This hospital] sets unrealistic targets’. Employee wellbeing was assessed using the four items of Brunetto, Farr-Wharton, and Shacklock (Reference Brunetto, Farr-Wharton and Shacklock2011). An example item includes: ‘Overall I am reasonably happy with my work life’. Turnover intentions were measured using the three-item scale adopted from Meyer, Allen, and Smith (Reference Meyer, Allen and Smith1993), including ‘I frequently think about leaving my current employer’.
Validity and reliability
The scales were tested for reliability and discriminant validity using exploratory and confirmatory factor analysis for both sample groups (i.e., UK and USA). The reliability indicators for both groups proved very robust, with all composite reliability scores above the required .7, and the average variance extracted (AVE) scores above .5 (Hair, Black, Babin, & Anderson, Reference Hair, Black, Babin and Anderson2010). The discriminant validity was also shown to be robust, indicated by the maximum-shared variance (robust when less than the AVE), and the interconstruct correlations (robust when correlations between variables are <.7). The reliability and discriminant validity indicators for both samples are displayed in Table 1.
Reliability and discriminant validity indicators

CR=composite reliability; AVE=average variance extracted; MSV=maximum shared variance.
Design
A group invariance approach to Structural Equation Modelling (SEM) was used to examine the difference between UK and US nurses’ experiences with work harassment (Byrne, Reference Byrne2010). This approach in SEM provides a very powerful method for examining whether sets of modelled constructs present differently (factorial equivalence), and/or are distributed differently (latent mean equivalence), and/or are pathed differently (causal equivalence), across two or more sample groups (Byrne, Reference Byrne2010). The SEM invariance analysis was undertaken using the AMOS 22 software package. The proceeding sections outline the results of these analysis processes.
Results
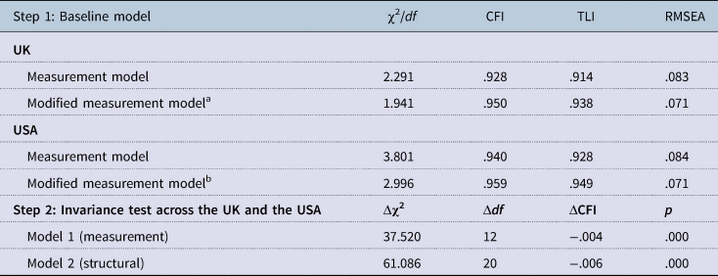
The factorial equivalence for the UK and US samples using SEM is assessed by loading all observed items onto their respective latent constructs in a covaried structure model for the two samples, followed by an examination of the goodness-of-fit differences between the two groups. The factor equivalence is appropriate when the difference between the corrected fit index (CFI) of the measurement model for the two groups is ‘≤−.01’ as long as the CFI is over .9. We assembled the measurement model for the constructs LMX, work harassment, employee wellbeing and turnover intention. The modifications indicesFootnote 1 for both samples’ models indicated that the goodness-of-fit indices would benefit from a covariance between the two items in the LMX scale (‘my supervisor is satisfied with my work’ and ‘my supervisor would be willing to ‘bail me out’ at her/his own expense’). Hence, we applied this covariance for both models, and ran the factorial difference test. Displayed in Table 2 (below), the CFI for the UK sample was .950, and the CFI for the US sample was .959 (Δ = .009). After factoring in the larger sample size of the US group, there was evidence of factorial invariance between the two samples’ models.
Results of model-fit and test of invariance

a Common variance was approximately 19%.
b Common variance was approximately 22%.
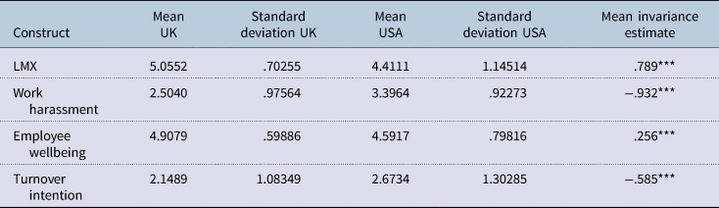
To examine the difference in the distribution (latent means) of the constructs across the two samples, we compared the latent mean estimations of the constrained UK sample against the freely estimated US sample (as prescribed by Byrne (Reference Byrne2010)). The results indicated significant differences in the distribution for each of the latent constructs for the US sample against the UK sample. The latent mean invariance model testing had appropriate fit, where the χ2/df was 2.803, CFI was .940, TLI was .933 and the RMSEA was .055, all of which were within commonly accepted thresholds (Ping, Reference Ping2004). The results are displayed in Table 3.
Results from mean invariance test

UK n = 189, USA n = 401, ***Significant at the .001 level. Mean – ‘1’ = strongly disagree to ‘6’ = strongly agree.
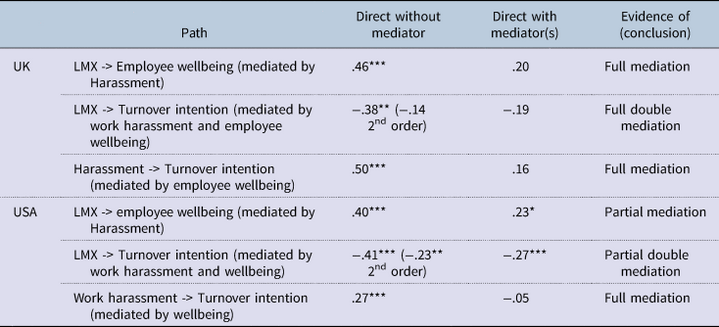
The differences in the hypothesised paths between the UK and US sample using the multiple-group analysis function in SEM had appropriate fit where the χ2/df was 2.281, CFI was .948, TLI was .941 and the RMSEA was .047. We tested for mediation paths (Baron & Kenny, Reference Baron and Kenny1986) and found that a significant path is present between the dependent and independent variable in the absence of the mediator, and this significance disappears or is weakened by the inclusion of a mediator, hence mediation is evidenced (full mediation for UK sample and partial mediation for US sample). Table 4 (below) highlights the results of the mediation testing.
Results from mediation testing

Model comparison
While the paths between the other factors appear somewhat comparable, Byrne (Reference Byrne2010) recommends that χ2 and degrees of freedom (df) scores be compared between unconstrained, measurement and structural iterations of the model to examine if the models for each group are significantly different. As noted in Table 2 (above) the difference between the χ2 and df scores for the models was significant (p < .001). This result indicates that the structure model of LMX, work harassment, wellbeing and turnover intention is significantly different for UK and US nurses. This means that nurses undertaking similar job tasks perceive a different work environment, particularly a different LMX relationship and perception of work harassment in the two countries.
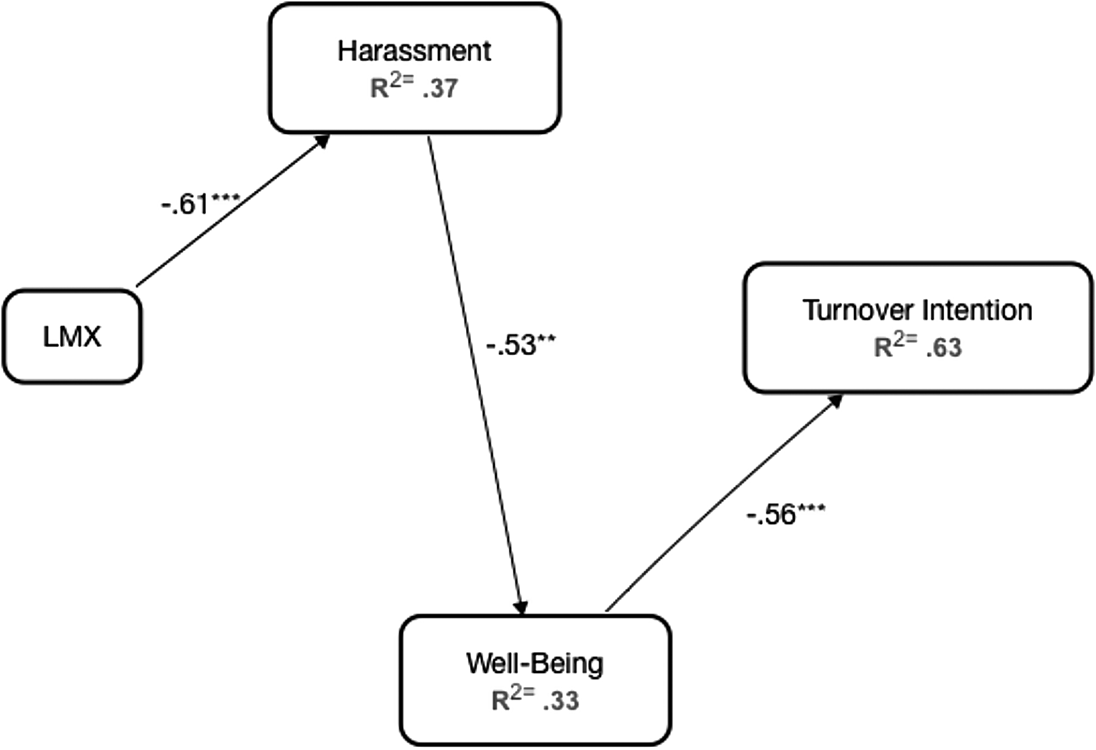
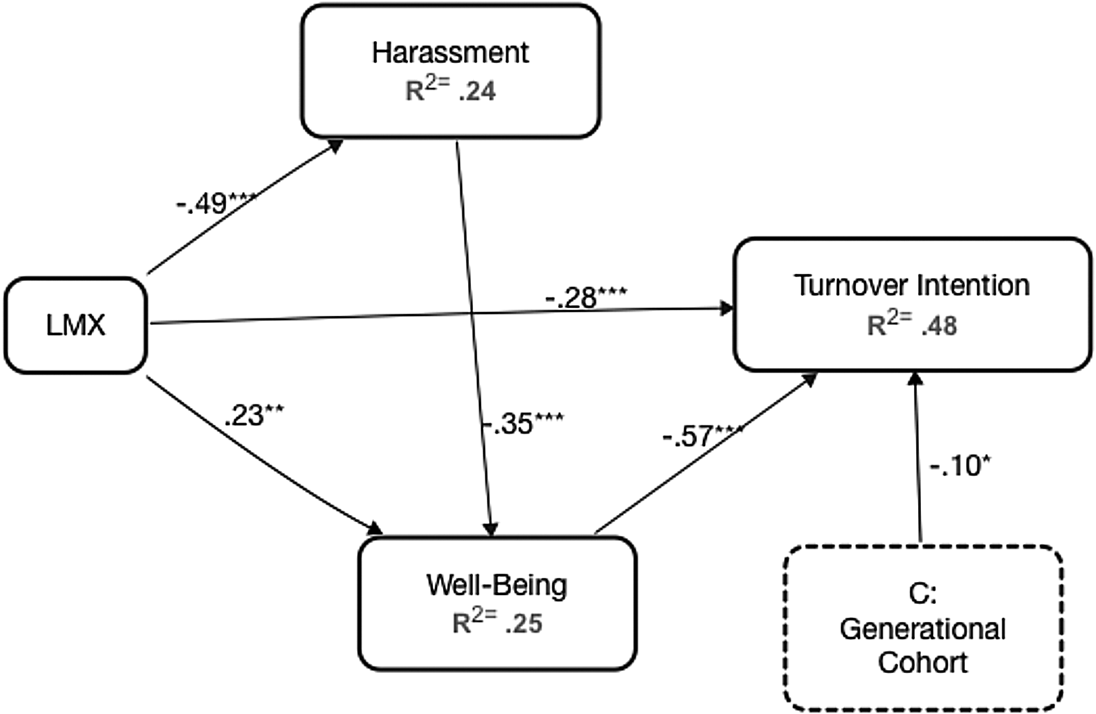
Work harassment is higher in the US group (Table 2) which was not expected; however, the path model indicates that the relationship between LMX and work harassment is stronger for UK nurses (−.61***, r 2 = .37) in comparison to US nurses (−.49***, r 2 = .24). This indicates that managers in the UK play a more pronounced role in mitigating or enabling work harassment. The mediation of work harassment between LMX and wellbeing is different for the UK in that work harassment fully mediated this relationship (meaning that from a nurse's perspective, the supervisor is the key proponent enabling work harassment), but is only partially mediated for the US case. Also, the predictive power (R 2) of the model was stronger for the UK sample. For example, a third of nurses’ perceived wellbeing and two-thirds of their intention to leave can be attributed to the way the supervisor manages work tasks. For nurses in the USA, the model predicted almost half of their turnover intentions (USA r 2 = .48). Hence, in both cases, the models offer notable insight concerning why nurses form an intention to leave, with the supervisor–nurse relationship either enabling or inhibiting work harassment, and as a consequence, nurses perceived significant impacts on their wellbeing and turnover intentions. The results comparing the paths and squared multiple correlations across the two samples are displayed in Figures 1 and 2.
UK path model. n = 189. *Significant at the .05 level. **Significant at the .01 level. ***Significant at the .001 level. ^^Gender coded as ‘1’ for males, and ‘2’ for females. ^^^Generational cohort as ‘1’ for under 31 years of age, ‘2’ for between 32–46, and ‘3’ for over 47 years of age. #9% of the UK sample, and 26% of the US sample, were aged between 18 and 31 years; ##33% UK and 34% USA were between 32 and 46 years; and ###58% UK and 40% USA were aged over 47 years. &&Control group – age is not significantly related to turnover.

US path model. n = 401. *Significant at the 0.05 level. **Significant at the 0.01 level. ***Significant at the 0.001 level. ^^Gender coded as ‘1’ for males, and ‘2’ for females. ^^^Generational cohort as ‘1’ for under 31 years of age, ‘2’ for between 32 and 46, and ‘3’ for over 47 years of age. #9% of the UK sample, and 26% of the US sample, were aged between 18 and 31 years; ##33% UK and 34% USA were between 32 and 46 years; and ###58% UK and 40% USA were aged over 47 years. &&Control group – age is not significantly related to turnover.

Discussion
This paper used SET and SA theory as a lens for explaining the role of the supervisor on nurses’ perception of work harassment, although the name remains a contested terrain, and their resultant wellbeing and turnover intentions. The context of the study results from decades of under-resourcing in the provision of health services as well as the implementation of professional codes of practice requiring increased reporting and accountability, and a subtle but growing acceptance of work intensification for nurses (Diefenbach, Reference Diefenbach2009; Brunetto, Xerri et al., Reference Brunetto, Xerri, Trinchero, Farr-Wharton, Shacklock and Borgonovi2015). The findings show support for the hypothesised paths explaining nurses’ wellbeing and turnover intention. In particular, work harassment negatively impacted wellbeing, which in turn negatively impacted turnover intentions (see Table 2, above), confirming previous research about the impact of work harassment on employee outcomes (Tummers, Brunetto, & Teo, Reference Tummers, Brunetto and Teo2016; Xerri et al., Reference Xerri, Farr-Wharton, Brunetto and Lambries2016).
Using a SET framework, the findings show that – as predicted – high perceptions of supervisor–nurse relationships were associated with low harassment overall. Parzefall and Salin (Reference Parzefall and Salin2010) had similarly found that effective supervisor–nurse relationships were associated with a low incidence of bullying, using a SET lens. One explanation is that when supervisors respect nurses, they adequately resource them such that less work harassment occurs, and as a consequence, employees experience high wellbeing and low turnover intentions. Such clarification provides support for SET explaining nursing outcomes (Cropanzano & Mitchell, Reference Cropanzano and Mitchell2005).
If the same result is examined using a SA perspective, the findings for the US sample appear to better explain their behaviour. As argued by Kacmar et al. (Reference Kacmar, Harris, Carlson and Zivnuska2009), if supervisors and subordinates share similar beliefs and values, then it is likely to enrich the quality of their LMX relationships. Further, Farr-Wharton, Brunetto, & Shacklock (Reference Farr-Wharton, Brunetto and Shacklock2011) argued that professionals are likely to share similar values and beliefs (in this case about nursing goals and even professional standards) and therefore are more likely to understand the need for increased task demand (especially because of the new focus on achieving safety and quality goals as part of new codes of professional practice), and consequently they are more likely to work together to cope with the increasing workloads.
Additionally, the mediation analysis of the US data provided deeper empirical evidence for disassociating LMX from work harassment, as work harassment only partially mediated this relationship (see Tables 3 and 4, above). In contrast, the path from LMX to wellbeing was fully mediated by work harassment for UK nurses, suggesting that their perception of work harassment could not be separated from LMX. These results qualify our ‘threshold proposition’ above, noting that US nurses were partially able to disassociate task-attack from the LMX relationship in connection to their wellbeing; however, UK nurses did not display this behaviour. Hence, one of the contributions of the findings to the literature is that, unlike bullying, the supervisor is perceived as less of the perpetrator for nurses in the USA, whereas in the UK the findings are similar to those for bullying. Previously, using mainly less sophisticated statistical manipulations, it was assumed that the supervisor was perceived as the main perpetrator of both bullying and work harassment for employees in different countries. Another finding from this research shows that even in a country like the USA, where the levels of bullying are higher overall than in the UK, the supervisor is perceived as less of a perpetrator by nurses, as compared with the UK experience.
Further investigation concerning the reasons for this difference is needed, though as hypothesised, one explanation for this could be that the implementation of managerialism has been more pronounced in the UK context, changing the nature of the supervisor–nurse relationship because of increased managerial power (Pollitt & Bouckaert, Reference Pollitt and Bouckaert2017). This means that the type of management reforms may have been more extensive in the UK compared with the USA. Similarly, a study by Xerri et al. (Reference Xerri, Farr-Wharton, Brunetto and Lambries2016) found that Australia local government employees perceived more work harassment compared with US local government employees. In this case, it would seem that the impact of managerial reforms has gone some way to eroding the association between nurses’ professionalism and their wellbeing in the UK, and instead this relationship is more comprehensively attributed to the supervisor. Thus, our results suggest that UK nurses ‘blame’ their supervisors for work harassment because they fail to resource their departments appropriately. This means that there is less evidence of a professional LMX relationship based on their shared values and beliefs for the nurses in the UK (higher r 2 and full mediation), which indicates that nurses have a greater expectation that the supervisor will provide a buffer for excessive work demands from senior management.
This new information contributes to the body of knowledge about how one type of employee – nurses in two countries perceive the actions of their supervisors. It suggests that the work context (USA vs. UK) is a stronger determinant of how nurses perceive their high workloads, with nurses in the UK perceiving the supervisor as the main perpetrator (or buffer for stopping work harassment), and nurses in the USA perceiving the supervisor as playing a significantly smaller role in their perception of work harassment. In the case of the USA, there is greater support for perceiving work intensification as a growing part of the nursing profession, and not a function of poor management.
Limitations
Cross-sectional data using self-reporting can lead to common method bias generate type I or type II errors. To reduce common method bias, the predictor and criterion variables for both samples were separated, and then using the methods outlined by Richardson, Simmering, and Sturman (Reference Richardson, Simmering and Sturman2009), estimates of common method variance in the data were undertaken with findings of 19% for the UK sample and 22% for the US sample – both within reasonable limits.
Conclusion and implications for supervising nurses
The role of those who supervise nurses is changing because, along with their organisational role as the implementer of policies emanating from above, and their professional role as socialiser of professional values, effective supervisors are increasingly expected to protect their staff by mediating excessively high work demands (Brunetto et al., Reference Brunetto, Xerri, Shriberg, Farr-Wharton, Shacklock, Newman and Dienger2013; Brunetto, Xerri et al., Reference Brunetto, Xerri, Trinchero, Farr-Wharton, Shacklock and Borgonovi2015; Diefenbach, Reference Diefenbach2009). These findings support past research identifying the important role of management in predicting increased turnover intentions amongst nurses in Australia, USA and the UK (Brunetto et al., Reference Brunetto, Xerri, Shriberg, Farr-Wharton, Shacklock, Newman and Dienger2013, Reference Brunetto, Shacklock, Teo, Farr-Wharton and Nelson2015). A SET perspective is that good supervisors provide a buffer from unrealistic work demands from senior management/professional bodies whilst mentoring and socialising new professionals, as argued by Farr-Wharton, Brunetto, and Shacklock (Reference Farr-Wharton, Brunetto and Shacklock2011), and therefore poor management (low LMX) is associated with high work harassment. In the case of nurses in the UK, the supervisor was pivotal in determining their perceptions of work harassment (or not), hence the findings are consistent with past research identifying the trend towards a growing incidence of unrealistic workloads and accountability for professionals in the social services – especially health care (Diefenbach, Reference Diefenbach2009).
The SA perspective was more useful in explaining the LMX relationship for nurses in the USA. In the USA, nurses perceived that the supervisor was less responsible (lower r 2 and only partial mediation) for work harassment, in contrast to the UK (higher r 2, full mediation). The findings suggest that nurses in the USA have been socialised to believe that nursing involves high workloads and so can to some extent disassociate their wellbeing from harassment from the supervisor. However, in all cases, work harassment appears to be a costly way to enhance employee productivity because it has an inverse relationship on employee wellbeing and because it predicts higher turnover intentions. At one level, there are implications for ensuring adequate training based on SET principles for those supervising nurses. Equally, to advance the sustainable managerial capacity of health care organisations, the supervisor–subordinate relationship needs to become disassociated from resource inadequacy-laden task-attack, and the best way to achieve this is through more effective models of nurse resourcing.
Author ORCIDs
Yvonne Brunetto, 0000-0001-7219-0817