


Introduction
Single crystals of ice are known to be birefringent at optical frequencies due to the anisotropy in the permittivity (about 0.2%). Naturally occurring ice, Ih, has hexagonal symmetry and is uniaxial, with the optic axis coinciding with the crystallographic c axis (Reference HobbsHobbs, 1974). It is optically positive, so that the Ordinary ray has a higher velocity than the Extraordinary ray which travels along the slow, or optic, axis. In the high-frequency, very high-frequency and microwave-frequency ranges, the anisotropy in the permittivity of single crystals is also positive and around 1.1% (Reference Fujita and MaeFujita and Mae, 1993; Reference Fujita and MaeFujita and others, 1993; Reference Matsuoka, Fujita, Morishima and MaeMatsuoka and others, 1997).
In an ice sheet, the polycrystalline nature of the ice means that the effective birefringence is determined by the crystal-orientation fabric (Reference HargreavesHargreaves, 1978; Reference Fujita, Mae and MatsuokaFujita and Mae, 1993). A strongly aligned fabric will lead to a strong birefringence. Fabrics evolve to develop characteristic patterns depending on the deformation history (Reference Castelnau, Thorsteinsson, Kipfstuhl, Duval and CanovaCastelnau and others, 1996), so that, for example, near the bed of an ice sheet not too far from a divide there will often be a strong single axis fabric, orientated with the c axis vertical. Some radar reflections from deep within the ice sheet have been ascribed to layers with different fabrics, which have large enough permittivity contrasts to give significant reflection coefficients (Reference FujitaFujita and others, 1999).
Since ice sheets were first sounded by radar, it has been known that they affect the polarization of radio waves (Reference JiracekJiracek, 1967; Reference BentleyBentley, 1975). However, the few systematic studies that have been carried out have analyzed only echo strength, not phase (Reference HargreavesHargreaves, 1978; Reference Woodruff and DoakeWoodruff and Doake, 1979; Reference Yoshida, Yamashita and MaeYoshida and others, 1987; Reference Fujita, Mae and MatsuokaFujita and Mae, 1993). A lengthy procedure is needed to determine polarization parameters in the field if only power can be measured, as both the transmitting and receiving antennae have to be rotated. However, by measuring phase as well, it is possible to construct a polarimetric radar that requires only orthogonalantennae, making it suitable for airborne use. Also, it is possible to simulate from measurements on orthogonal linearly polarized antennae the observations that would have been made at any other polarization state (e.g. different orientations of linearly polarized antenna or even circularly polarized ones).
A simple technique for determining polarization parameters will provide a powerful tool for mapping ice fabrics and determining the scattering properties of reflecting surfaces. If allied with numerical models of ice sheets which incorporate fabric development (e.g. Reference Staroszczyk and MorlandStaroszczyk and Morland, 2000), model predictions of birefringence could be checked by field measurements. Otherwise, inverting polarization measurements to infer material properties is a non-unique problem which requires other assumptions or knowledge for substantive conclusions to be reached. Overall, polarization offers much scope for a new perspective on fabric evolution and understanding the deformation history and dynamics of ice sheets.
In preliminary studies for a proposed polarimetric radar for the British Antarctic Survey, we collected data on Brunt Ice Shelf in February 1999 and on George VI Ice Shelf in December 2000 (Fig.1) using a network analyzer to examine the polarization behaviour of radio waves in ice. We report on the results of these experiments and show that polarization and scattering effects need to be considered when interpreting echo strengths from radar sounding of ice sheets.
Location diagram.

Data Gathering And Processing
The network analyzer was used as a continuous-wave (CW) step-frequency radar with an effective centre frequency of 300 MHz and a bandwidth of 150 MHz. These instruments are widely used in remote sensing as high-resolution, wide-bandwidth radars and have been used to study Svalbard glaciers (Reference Hamran and AarholtHamran and Aarholt, 1993). At 300 MHz the wavelength in air is 1.0m and in ice is about 0.6 m. Both amplitude and phase were measured. On Brunt Ice Shelf, the network analyzer was mounted on a wooden sledge and connected by coaxial cables to two linearly polarized antennae, 2m apart, placed on the snow surface about 3 m away. Thus, sounding was done at near-normal incidence. Using separate transmitting and receiving aerials, the transmitter was placed at one orientation and the receiver rotated a full 180°, in nine separate steps at orientations of 0°,30°,45°,60°,90°,120°,135°,150˚ and 180˚ from a line bearing 120˚ true. This sequence was repeated for the same nine different orientations of the transmitter, giving a total of 81 separate readings. The aerials were turned by hand, and the error in aligning them is expected to be <5°. Each reading took just over 1min to complete, so the complete experiment lasted about 2 hours.
That the experimental configuration did not affect the quality of the results is shown by three lines of evidence. First, the matrix of results shows that there is close correspondence between transmitting and receiving aerials: the same values are obtained by swapping transmitting and receiving aerials, as expected for the basic principle of reciprocity of aerials. Second, the difference between results using orthogonalaerial orientations (0°, 90°) to simulate the other aerial orientations and the measured results at those orientations was within 5˚ for phase and <2% in power. Third, the phase difference between the 0˚ and 180˚ aerial orientations was 180±5°, as expected. This demonstrates that the experimental configuration, procedure and cable handling did not affect the results.
A follow-up study took place on George VI Ice Shelf in December 2000. Here, a total of 13 sites, each about 5 km apart, were visited along an assumed flowline on the ice shelf near the southern ice front. Four sites were revisited after an interval of a few days. At each site, data were collected for parallel and orthogonal transmitter and receiver orientations only, i.e. the equivalent to HH, VV, HV and VH (note that horizontal and vertical do not have any meaning in our experimental situation). At one site, additional data were collected at 30˚ intervals over a 180˚ range for both receiver and transmitter orientations.
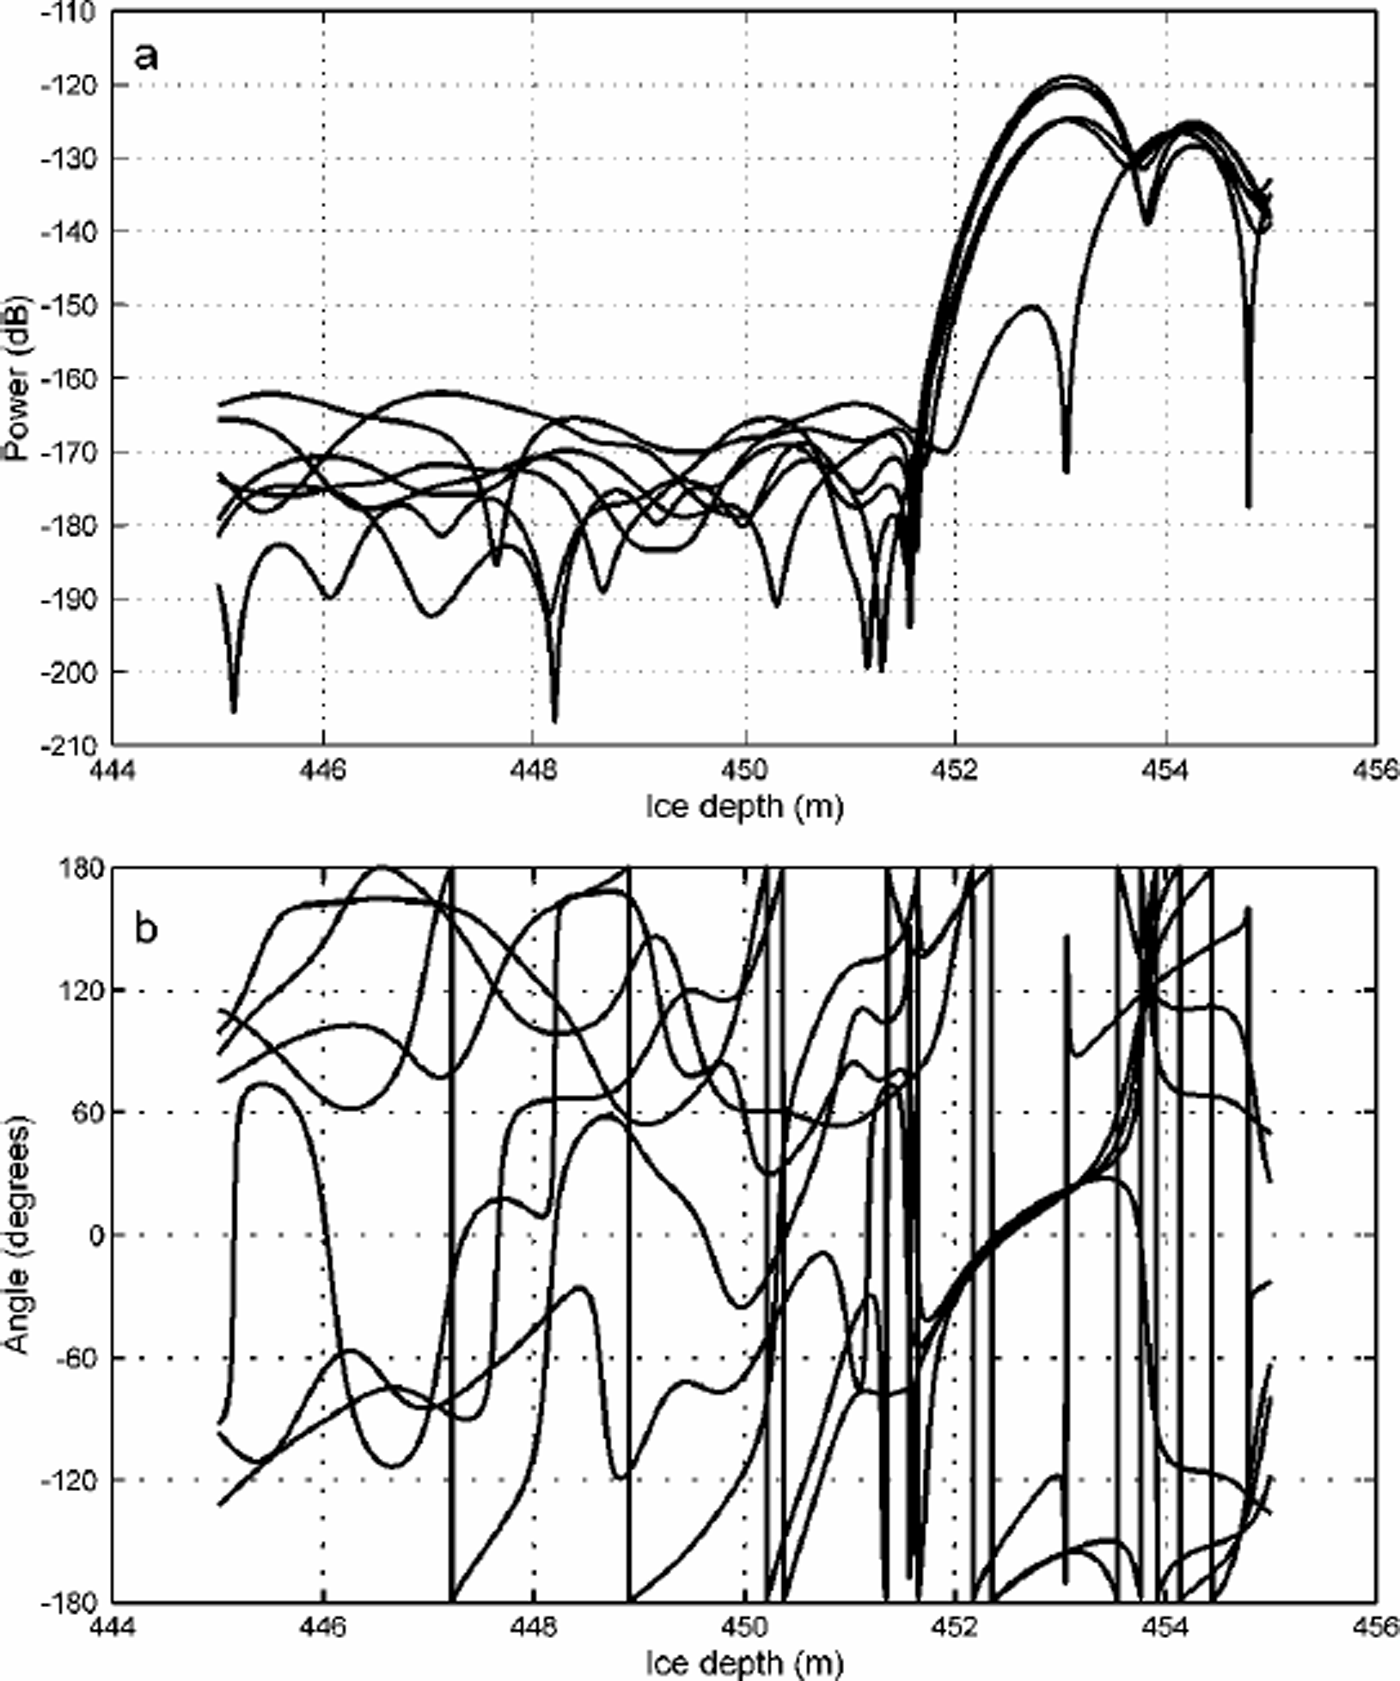
The operational parameters of the step-frequency radar were such that the equivalent band width was150MHz. Transforming the frequency domain data into the time domain by fast Fourier transform methods gives amplitude and phase plots such as those shown in Figure 2. Values for both amplitude and phase can then be obtained for any required time, or equivalent depth.
Plots of (a) power and (b) phase angle for one transmit-terorientation and seven receiver orientations at 30˚ intervals for a site on George VI Ice Shelf. Note how the phase is essentially indeterminate for power levels below about –160 dB; in contrast, the bottom return phase is smoothly varying. The amplitude and phase values in this example were extracted for the depth 452 m.
Data Analysis
We model the ice shelf as a birefringent material, which acts to impart a phase shift δ/2 on a radio wave for a one-way trip through it. We assume that the wave has its electric-field components in the x and y directions of a rectangular coordinate system. The near-vertical plane containing the effective optic axis is taken to define the y direction, whose bearing is initially unknown and is one of the variables to be determined. The action of the reflecting surface is expressed by a scattering matrix whose terms could, in general, be complex, indicating a phase change. For simplicity, we assume that the reflecting surface can be described by the (real and positive) ratio r of the reflection coefficients in principal directions, which are taken to be at an angle γ to the optic axis. This is probably the simplest model that can encompass the conditions likely to be encountered on an ice sheet, and will underestimate the complexity that arises in scattering from a rough surface.
However, with a limited number of observations, we are restricted in the number of variables that can be determined. Scattering from a rough surface is a complicated inverse problem without, in general, a unique solution, so additional assumptions have to be introduced. We continue our analysis and interpretation bearing this limitation in mind.
The behaviour of the received wave in terms of the transmitted one and the properties of the ice and reflecting surface can be expressed concisely in terms of Jones matrices (Reference Clarke and GraingerClarke and Grainger, 1971; Reference DoakeDoake, 1981). This formulation is adequate for completely polarized waves but does not deal with any unpolarized component, when a Stokes vector and Mueller matrix description would be required (Reference Clarke and GraingerClarke and Grainger, 1971; Reference DoakeDoake, 1981). The received wave vector Er(= [ExEy]) at an orientation θ to the optic axis is given by

where the transmitted wave vector is Et = [cosβ,sinβ]and β is the orientation of the transmitting aerial to the optic axis;  is the effect of the birefringent ice acting as a polarizer where δ/2 is the phase shift imparted during a one-way passage through the ice; S (=[1 0, 0 r]) is the scattering matrix for the reflecting surface, where r is the ratio of the reflection/scattering coefficients in principal directionswhose axes are orientated at angle γ to the optic axis; and R(γ) = [cosγsinγ, -sinγcosγ] is the rotation matrix.
If the measurement reference frame (x' , y') used in the field to orientate the transmitting and receiving aerials, is aligned at an angle ε to the x axis, as shown in Figure 3, then the relationship between the angles β and θ and the measurement frame is given by
Relationship between coordinate systems for field measurements, reflecting surface and optic axis. Tx is the orientation of the transmitting aerial; Rx the orientation of the receiving aerial.


Substituting these expressions in Equation (1) gives an expression connecting the unknowns to be solved for: ", δ, γ and r. The observations give Ex0 as a function of β 0 and °0.
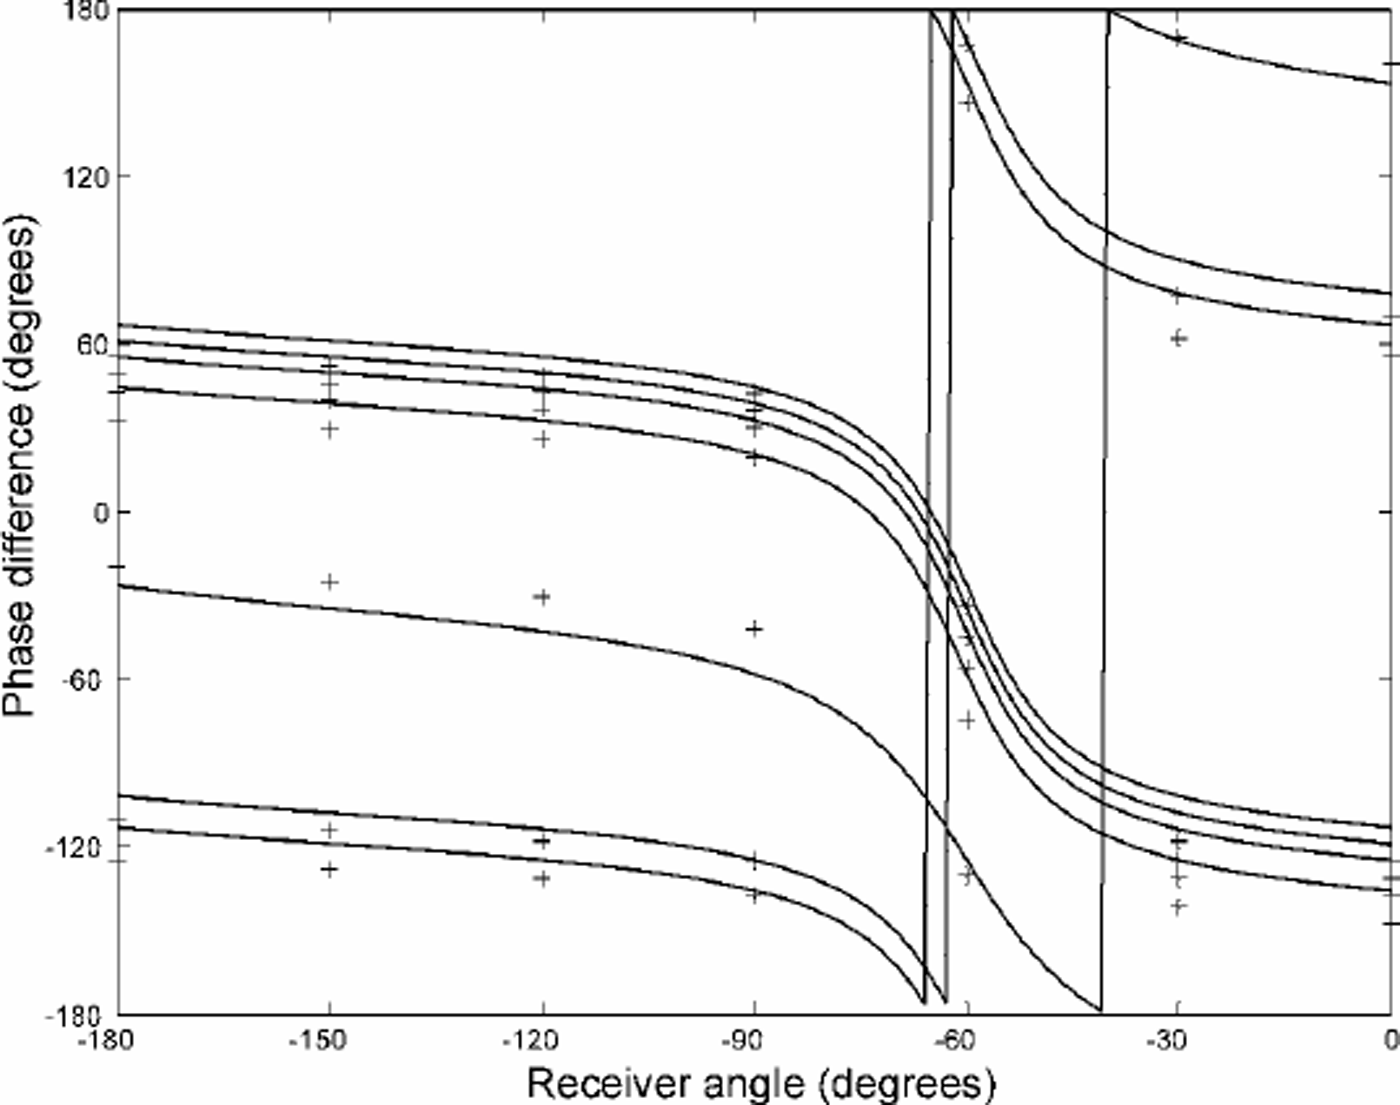
A parameter search method was used to fit the observations of phase to theoretical curves generated by Equation (1). Data from the four observations at parallel and orthogonal polarizations on George VI Ice Shelf were first used to simulate observations at 30˚ intervals, giving a total of 49 phases to use in the optimization procedure. The reason for doing this is that the phase behaviour is complex and can show large variations at certain orientations, so a more uniform spread of values is expected to give a more accurate fit. A search function was defined as the sum of the squares of the differences between the observations and theoretical phases for a given set of parameter values. The values of the parameters corresponding to the minimum of the search function were chosen to be the best-fit values for that particular site. An example of how the theoretical curves fit the phasemeasurements at a typical site is shown in Figure 4. In general, the resolution in the parameters chosen for the optimization procedure was 10˚ for the angles, and either 0.1 (Brunt) or 10 (George VI) for r. Note that from the definition for r, there is an ambiguity between r and its reciprocal, which is tied up with a 90˚ difference in the definition of the direction of the optic axis. Values of r close to unity express an isotropic reflecting surface, while r much greater or less than unity (but still positive) suggests an anisotropic reflecting surface.
Example of fitting theoretical curves of phase to measurements (crosses) for a site on George VI Ice Shelf.
Because of the simplicity of the model, we do not have formal error estimates, but suggest that the best-fit values lie within the resolution of the parameters given above. Most of the sites gave a clear single minimum in the search function, suggesting that the fitted parameters were well constrained. For some of the sites on George VI Ice Shelf, the best-fit value for r tended to infinity. Generally this behaviour was associated with a greater indeterminacy for the value of δ.
Discussion Of Results
The main assumptions we make are that the waves are monochromatic and fully polarized. In reality, most ice sounding radars use a finite-bandwidth pulse reflecting from a rough surface with transmission through an inhomogeneous medium. Reference HargreavesHargreaves (1977) has suggested that as long as the radar pulse exceeds a minimum length the complex behaviour that might occur when pulses are reflected from a rough surface (Reference Nye and BerryNye and Berry, 1974) may be neglected. However, this suggestion assumes a scalar instead of a vector nature for electromagnetic waves, and it is not certain in the theory for the latter (Reference Nye and HajnalNye and Hajnal, 1987; Reference Berry and DennisBerry and Dennis, 2001) whether this neglect is justified. Indeed, some of the structure seen in the amplitude and phase records (Fig.2) can be interpreted as evidence for the generic structural features, such as dislocations, predicted by Nye and co-workers. One of the reasons for choosing an ice shelf to carry out polarization studies was to obtain as smooth a reflecting surface as possible. We suspect that internal layers, as used by Reference HargreavesHargreaves (1977, Reference Hargreaves1978) and Reference Fujita, Mae and MatsuokaFujita and Mae (1993), will present at least as rough a surface as a melting ice-shelf base, although Hargreaves (1977) suggests that the internal layers are smoother than the bedrock over his site in Greenland. Reference FujitaFujita and others (1999) showed that the received power was proportional to the power reflection coefficient not only for the case of a smooth interface but also for scattering from a slightly rough surface which is better described by Kirchhoff scattering or the small-perturbation method (Reference Ulaby, Moore and FungUlaby and others, 1982). In general, both the ordinary and extraordinary waves will be affected in the same way by a reflecting surface. The polarization will be altered because the direction of travel is reversed, but this is the same as being reflected along a diameter in the Poincare ¨ sphere representation of the polarization state (Reference DoakeDoake, 1981).
Reflecting surface
The obvious difference between the results from the two ice shelves is that on Brunt Ice Shelf the value of r is near unity, while on George VI Ice Shelf the values of r are generally 10–100. Large values of r (or small ones, close to zero) mean that there is a strong anisotropy in the reflecting surface. While it is difficult to know how to validate the results from only a single site such as the Brunt, on George VI Ice Shelf where we have a series of sites along a presumed flowline we can see that there is a recognizable pattern in the behaviour of both the reflecting-surface axis and the optic axis. Figure 5 shows the variation of the bearing of the optic axis and the reflecting-surface axis as a function of distance going upstream along the flowline. Both in general follow the flow direction, but there is a small systematic divergence between them along the profile. Our preliminary interpretation is that the optic axis has been frozen in to the ice and rotates with the ice movement. The roughness of the reflecting surface, though, is controlled by oceanographic processes, whereby strong melting (Reference Bishop and WaltonBishop and Walton, 1981) creates a fluted structure which acts as a diffraction grating. This would explain the strong anisotropy in the scattering/reflection coefficient. The direction of the reflecting-surface axis will be controlled by the oceanographic currents, which will differ from the ice-velocity direction.
Bearing of optic axis and reflection surface axis on George VI Ice Shelf. Distance is measured from the westernmost site.

Even though we are unable, with only the polarization data, to describe unambiguously the reflecting surfaces, the fact that we can identify differences is important. Collecting data, say from aerial surveys over large areas, should allow the reasons for anisotropy to be understood better and linked to physical processes.
Birefringence
The measured birefringence (phase difference) is the vertically integrated effect of the fabric. There is not the same clear variation of phase with distance along the flowline on George VI Ice Shelf as there is for the direction of the optic axis or reflecting surface. This is attributed to the phase behaviour being dominated by the highly anisotropic reflecting surface in the optimization procedure, as described above, and therefore prone to a larger error. However, the values for δ are 160–350˚ and follow an increasing trend with distance away from the ice front.
The effective birefringence in the ice is related to the anisotropy in the permittivity by the relationship

where H is ice thickness, λ0 is the wavelength in air, δ is the phase difference measured after a two-way journey through the ice and n is the refractive index  Then

and  Taking ε = 3.17 (i.e. n = 1.78) gives the values in Table 1.
Anisotropy in permittivity at three ice-shelf sites

These values give the minimum value for the anisotropy, as there could be additional phase differences of integer multiples of 360˚ in the value for δ. Therefore, either the anisotropy on Brunt Ice Shelf (at Halley) is about 1/4 that on Bach Ice Shelf or, if the anisotropy is the same, there is an extra 360˚ in the phase difference. At the upper end of the possible scale on George VI Ice Shelf, values are comparable with the lower estimate on Brunt Ice Shelf.
Power
For both ice shelves, the variation of received power as a function of orientation for a fixed transmitting direction is a classic dumb-bell shape (Reference Woodruff and DoakeWoodruff and Doake, 1979; Reference DoakeDoake, 1981). However, simulating the power received by parallel transmitting and receiving aerials shows very different behaviour patterns. On Brunt Ice Shelf, where r is close to unity, the behaviour is controlled by the birefringence and the direction of the optic axis. Twomaxima and minima are seen in a rotation of 180°, and the directions of the extremes are related to the direction of the optic axis (Reference HargreavesHargreaves, 1977). The variation in power is around 20 dB. In contrast, there is only one maximum and one minimum in a 180˚ rotation on George VI Ice Shelf, where the variation in power is almost 30 dB. There, the bearing of the minimum power is close to the direction of the principal axis of the reflecting surface, with the maximum power received in the direction orthogonal to the assumed fluted basal surface.
Avariationin echo strength with antenna orientation has been known for a long time (Reference JiracekJiracek, 1967; Reference BentleyBentley, 1975). The difference in power can exceed 20 dB for values of birefringence approaching 180˚ and r near unity, or for a highly anisotropic reflecting surface (see equation (7a) in Reference HargreavesHargreaves (1977), or equation (17a) in Reference DoakeDoake (1981)). However, the implications have been largely ignored for normal ice sounding. Interpreting variations of echo strength, collected either with a single aerial or with parallel transmitting and receiving aerials, purely in terms of reflection coefficients, could lead to misleading conclusions unless care is taken to allow for polarization effects. It is not clear, for example, how the results either of Reference Bentley, Lord and LiuBentley and others (1998) on the nature of the subglacial bed in West Antarctica, or of Reference FujitaFujita and others (1999) on their ability to distinguish between conductivity-and permittivity-based internal reflections, might be affected by the birefringence of the ice sheet.
Crystal-orientation fabrics
We have no data on ice fabrics from either Brunt or George VI Ice Shelf to provide a check on our results. Analysis of ice cores from near the front of Filchner–Ronne Ice Shelf shows fabrics are random in the upper part and change lower down to being in a vertical plane normal to the flowline in both the meteoric and marine-ice layers (Reference Eicken, Oerter, Miller, Graf and KipfstuhlEicken and others, 1994). They explain the distribution by c-axis rotation through basal glide for ice under tension. Observed fabrics in other large ice shelves (Ross, Amery) are of the girdle type, although the distribution may not be uniform, with the c axes concentrated in two or three maxima (Reference BuddBudd, 1972; Reference AlleyAlley, 1988; Reference PatersonPaterson, 1994). The predominant direction of the optic axis on George VI Ice Shelf being parallel to the flow would suggest that the c axes are concentrated in this direction, perhaps as a two-pole maximum superimposed on a girdle.
Given an ice-fabric distribution with depth, we could calculate the effective birefringence (Reference HargreavesHargreaves, 1978), but in the inverse problem we cannot deduce a unique fabric from measurements of the birefringence alone. However, incorporating a description of fabric evolution into ice-flow models would allow the effective birefringence to be mapped out, which could then be checked with measurements.
Conclusions
Our results have shown perhaps two of the extremes of behaviour expected for a polarimetric ice-sounding radar. At one site, on Brunt Ice Shelf, the electromagnetic wave behaviour was controlled by the effective birefringence in the ice, with little contribution from the reflecting surface, which could therefore be assumed smooth at the wavelengths involved (of the order of a metre). On George VI Ice Shelf, however, the behaviour was dominated by a highly anisotropic reflecting surface, although the birefringence was still measurable. A full set of polarimetric data (transmitting and receiving on orthogonal aerials) is required at any one place to characterize both the effective birefringence of the ice and the scattering matrix of the reflecting surface.
Reference HargreavesHargreaves (1977) found that the minimum anisotropy in the top 1200 m of the Greenland ice sheet, averaged over 20 sites near Dye-3 and assuming that r = 1, was 0.028 ±0.001%. A value an order of magnitude lower than that found on ice shelves is not unexpected, as the upper layers of an ice sheet have not experienced the kind of stress regime required to impart a significant crystal fabric.
Polarimetric ice-sounding radars have the capability to examine ice fabrics and their variation with depth, characterize internal and basal reflecting surfaces, and ultimately to generate synthetic aperture images of the base of the ice sheet once the distorting effects of refraction and polarization are properly accounted for. Modern phase-sensitive radars and data processing should allow the potential of radio-echo sounding to become more fully exploited and avoid possible errors when interpreting data on power reflection coefficients gathered from a single antenna orientation.
Acknowledgements
We wish to thank K. Nicholls for helping prepare the radar, and C. Day for assistance in collecting the data. We also acknowledge the referees who kindly helped us to improve the manuscript.



