


Introduction
One of the principal aims in using satellites for glacier monitoring is to identify distinct zones on the glacier surface and to observe their extent and variation over several years (see, e.g., Reference Fahnestock, Bindschadler, Kwok and JezekFahnestock and others, 1993, Reference PartingtonPartington, 1998). A detailed summary on how to identify various such zones can be found in Reference König, Winther and IsakssonKönig and others (2001b). In the present study we concentrate on one particular zone, the superimposed-ice zone. When present, the superimposed-ice zone separates the firn area on the upper part of the glacier from the glacier ice area on the lower part. While glacier ice forms through the gradual metamorphism of snow (firnification), superimposed ice forms by the freezing of meltwater directly onto the glacier surface (Reference PatersonPaterson, 1994). The main period of superimposed- ice formation on Svalbard glaciers is during summer, when superimposed-ice formation follows the retreat of the snowline up-glacier. The superimposed-ice zone consists of accumulated superimposed ice, i.e. ice that has survived one mass-balance year and is still present at the end of the summer-melt season. Superimposed ice may also form in parts of the ablation area of Svalbard glaciers in autumn, as falling air temperatures promote freezing of supraglacial meltwaters, and during winter when short-lived warm events induce snowpack melting (J. L. Wadham and A.-M. Nuttall, unpublished information). Only the accumulated superimposed ice, however, is important for mass-balance purposes.
Since both the glacier ice area and the superimposed-ice area consist of ice, Reference Bindschadler and VornbergerBindschadler and Vornberger (1992) consider it virtually impossible to distinguish these two areas on SAR images. Reference Marshall, Rees, Dowdeswell and AskneMarshall and others (1995), however, report having detected the superimposed-ice zone on Ayerbreen, Svalbard, due to marked differences in surface roughness of bare and superimposed ice on late-summer synthetic aperture radar (SAR) images. In the following, we analyze three distinct zones of backscatter, which are visible on winter SAR images from Kongsvegen and midre Lovénbreen, one of which corresponds to the superimposed-ice zone.
Description Of Study Area
The glaciers Kongsvegen (78°48’N,13˚ E) and midre Lovénbreen (78°53’N, 12°04’ E) are located in the northwest of Spitsbergen, Svalbard, close to the research facility Ny-Ålesund (Fig. 1). Kongsvegen is a surge-type glacier, with a length of about 25 km, an area of 102 km2 and a very gentle surface slope of 0.5–2°.The glacier flows from an ice divide at 800ma.s.l. (above stake 9) down to sea level, where it shares its calving front with the fast-flowing Kronebreen. Kongsvegen has a flow velocity of <4ma–1 (Reference Melvold and HagenMelvold and Hagen, 1998). This is insufficient to transport all accumulated mass to the ablation area and indicates that the glacier may be building up to a new surge (Reference Lefauconnier, Hagen, Ørbæk, Melvold and IsakssonLefauconnier and others, 1999), the last surge having occurred in 1948 (LiestÖl, 1988; Reference Melvold and HagenMelvold and Hagen, 1998). Mass balance on Kongsvegen has been measured annually by the Norwegian Polar Institute since 1987 using nine stakes positioned along the glacier’s centre line (Reference Hagen, Melvold, Eiken, Isaksson and LefauconnierHagen and others, 1999).
The location of Kongsvegen and midre Lovénbreen. The sites on Kongsvegen where ice cores were taken are marked.

Midre Lovénbreen is much smaller than Kongsvegen, with a length of about 5 kmand an area of only 6 km2. Its flow velocity does not exceed 8ma–1. Mass balance on midre Lovénbreen has been measured annually by the Norwegian Polar Institute since 1967.
Further information on Kongsvegen, midre Lovénbreen and other glaciers in the Kongsfjorden area can be found in Reference LiestølLiestøl (1988), Reference Hagen and LiestølHagen and Liestøl (1990), Reference WintherWinther (1993) and Reference Lefauconnier, Hagen, Ørbæk, Melvold and IsakssonLefauconnier and others (1999).
Field Data Collection
The fieldwork was conducted in spring 1999 between 30 April and 14 May, and in spring 2000 between 26 April and 4 May. Snow pits were excavated at mass-balance stakes located along the centre lines of midre Lovénbreen and Kongsvegen. The snow-pit stratigraphy and the nature of the ice surface at the snow-pit base were recorded. Particular attention was paid to the presence of ice lenses within the snowpack. Shallow ice cores, 0.5–1m long, were collected from the base of these snow pits and from a number of additional sites located in between mass-balance stakes on Kongsvegen (see Fig. 1). Cores were sealed in plastic tubing and stored at –20°C prior to analysis. The ice cores were analyzed for their appearance, air and sediment content. Together with snow-pit observations and mass-balance data, these indices were used to determine the presence or absence of superimposed ice at a site.
Superimposed ice has a contrasting air-bubble content to glacier ice (Reference SchyttSchytt, 1955; Reference KoernerKoerner, 1970). The air-bubble content of the former is more heterogeneous due to variations in freezing rate and saturation of the snowpack during superimposed-ice formation (Reference KoernerKoerner, 1970). Typically, ice that forms in the early melt season has a high airbubble content, since freezing is rapid and the snowpack partially saturated with meltwater. Later in the melt season, when the snowpack is more water-saturated and the underlying ice surface is warmer, freezing takes place at a slower rate, giving time for air bubbles to be expelled from melt-waters as they freeze. This gives superimposed ice that accumulates a banded appearance (Reference KoernerKoerner, 1970; Reference Wakahama, Kuroiwa, Hasemi and BensonWakahama and others, 1976). The length of each core was measured, and down-core variations in air-bubble content and appearance were noted. The modal diameter of air bubbles in different sections of the cores was recorded, as was the presence of any sediment horizons. These horizons indicated the presence of a former or the present summer surface. Where sediment was noted at the surface of the core, no superimposed-ice accumulation was inferred. The presence of sediment horizons at greater depths in the cores indicated past or current accumulation of superimposed ice.
Satellite Data
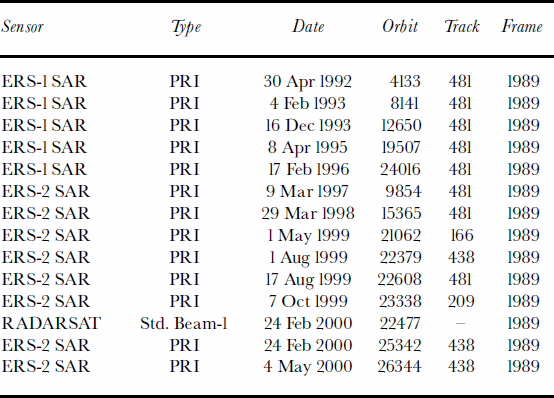
SAR images of the study area were acquired for both 1999 and 2000 (see Table 1). In addition, a time series of winter SAR images since 1992 has been available (Table 1). The European Remote-sensing Satellite (ERS) images were calibrated to absolute backscatter (dB) using the European Space Agency’s (ESA) ERS SARToolbox (available at the internet address http://earth.esrin.esa.it/services/stbx_). The calibration algorithm used in the SARToolbox is described in detail in Reference LaurLaur and others (1998). The RADARSAT image was calibrated using the algorithm implemented in the software PCIWorks version 6.3 (http://www.pcigeomatics.com). A 5-by-5 average filter was applied to all SAR images to remove speckle noise.
All SAR images available for this study (C-band, 5.3 GHz)
On SAR images, points with higher elevation are displaced towards the SAR sensor, causing layover and foreshortening. Geocoding and removal of displacement by layover and foreshortening was done using an algorithmby Reference Guindon and AdairGuindon and Adair (1992), which is implemented in the software PCIWorks. We tested the accuracy of the geocoding process using known ground-control points located on mountain tops. Deviations are 30–300m, with an average deviation of 96m in east–west direction and of 220m in north–south direction. These, however, are values for locations at high elevations and at steep slopes, where displacement is very strong to begin with. For Kongsvegen, having a very gentle slope and almost being flat, we expect an accuracy of around 50–100m.
Results: Kongsvegen
SAR image analysis and comparison with ice cores
In Arctic regions, winter SAR images are generally free from the influence of wet snow which hides the underlying characteristics. All winter SAR images from Kongsvegen listed in Table 1show three distinct zones of backscatter on the glacier surface (Fig. 2). An area of low backscatter (–12.1±1.1 dB for May 2000) around core sites 1 to 4 and 5N, an area of intermediate backscatter (–6.2±1.6 dB for May 2000) around core sites 5S and 5a to 7met, and an area of high backscatter (–0.6±0.6 dB for May 2000) around core sites 7–9. The boundary between the areas of high and intermediate backscatter (black dashed line in Fig. 2) is virtually static between 1992 and 2000. In the same time-frame, the boundary between the areas of low and intermediate backscatter (white dashed line in Fig. 2) varies in location between below core site 4 and core site 5. The May 1999 image (Fig. 2), however, is almost identical to the February 2000 image. While the position of the boundary varies, the backscatter values of the respective zones stay approximately the same in all years. The three zones are also seen on many surrounding glaciers, which are not examined in this study.
ERS-2 SAR images from Kongsvegen from 1 May 1999 and 24 February 2000. Sites where ice-core analysis indicated presence of glacier ice (marked with a circle) coincide with an area of comparably low backscatter. Superimposed-ice core sites (marked by a triangle) coincide with an area of medium backscatter, and firn-core sites (marked by a square) coincide with an area of high backscatter. Note the highly crevassed tongue of the fast-flowing Kronebreen (upper left corner) giving high backscatter. See Figure 1 for geographic information and complete labelling of each core site. The SAR image data were provided by the European Space Agency (© ESA 2000).

The nature of the boundary between areas of high and intermediate backscatter (black dashed line in Fig. 2) has already been examined by Reference EngesetEngeset (2000). Using ground radar data, Reference EngesetEngeset (2000) showed that this boundary corresponded to the lower boundary of the firn area of Kongsvegen, the so-called firn line. This firn/ice boundary inclines very steeply down into the glacier, and, as a result, variations in summer ablation do not cause significant lateral movement of this boundary. Below the firn area, the SAR images show two distinct areas of backscatter within the ice area. Reference EngesetEngeset (2000) reported that this may be due to differences in surface roughness or varying firn extent, but did not have supporting field data available.
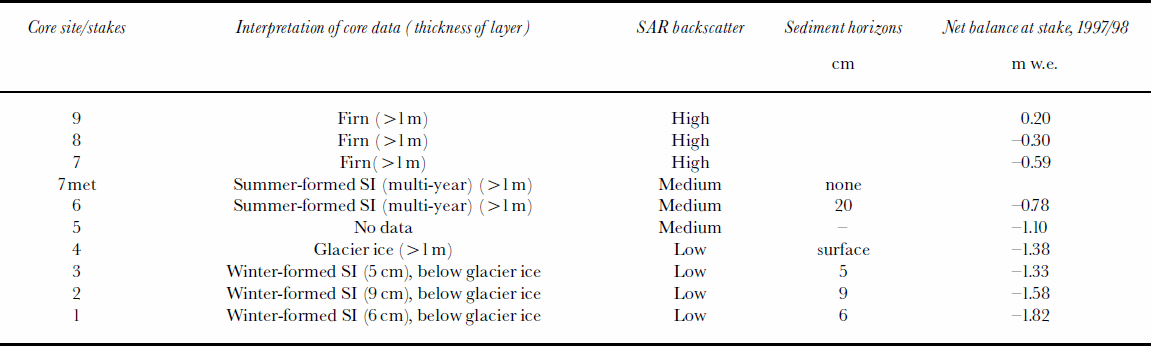
Tables 2 and 3 list the results from our field observations at each core site and the observed SAR backscatter for both 1999 and 2000. A layer thickness of >1m in Tables 2 and 3 means that we retrieved a core of 1m length, which solely contained that particular ice type. The ice-core results are also displayed in Figure 2, where stakes in firn areas are marked with a square, stakes in superimposed-ice areas with a triangle, and stakes in glacier ice areas with a circle. Additionally, photographs from representative ice cores are seen in Figure 3. In both years we find very good agreement between the results from the ice-core analysis and the corresponding SAR backscatter. High SAR backscatter corresponds to the glacier’s firn area, medium SAR backscatter to areas with superimposed ice, and low SAR backscatter to areas with glacier ice.
Photographs of representative ice cores from the firn area, superimposed-ice area and the glacier ice area on Kongsvegen, with photographs from the ice surfaces for the latter two. The average backscatter and corresponding core sites are listed.

Ice-core analysis
Cores in the superimposed-ice area (Fig. 3b) contain a deep layer (usually >1m) of white ice (opaque ice containing many micro air bubbles, <1mm) and clear ice with large air bubbles (around 4 mm, often 41 cm and often elongated along the z axis). In contrast, cores in the glacier ice areas (Fig. 3c) contain clear ice with small air bubbles (1–3mm). A thin surface layer of snow ice (similar to firn but <1year old) or white ice on top of the glacier ice is detected in spring cores from sites 1 and 3 in spring 1999 and at site 1 in 2000, but is not seen on the SAR images. This thin layer is believed to have formed by partial melting and refreezing of the snowpack during warm periods in early winter 1998/99 and 1999/2000, respectively. These events commonly cause snow-pack melting at 5350 ma.s.l. on glaciers in northwest Spits-bergen (Reference Hanssen-Bauer, Solås and SteffensenHanssen-Bauer and others, 1990; J. L. Wadham and A.-M. Nuttall, unpublished information).
All superimposed-ice cores, apart from 7met in 1998/99, were located in areas of net mass loss during the study years. Superimposed ice detected in cores from these areas must either have formed during autumn or winter by refreezing of supraglacial meltwater or be old superimposed ice that was melting out. An autumn/winter formation time is favoured at sites located in areas where the mass-balance data indicate a cumulative net mass loss over the 14 year mass-balance monitoring period. This refers to all cores down-glacier of core site
6. Detection of superimposed ice in non-firn areas where there was a cumulative net gain in mass over the 14 year mass-balance monitoring period but net mass loss during the two study years, is interpreted to be old superimposed ice that is now melting out. This includes core sites 7met and 6 in spring 1999, and 6a, 6b and 6c in spring 2000. Superimposed ice present at sites of net mass gain (e.g. site 7met) during the study years is new superimposed ice formed in these years. Banding of ice facies, such that several white and clear layers of ice are juxtaposed in a single core, or multiple sediment horizons indicated multi-year superimposed-ice formation at a site. Cores at sites 7met and 6 in 1999 and 7met, 6c, 6b and 6 in 2000 all showed evidence of multi-year superimposed-ice formation.
SAR time series from winter 1999/2000
The extent of glacier ice, superimposed ice and firn is identical on SAR images from October 1999, February 2000 and May 2000. Backscatter values along the centre line (following the core sites) are very similar for February 2000 and May 2000, indicating little change in the glacier’s surface characteristics over this time period (Fig. 4). In comparison, the October 1999 image shows lower backscatter in the glacier ice area and some parts with lower backscatter in the firn area (Fig. 4). In the glacier ice area, backscatter in February and May is about 4 dB higher than in October, which is probably due to ice lenses in the deeper February snowpack. The lower backscatter in the firn area, up to 9 dB lower compared to February and May, is seen as a small, darker area in the SAR image. This is most likely due to water in the base of the present year’s firn, which gradually freezes through October; a phenomenon observed in the field in earlier years. Backscatter between the various dates in Figure 4 is somewhat offset compared to each other. Corresponding peaks (or lows) differ in position, where the peaks from one curve in some cases precede, in other cases follow, the peaks from the other curve. This difference is due to resampling during the geocoding process. Deviations are generally well below 100m.
Backscatter along the centre line for winter 1999/2000, following the main core sites (i.e. stakes1–9) marked in Figure 3.

Discussion: Kongsvegen
Superimposed-ice detection
It is obvious that SAR can distinguish firn and ice surfaces. Firn and snow crystals provide a relatively rough material, reflecting much more of the incoming SAR signal than the relatively homogeneous ice. This ability of SAR has been shown in many studies before and is summarized in Reference König, Winther and IsakssonKönig and others (2001b). But why would SAR be able to distinguish superimposed ice from glacier ice? One possible explanation relates to ice air-bubble content. Our spring field observations from Kongsvegen suggest that there is a correlation between differing backscatter from various glacier surface types and the air-bubble contents of surface ice facies (see Tables 2 and 3; Fig. 3). It is noticeable that in areas of medium backscatter there is white ice containing many micro air bubbles (<1mm), and clear ice with large air bubbles (>5–10mm). Both are interpreted to be superimposed ice. In areas of low backscatter, however, there is glacier ice, which in comparison is clear, with much fewer, smaller air bubbles (1–3mm). More of the SAR signal is reflected from superimposed ice having a high air-bubble content than from glacier ice, whose structure is much more homogeneous.
Comparison of results from ice-core analysis and SAR backscatter at each core site for Kongsvegen in spring 1999 (SI, superimposed ice)
Comparison of results from ice-core analysis and SAR backscatter at each core site for Kongsvegen in spring 2000 (SI, superimposed ice)
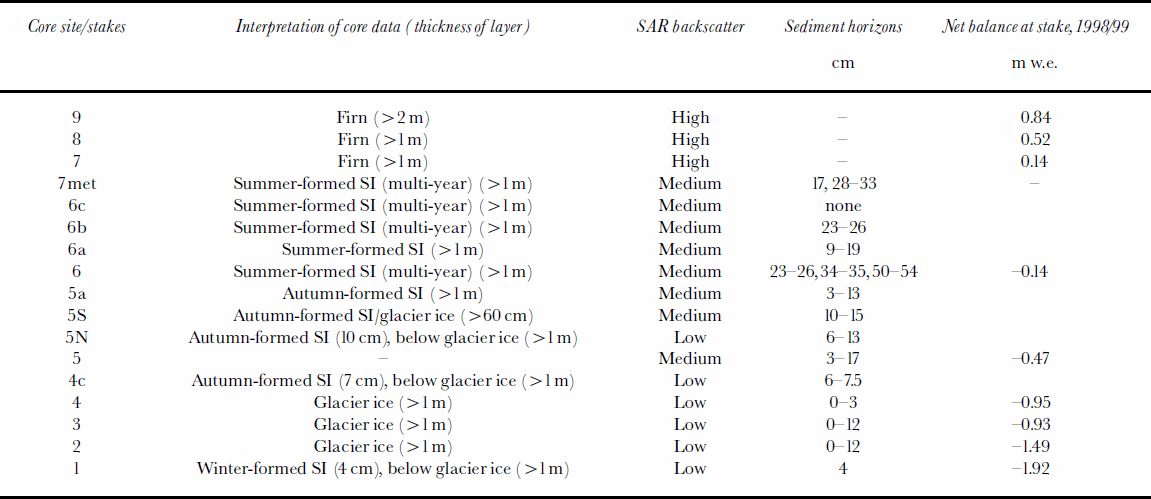
At some core sites, although a thin layer of autumn- or winter-formed superimposed ice is found on top of the clear glacier ice (Tables 2 and 3), the SAR image shows low backscatter (e.g. core sites 1–3 in 1999 and 1, 4c and 5N in 2000). This suggests that a certain thickness of superimposed ice is needed for detection by SAR. Comparing field observations with the SAR images (Tables 2 and 3) shows that superimposed ice is not detected by SAR when the thickness is less than about 10 cm. A simple estimate of the volume-scattering contribution based on Rayleigh scattering (single scattering, sparse medium; see Reference MätzlerMätzler, 1987, p. 310) gives –17 dB for 10 cm of superimposed ice having two bubbles with 5 mm diameter per cubic centimetre (personal communication from H. Rott, 2001). This is even less than glacier ice backscatter, which suggests that the superimposed-ice layer must be considerably deeper than 10 cm in order to be detected by SAR. On the other hand, the surface layer of superimposed ice tends to have smaller bubbles (opaque ice), which would give even lower backscatter. It may be the absence of large bubbles (45 mm) in thin surface layers that mainly causes SAR not to detect thin superimposed-ice layers. Again, for most sites where superimposed ice was detected, the layer thickness was deeper than the drilled core, having a length of 50–100 cm (Tables 2 and 3). It will be shown further below that a 25 cm thick layer of superimposed ice was detected by SARat core site 2 on midre Lovénbreen (Table 4).
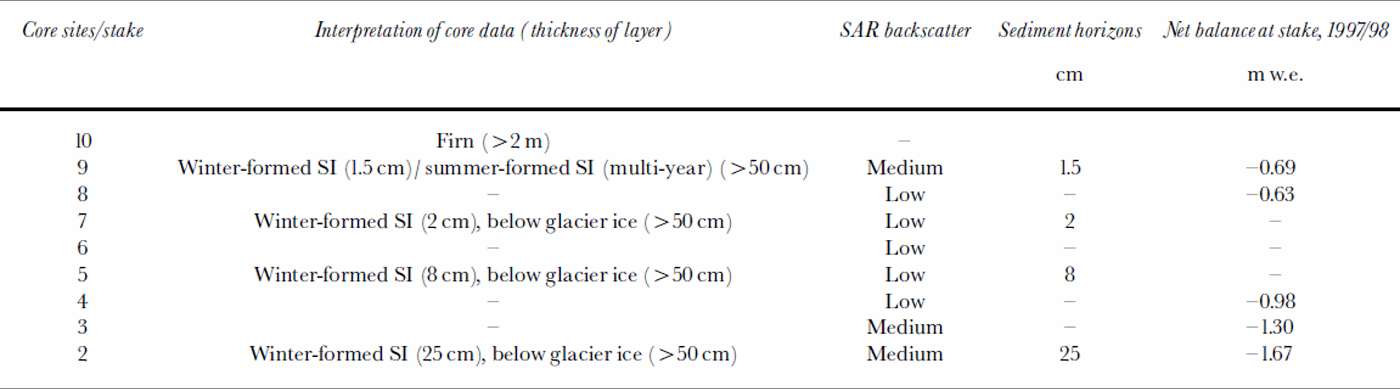
Comparison of results from ice-core analysis and SAR backscatter at each core site for midre Lovénbreen in spring 1999 (SI, superimposed ice)
Our conclusion is that SAR can distinguish superimposed ice from glacier ice due to the contrasting air-bubble content of these two ice types. We do not rule out, however, the possibility that other structural features of the superimposed ice may contribute to the distinct backscatter signal observed in the SAR. Superimposed ice is reported to have a different texture from glacier ice, displaying variation in crystal size and orientation depending on formation conditions (Reference ShumskiiShumskii, 1964; Reference KoernerKoerner, 1970). Thismay also result in differing backscatter between ice types. There are no data, however, to test this hypothesis for Kongsvegen.
Equilibrium-line detection
Superimposed ice is one component of the glacier’s mass accumulation. Together with the firn area, the superimposed-ice zone is within the accumulation area, and the lower boundary of the superimposed-ice zone divides the accumulation and ablation areas, being the equilibrium line (Reference PatersonPaterson, 1994). For Kongsvegen, mass-balance data show that the equilibrium line for 1997/98 (corresponding to the winter 1998/99 images) was at 700ma.s.l., between stakes 8 and 9. The equilibrium line for 1998/99 (corresponding to the winter 1999/2000 images) was at 580 ma.s.l., just below stake 7. Since superimposed ice was recorded at core sites located below these altitudes (see Tables 2 and 3), it is inferred that most of the superimposed ice detected by SAR was in the ablation area and therefore is not accumulated superimposed ice, as discussed above. It follows then that SAR cannot detect the equilibrium line, the lower boundary of the present year’s superimposed-ice zone, since superimposed ice formed in autumn, winter or in previous years can appear below the present year’s extent and cannot be distinguished from net accumulated superimposed ice. This is actually a very similar case to the one presented in Reference König, Winther, Knudsen and GuneriussenKönig and others (2001a). There, the lower boundary of the present year’s snow area, i.e. the snow-line, could not be detected since old snow (firn) from previous years appeared below the snow-line. This failure of SAR to differentiate firn and snow parallels its inability to distinguish between different types of superimposed ice.
Results And Discussion: Midre Lovénbreen
The SAR images from midre Lovénbreen appear coarser in resolution due to the glacier’s smaller size and the different scale of the images. Figure 5 shows midre Lovénbreen from the ERS-2 SAR image taken in February 2000. Just as on Kongsvegen, it is possible to detect an area of lower backscatter (–10.6±1.1 dB) between stakes 2 and 8 and an area of medium backscatter (–5±0.8 dB) at stake 9. The boundary between the two areas is not as clearly defined as on Kongsvegen. An area of high backscatter is hardly visible.
An ERS-2 image of midre Lovénbreen from 24 February 2000. Glacier ice areas (circles) correspond with comparably low backscatter, while superimposed-ice areas (triangle) correspond to medium backscatter. The firn area (square) is located too close to the mountain slope and affected by layover. See Figure 1 for geographic information and complete labelling of each core site. The SAR image data were provided by the European Space Agency (© ESA 2000).

The record of different ice facies observed in ice cores in spring 1999 and 2000 is presented in Tables 4 and 5, respectively. The ice-core data have been interpreted in a similar way to those from Kongsvegen. A lower glacier zone of winter-formed superimposed ice comprising a layer of snow ice overlying a layer of clear glacier ice with few air bubbles is found at sites 2–9 in 1999 and 2–8 in 2000. The snow ice is formed by rapid freezing of a partially water-saturated upper part of the snowpack, while the clear bubble-free ice is formed by slower freezing of a water-saturated slush layer at its base (J. L. Wadham and A.-M. Nuttall, unpublished information). At some sites only clear bubble-free ice was detected. Here, ice layers in the pack replaced the snow ice. Winter-formed superimposed ice at core sites 2–8 was underlain by glacier ice (clear ice with small air bubbles). Multi-year superimposed ice was present in both spring 1999 and 2000 cores at site 9, and an area of firn was present up-glacier of stake 10.
Comparison of results from ice-core analysis and SAR backscatter at each core site for midre Lovénbreen in spring 2000 (SI, superimposed ice)
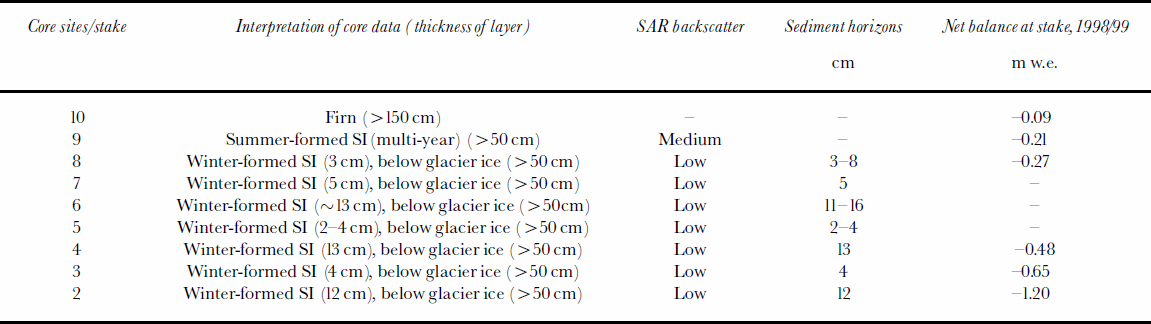
The correlation between zones of different surface types and backscatter is similar to that on Kongsvegen: areas of low backscatter correspond to areas of glacier ice, while areas of medium backscatter correspond to areas of summer-formed/multi-year superimposed ice. Backscatter values for these zones are similar for both Kongsvegen and midre Lovénbreen. The backscatter around stake 10 cannot be determined. Stake 10 is located in the firn area and would be expected to produce a highbackscatter. It is, however, located very close to the mountain slopes, where layover and foreshortening (the areas that appear smeared) obscure the backscatter record.
The layer of winter-formed superimposed ice overlying glacier ice between core sites 2 and 7 and 8 does not appear to be detected by the SAR (e.g. sites 5–7 in 1999 and 2–8 have superimposed ice but a low backscatter). Field observations demonstrated that winter-formed superimposed ice could vary significantly in thickness between sites (1–20cm) but also at any one site over distances of 1–2m. As discussed earlier, it is likely that the thinner layers of winter-formed superimposed ice will be penetrated and therefore invisible to SAR. Only the thicker layers are likely to have an effect on the backscatter. This is seen at core site 2 on the May 1999 SAR image, where 25 cm of winter-formed superimposed ice on top of glacier ice corresponds with a localized area of medium backscatter at the glacier tongue (see Table 4). It may also explain the existence of smaller spots of medium backscatter elsewhere within the area of low backscatter. We have too few data on spatial distribution of winter-formed superimposed ice to make any definite conclusions about this matter. Even then, the spatial variation is generally on a scale much smaller than the geocoding accuracy of the SAR images.
As on Kongsvegen, the superimposed ice that registers in the SAR images on midre Lovénbreen is almost all located in the ablation area, and is therefore superimposed ice formed in previous years which is now melting out.
Conclusions
Our study successfully used SAR winter images to distinguish areas of glacier ice, firn and superimposed ice on two Svalbard glaciers. On winter images from Kongsvegen we find three distinct areas of backscatter which correspond closely to areas of glacier ice, superimposed ice and firn, as determined from ice-core analysis. Our explanation for the differences in backscatter relates to the contrasting air-bubble content of these ice facies. The clear glacier ice has a relatively low air-bubble content, reflecting little of the incoming SAR signal and therefore leading to low backscatter. Superimposed ice typically has a relatively high air-bubble content, which compared to clear glacier ice reflects more of the SAR signal producing medium backscatter. Finally, grain clusters and ice lenses in the firn reflect much of the SAR signal and cause a high backscatter. These three distinct areas are seen on all winter SAR images from Kongsvegen, as well as on some surrounding glaciers. They are seen in all years from 1992 to 2000, but only in 1999 and 2000 do we have field data to demonstrate this connection.
As for midre Lovénbreen, the much smaller size of the glacier and its location close to steep mountain slopes makes interpretation more difficult than on Kongsvegen. Low and medium zones of backscatter are observed and correspond to areas of glacier ice and superimposed ice, respectively. The firn area is not detected due to its location close to the mountain slopes. Extensive but spatially variable accumulations of winter-formed superimposed ice on the lower part of midre Lovénbreen may explain localized areas of medium backscatter in the area of otherwise low backscatter. These are not observed on Kongsvegen, where winter-formed superimposed ice on the lower part is thin (510 cm). This suggests that a certain thickness is necessary for superimposed ice to be detected by SAR. In our study, detected superimposed-ice layers were generally 450 cm thick.
Comparison of SAR results with mass-balance data from Kongsvegen and midre Lovénbreen shows that the superimposed ice detected in the winter images is predominantly located in the ablation zone. This superimposed ice is interpreted to have formed in autumn and winter by refreezing of supraglacial meltwater and slush on to the ablation-zone glacier surface or is superimposed ice formed in previous years, which is now melting out. The equilibrium line, therefore, cannot be detected. This has implications for using SAR in mass-balance studies.
Acknowledgements
We would like to thank H. Sorteberg, S. Tronstad and O. Brandt for their help during the fieldwork. This project is funded by the European Space Agency and the Norwegian Space Agency (PRODEX Implementation Contract No. 13505/99/NL/VJ(IC)), the Norwegian Polar Institute and by the European Commission Training and Mobility of Researchers Programme (NP 98-8 and NP99/1-2), the U.K. Natural Environment Research Council ARCICE thematic programme (GST/02/2192), the Nuffield Foundation Awards to Newly Appointed Lecturers in Science and Mathematics (SCI/180/97/222), the Monica Cole Research Grant from the Royal Geographical Society, the Percy Sladen Memorial Fund at the Linnean Society of London, and the Gino Watkins Memorial Fund at the Scott Polar Research Institute.



