I. INTRODUCTION
High research interest in the ultrahard fullerite (a 3D-polymerized C60), which began in 1994,Reference Blank, Popov, Buga, Davydov, Agafonov, Ceolin, Szwarc and Rassat1 is supported by the recent discovery of solvent effects in the process of C60 3D polymerization.Reference Popov, Mordkovich, Perfilov, Kirichenko, Kulnitskiy, Perezhogin and Blank2–Reference Wang, Liu, Li, Yang, Ding, Sinogeikin, Meng, Liu, Zeng and Mao4 Solvents like m-xylene have a negligible effect on C60 transformations in comparison with the stress-deformation conditions of the C60 sample treatment: the C60 polymerization conditions (in particular, the ultrahard fullerite synthesis) depend essentially on the degree of plastic deformation and stress tensor variation of the sample under compression.Reference Blank, Popov, Buga, Davydov, Agafonov, Ceolin, Szwarc and Rassat1,Reference Popov, Mordkovich, Perfilov, Kirichenko, Kulnitskiy, Perezhogin and Blank2,Reference Popov, Koga, Fujiwara, Mavrin and Blank5,Reference Popov, Kulnitskiy, Blank, Sarin and Nebel6 The sequence and pressure of phase transitions in the solvated C60/m-xylene and desolvated C60 samples are the same,Reference Yao, Cui, Xiao, Chen, Cui, Liu, Cui, Zou, Liu and Sundqvist3 at least under the quasi-hydrostatic loading conditions in a diamond anvil cell. Nevertheless, a carbon phase composed of “ordered amorphous carbon clusters” with a long-range periodic structure can be produced from the solvated C60/m-xylene,Reference Wang, Liu, Li, Yang, Ding, Sinogeikin, Meng, Liu, Zeng and Mao4 contrary to the samples of pure C60 loaded under the same conditions.
In general, quasi-hydrostatic loading conditions do not permit any quantitative comparison of the C60 phase transitions data obtained by different research groups. In Ref. Reference Wang, Liu, Li, Yang, Ding, Sinogeikin, Meng, Liu, Zeng and Mao4, the solvated C60/m-xylene transits to a high-pressure phase which is “ultra-incompressible, with the ability to indent a diamond”, under a 30 GPa phase transition pressure. The Raman spectra of this phase are characterized by a broad band around 1550 cm−1. In Ref. Reference Yao, Cui, Xiao, Chen, Cui, Liu, Cui, Zou, Liu and Sundqvist3, a phase of solvated C60/m-xylene quenched after 44 GPa with the same ability “to indent a diamond” has a Raman peak at 1470 cm−1; the reported pressure of the corresponding phase transition is 20 GPa. For comparison, the 25 GPa pressure point of irreversibility of presumably this phase transformation (3D polymerization of pure C60 which leads to the formation of ultrahard fullerite) under the quasi-hydrostatic loading conditions was reported in Refs. Reference Talyzin7 and Reference Yoo and Nellis8. The Raman spectra of quenched samples after pressure above 25 GPa have a broad band around 1550 cm−1.
The mentioned above discrepancies are explained by a large hysteresis of the phase transitions of C60.Reference Popov, Koga, Fujiwara, Mavrin and Blank5 In Ref. Reference Yao, Cui, Xiao, Chen, Cui, Liu, Cui, Zou, Liu and Sundqvist3, a pressure dependence of the C60 Raman modes was illustrated. It is a typical one for the phase transitions accompanied by the so-called mode softeningReference Weinstein, Zallen and Guntherodt9 (pressure increase does not lead to the mode frequency increase, or even is accompanied by the frequency decrease). In other words, the phase transition has began at a 20 GPa pressure and did not complete at a 44 GPa pressure, according to the data of Ref. Reference Yao, Cui, Xiao, Chen, Cui, Liu, Cui, Zou, Liu and Sundqvist3. Correspondingly, the dependence has no relation to the sample compressibility, as well as x-ray diffraction measurements in Ref. Reference Wang, Liu, Li, Yang, Ding, Sinogeikin, Meng, Liu, Zeng and Mao4 are possibly attributed to the overextended phase transition. A shear deformation application to the C60 sample loaded in a shear diamond anvil cell (SDAC) decreases the hysteresis of the phase transition. The obtained phase of ultrahard fullerite (the pressure of the phase transitions under these conditions is 18 GPa) has a 585 GPa bulk modulus, which was measured from the stress-induced shifts of the Raman mode (around 1550 cm−1).Reference Popov, Mordkovich, Perfilov, Kirichenko, Kulnitskiy, Perezhogin and Blank2,Reference Popov, Kyotani and Koga10
Thereupon, we would like to mention that the appearance of cracks in the diamond anvils described in Refs. Reference Yao, Cui, Xiao, Chen, Cui, Liu, Cui, Zou, Liu and Sundqvist3 and Reference Wang, Liu, Li, Yang, Ding, Sinogeikin, Meng, Liu, Zeng and Mao4 has possibly no relation to the claimed “ability to indent diamond”. Examples, how the indentations in a diamond produced by the samples harder than diamond look like, are given in Refs. Reference Blank, Popov, Buga, Davydov, Agafonov, Ceolin, Szwarc and Rassat1, Reference Popov, Mordkovich, Perfilov, Kirichenko, Kulnitskiy, Perezhogin and Blank2, Reference Popov, Kulnitskiy, Blank, Sarin and Nebel6, Reference Blank, Popov, Lvova, Gogolinsky and Reshetov11, and Reference Blank, Popov, Pivovarov, Lvova, Gogolinsky and Reshetov12. Cracks in diamonds can be initiated even by a soft steel indenter,Reference Brookes and Zhang13 and the essential deformation in the diamond anvils could be produced by a steel gasket compressed between the anvilsReference Mao, Bell, Dunn, Chrenko and DeVries14 or by a stress distribution unfavorable for diamond stability.Reference Popov15
The 3D polymerized phases of pure (without solvent) C60 obtained at room temperature using a SDAC are characterized by the following Raman spectra.Reference Popov, Koga, Fujiwara, Mavrin and Blank5,Reference Blank, Popov, Buga, Davydov, Agafonov, Ceolin, Szwarc and Rassat16,Reference Blank, Buga, Dubitsky, Serebryanaya, Popov and Sundqvist17 The (a) type spectra composed of two broad bands at 1450 and 1560 cm−1 along with broadening and overlapping of the C60 intermediate modes. The (b) type spectra (which are typical for the ultrahard fullerite) composed of a broad band around 1550 cm−1 (a result of broadening and overlapping of the C60 tangential modes) and around 500 cm−1 (a result of broadening and overlapping of the C60 intermediate modes).
A long-term periodicity of the crystal lattice [in particular, a face-centered cubic (fcc) one] could not be possible for the covalently bonded C60 molecules in three dimensions, because a C60 molecule has no 4- or 6-fold axes. For the samples classified as the 3D-polymerized phases of C60 by the Raman spectra, a transmission electron microscope (TEM) study shows a sequence of fcc distorted lattices explained by a bonded C60 chain formation.Reference Popov, Kulnitskiy, Blank, Sarin and Nebel6,Reference Blank, Zhigalina, Kulnitskiy and Tat’yanin18,Reference Blank, Kulnitskiy, Dubitsky and Alexandrou19
The presence of carbon disulfide (CS2) in the C60 samples as an intercalated solvent has a crucial effect on the C60 3D polymerization process. Under the conditions of a large plastic deformation, the fullerite ultrahard phase synthesis [characterized by the (b)-type Raman spectra] realizes at a 6–7 GPa pressure in the presence of CS2, instead of 18 GPa in pure C60.Reference Popov, Mordkovich, Perfilov, Kirichenko, Kulnitskiy, Perezhogin and Blank2 In both cases, the samples plow diamond and the their bulk moduli are 585 GPa. In Ref. Reference Popov, Mordkovich, Perfilov, Kirichenko, Kulnitskiy, Perezhogin and Blank2, the CS2 is considered as a catalyst of the 3D-polymerization of C60. For a comparison, the presence of CS2 in benzene C6H6 initiates also the polymerization of benzene at moderate pressures and temperatures, and the final products have the characteristics of saturated hydrocarbons and element sulfur.Reference Zhou, Li, Men, Gao, Li, Lu and Sun20
If the sulfur atoms remain in the 3D C60 polymerized phases, depolymerization (the reversible polymerization) of the synthesized ultrahard fullerite could be possible under the large plastic deformation applied to the sample during unloading. The depolymerization which was really observed in the present study is different from the reported earlier effect of the reversible polymerization.Reference Talyzin7,Reference Yoo and Nellis8,Reference Wood, Lewis, Bennington, Cain, Kitamura and Fukumi21 In the first case, the phase transition was completed and the sample could be quenched under ambient conditions, while the effect of the reversible polymerization is attributed to the high hysteresis of the phase transition under quasi-hydrostatic loading conditions as discussed above.
II. EXPERIMENT
A high-pressure study on the depolymerization of the C60 3D-polymerized phases was performed by the following sequence of operations. The phases were synthesized in a SDAC from the mixture of C60 with 10 wt% CS2, as well as from pure C60. In the former case, liquid carbon sulfur CS2 was added to the molecular fullerene С60 (the desired amount of CS2 was poured into the С60 powder at room temperature in air). The resulting mixture was triturated in an agate mortar to obtain a uniform consistency and put into a steel gasket. The prepared sample was compressed in the gasket in a SDAC. In the latter case of pure C60, a fullerene powder was put directly into the gasket.
In the SDAC, a controlled shear deformation was applied to the compressed sample by rotation of one of the anvils around the anvil's symmetry axis.Reference Blank, Popov, Buga, Davydov, Agafonov, Ceolin, Szwarc and Rassat16 A detailed description of the SDAC was given in Ref. Reference Blank and Zerr22. A large plastic deformation was applied both to the samples during the synthesis and to the synthesized samples upon unloading to favor the possible initiation of the depolymerization.
The pressure (more precisely, a normal stress component in the sample) was measured from the stress-induced shifts of the Raman spectra from the diamond anvil.Reference Popov23 Thus, the Raman spectra of the compressed sample and the pressure were measured simultaneously in the same point of the sample. To improve a quality of the Raman spectra, the anvils for the SDAC were made from nonfluorescence nitrogen-free synthetic diamonds.
The Raman spectra were recorded with a TRIAX 552 (Jobin Yvon Inc., Edison, NJ) spectrometer, equipped with a CCD Spec-10, 2KBUV Princeton Instruments 2048 × 512 detector and razor edge filters. The optical scheme included a confocal aperture and an objective with a 50x magnification.
Experimental study of the superhard samples performed in a SDAC permits an in situ hardness test in certain cases. A friction coefficient between the compressed sample and the anvils equals to 1 because of the so-called adhesive mechanism of friction under high pressure conditions. Consequently, a shear stress in the sample during the anvils rotation equals to the applied pressure (the normal stress component in the sample). If the sample strength (yield stress) is below the applied pressure, an internal plastic deformation of the sample arises. If the sample strength (yield stress) exceeds the pressure, the sample slides on the surfaces of the anvils. In the latter case, if the hardness of the sample exceeds the hardness of the anvil, the sample plows (scratches) the diamond anvil (which means the sample is ultrahard). We used the above-mentioned hardness test in the present study to verify that the 3D C60 polymerized samples with the (b)-type Raman spectra are ultrahard. The samples ploughed the diamond anvil in the entire region of the ultrahard fullerite phase. An image of the furrows (scratches) on the diamond is presented in Fig. 1. The image was made using a scanning electron microscope (SEM). The size of the scratched area is 130 μm (a culet diameter is 400 μm). The scratches are typical for the in situ hardness test.Reference Blank, Popov, Buga, Davydov, Agafonov, Ceolin, Szwarc and Rassat1,Reference Popov, Mordkovich, Perfilov, Kirichenko, Kulnitskiy, Perezhogin and Blank2
An image (SEM) of the furrows (scratches) on the diamond anvil.

The purity of both fullerene C60 and CS2 used in the study was better than 99.9%. The infrared (IR) absorption spectra were obtained using a VERTEX 80v vacuum Fourier spectrometer (Bruker Optics Inc., Billerica, MA) featuring a HYPERION2000 IR-microscope. A TEM study was done by a JEM 2010 high-resolution microscope (JEOL Ltd., Tokyo, Japan), and a SEM study was done by a JSM-7600F (JEOL Ltd., Tokyo, Japan).
III. RESULTS AND DISCUSSION
According to our previous studies,Reference Blank, Popov, Buga, Davydov, Agafonov, Ceolin, Szwarc and Rassat1,Reference Popov, Mordkovich, Perfilov, Kirichenko, Kulnitskiy, Perezhogin and Blank2 the synthesis (under the conditions of a large plastic deformation at room temperature in a SDAC) of a 3D-polymerized C60 phase with the (a)-type Raman spectra is carried out at a 7–18 GPa pressure from pure C60 and at 4–7 GPa in the presence of CS2. The 3D-polymerized C60 phase with the (b)-type Raman spectra is synthesized at a pressure above 18 GPa from pure C60 and at 6–7 GPa in the presence of CS2.
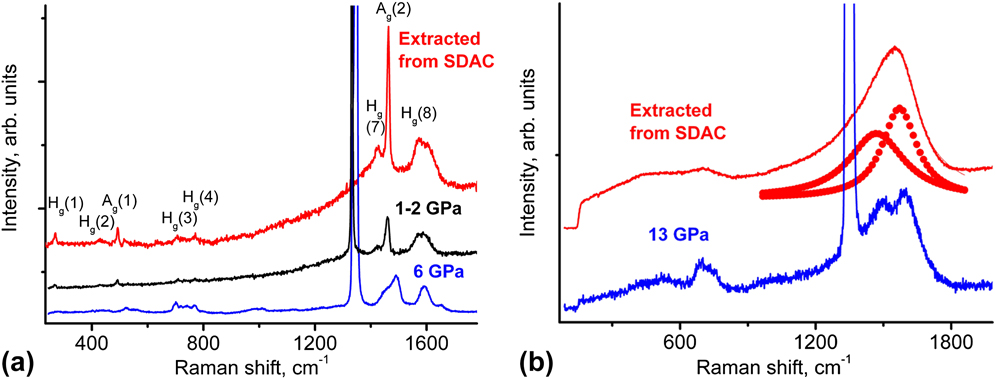
In the present study, a 3D-polymerized C60 sample with the (a)-type Raman spectra was synthesized at a 6 GPa pressure in the presence of CS2. If a large plastic deformation is applied to the sample during unloading, it leads to the depolymerization down to presumably 2D-polymerized C60. The Raman spectra of the sample under a 6 GPa pressure, of the depolymerized sample under 1–2 GPa, and of the one extracted from the SDAC are plotted in Fig. 2(a). The sample was extracted from the SDAC with a gasket: the sample loaded in the gasket without pressure media is normally supported by the gasket edges after its release from the SDAC and is suitable for subsequent manipulations after the pressure treatment (e.g., spectral studies). The pentagonal pinch mode Ag(2) near 1468 cm−1 [i.e., shifted to 1464 cm−1 in the Raman spectra in Fig. 2(a)], and Hg(8) (here it is at 1573 cm−1), Hg(7) (1421 cm−1), as well as breathing and intermediate modes [Hg(1), Hg(2), Ag(1), Hg(3), and Hg(4)] of C60, are present in the spectra of the depolymerized sample. Nevertheless, the mode intensity re-distribution, mode broadening, and shifts observed in the Raman spectra are typical for different dimers,Reference Moret, Launois, Wagberg, Sundqvist, Agafonov, Davydov and Rakhmanina24,Reference Sundqvist25 1D and 2D polymers.Reference Popov, Koga, Fujiwara, Mavrin and Blank5,Reference Blank, Buga, Dubitsky, Serebryanaya, Popov and Sundqvist17,Reference Rao, Eklund, Hodeau, Marques and Nunez-Regueiro26 The spectra are close to those of the so-called O- and T-C60 polymers (according to the classification proposed in Ref. 26).
Raman spectra of the 3D C60 polymerized samples with the Raman spectra of the (a) type under pressure and the one extracted from the SDAC; (a) Raman spectra of the C60 + CS2 sample under a 6 GPa pressure, a depolymerized sample under a 1–2 GPa pressure, and the one extracted from the SDAC; (b) Raman spectra of the pure C60 sample under a 13 GPa pressure and of the one extracted from the SDAC, - an overlapping of the modes at 1450 and 1560 cm−1 gives one asymmetric band around 1500 cm−1 (which can be approximated by a sum of two Lorentzians at 1450 and 1560 cm−1 marked by dots).

When the sample of C60 + CS2 is unloaded without the application of a large plastic deformation, the 3D-polymerized C60 phase with the (b)-type Raman spectra remains upon unloading and can be quenched under ambient conditions.Reference Popov, Mordkovich, Perfilov, Kirichenko, Kulnitskiy, Perezhogin and Blank2
No depolymerization of the sample with the (a)-type Raman spectra synthesized from pure C60 is observed. The sample was synthesized at a 13 GPa pressure. The application of a large plastic deformation to the sample during unloading does not lead to any significant changes in its Raman spectra [Fig. 2(b)]. Nevertheless, a mode broadening at 1450, 1560, and around 700 cm−1 is observed. An overlapping of the modes at 1450 and 1560 cm−1 gives a single asymmetric band around 1500 cm−1 [which can be approximated by a sum of two Lorentzians at 1450 and 1560 cm−1 marked by dots in Fig. 2(b)]. The mode broadening could be attributed to high stresses induced by the sample deformation during unloading. The same Raman spectra (with a single combined asymmetric band around 1500 cm−1) were observed for fcc superhard fullerite phases synthesized at a 9 GPa pressure and temperature around 700 K.Reference Popov, Koga, Fujiwara, Mavrin and Blank5,Reference Blank, Buga, Dubitsky, Serebryanaya, Popov and Sundqvist17
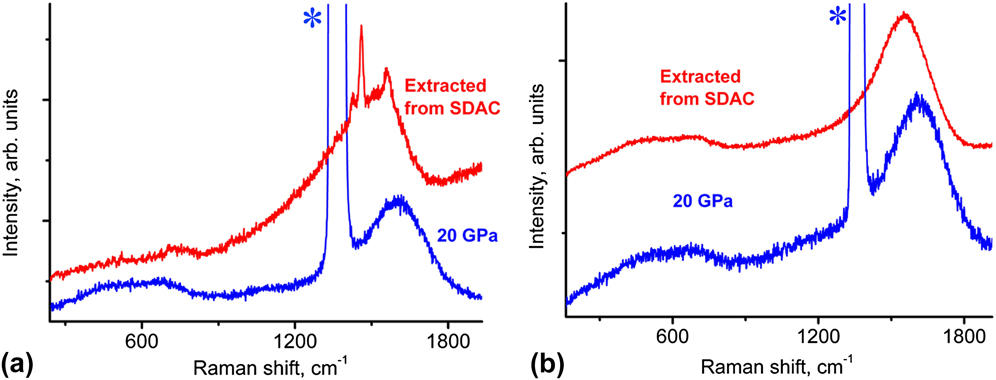
An analogous depolymerization effect was observed for the 3D-polymerized C60 samples with the (b)-type Raman spectra in the presence of CS2. The C60 + CS2 sample was synthesized at a 20 GPa pressure. The application of a large plastic deformation to the sample during unloading leads to its depolymerization down to a 2D polymerized C60 similar to the depolymerization of 3D C60(+CS2) with the (a)-type Raman spectra. The Raman spectra of the sample under a 20 GPa pressure and the depolymerized sample extracted from the SDAC are plotted in Fig. 3(a).
Raman spectra of the 3D-polymerized C60 samples with the (b)-type under pressure and of the one extracted from the SDAC; (a) Raman spectra of the C60 + CS2 sample under a 20 GPa pressure and the depolymerized sample extracted from SDAC; (b) Raman spectra of the pure C60 sample under a 20 GPa pressure and of the one extracted from SDAC, - the application of a large plastic deformation to the sample during unloading does not lead to any changes in the Raman spectra. A strong peak of a stressed diamond anvil is marked by an asterisk in (a) and (b).

The pentagonal pitch mode Ag(2) near 1468 cm−1 [shifted to 1462 cm−1 in the Raman spectra in Fig. 3(a)], Hg(8) (here at 1562 cm−1), and Hg(7) (1427 cm−1) are present in the spectra of the depolymerized sample. The breathing and intermediate modes are not well-resolved in the spectrum because of a luminescence background. The observed band position shifts and the relatively low intensity of the breathing modes indicate a 2D polymerized C60 state rather than a 1D. The spectra are close to those of the so-called T-, R-, and D-C60 polymers (according to the classification proposed in Ref. 26).
When the sample of C60 + CS2 is unloaded without the large plastic deformation, a 3D-polymerized C60 phase with the (b)-type Raman spectra remains upon unloading and can be quenched under ambient conditions.Reference Popov, Mordkovich, Perfilov, Kirichenko, Kulnitskiy, Perezhogin and Blank2
No depolymerization of the sample synthesized from pure C60 is observed. A 3D-polymerized C60 phase with the (b)-type Raman spectra was synthesized at a 20 GPa pressure without the presence of CS2. The application of a large plastic deformation to the sample during unloading does not lead to any changes in the Raman spectra [Fig. 3(b)].
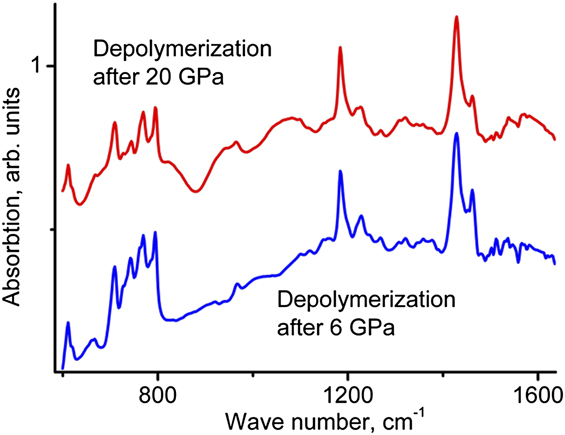
The IR absorbance spectra of the depolymerized samples from the 3D-polymerized C60 phases with the Raman spectra of types (a) and (b) are plotted in Fig. 4. The appearance of modes which are forbidden in an unperturbed C60 molecule is attributed to breaking the I h symmetry of the C60 molecules in 1D and 2D polymers.Reference Rao, Eklund, Hodeau, Marques and Nunez-Regueiro26 Two IR modes are active above 600 cm−1 in unperturbed C60 molecule: F1u(3) at 1184 cm−1 and F1u(4) at 1428 cm−1. The appearance of the other modes in both spectra in Fig. 4(a) is analogous to the one in the IR spectra of R-phase of the 2D polymers of C60.Reference Popov, Koga, Fujiwara, Mavrin and Blank5,Reference Rao, Eklund, Hodeau, Marques and Nunez-Regueiro26
IR absorbance spectra of the depolymerized samples from 3D-polymerized C60 phases with the Raman spectra of types (a) and (b).

A ТЕМ study of the depolymerized samples has shown that they consist mostly of 25–30 nm crystalline structures. Figure 5 shows a fragment of such a structure with a zone axis [−110]. The angle between {111} planes is 70°, as it should be in a fcc-lattice. The interplanar distances are approximately equal to 0.763 nm, which corresponds to the lattice parameter a 0 = 1.32 nm. Fringes in the figure are not always seen clearly. This testifies the presence of defects in the lattice. We observed both stacking faults and twins in some C60 crystal fragments in our sample (though maybe not as indicative as in Ref. Reference Miyazawa, Satsuki, Kuwabara and Akaishi27, where such defects were studied in more detail), but we did not discuss their features, since this is the subject for a separate comprehensive study. The presence of these defects also testifies the effect of a strong plastic deformation undergone by the sample. We have examined about twenty images for both depolymerized samples, and we did not find any noticeable difference between them. Since we are able to compare the present results with the one obtained earlier in Ref. Reference Blank, Zhigalina, Kulnitskiy and Tat’yanin18 and also similar studies that have been performed in Ref. Reference Miyazawa, Akaishi, Kuwasaki and Suga28, we are confident of the structure type we refer to when interpreting our diffraction patterns. There are fragments in fcc lattices with parameters (basis vector value) from 1.38 to 1.30 nm in both samples. Sometimes, we observed some distorted fcc-structures.
A TEM image of the depolymerized sample from a 3D-polymerized C60 phase with the (b)-type Raman spectra: (a) fringes in the image correspond to the contrast of the (111) and  $\left( {1\bar 11} \right)$ planes and (b) fast Fourier transform from (a).

The signal detected by the EDS system definitely indicates the presence of sulfur, but it is too weak to calculate the particular content. Accordingly, the content must be around 1 at.%.
The examination on a number of crystal lattices formed under thermobaric treatment of C60 (Refs. Reference Blank, Zhigalina, Kulnitskiy and Tat’yanin18 and Reference Blank, Kulnitskiy, Dubitsky and Alexandrou19) has shown a general tendency to the lattice parameter decrease with the increase of pressure from a 0 = 1.413 nm (initial fullerene lattice parameter) to a 0 = 1.30 nm. Further growth of pressure and temperature leads to the formation of triclinic structures, which can be considered as a distorted fcc-structure. The a, b, and c parameters of such structures vary within a relatively broad range from 1.3 to 1.12 nm, whereas the α, β, and γ angles differ from 90° to less than 6°. The appearance of such triclinic structures can be explained by the connection of molecules with the subsequent formation of chains in the  $\left\langle {{\rm{110}}} \right\rangle$ directions (because the nearest-neighbor molecules are located along these directions). Such a chain of molecules corresponds to one of the directions
 $\left\langle {{\rm{110}}} \right\rangle$ in the observed structure. These chains may differ from each other by the kind of bonds between the molecules. This difference causes the difference in distances between the molecules along
 $\left\langle {{\rm{110}}} \right\rangle$ directions, and therefore, between {111} planes. In its turn, it leads to the distortion of the fcc lattice, change of the angles, etc.
Based on our TEM study, we conclude that the samples contain a minor amount of the distorted fcc lattices, which testifies their particular polymerization. At that, the vast majority of the material is represented by the fcc lattices with undistorted angles and decreased lattice parameters. These structures do not possess any chains along the  $\left\langle {{\rm{110}}} \right\rangle$ directions, otherwise, they would not have a cubic lattice but instead, they would have been distorted. As for the observed fcc lattices, some relatively big values of the shortest intermolecular distances in them cannot correspond to the bonds between the polymerized molecules. The “discreteness” (a finite set of values) of the interplanar distances observed in the sample is in connection with the orientational transitions of С60 molecules connected by van der Waals (predominantly) bonds. In general, the TEM study of the depolymerized samples agrees with the Raman [Figs. 2(a) and 3(a)] and the IR absorption (Fig. 4) data.
In conclusion, the catalytic depolymerization (the reversible polymerization) of the synthesized ultrahard fullerite is possible in the presence of sulfur under conditions of a large plastic deformation. The depolymerization effect is not observed for pure C60 3D-polymerized phases synthesized without CS2.
ACKNOWLEDGMENTS
The authors thank A. Galkin for assistance in the IR spectra study. This work was supported by the Ministry of Education and Science of the Russian Federation, basic program for the National University of Science and Technology MISiS and Grant No. 14.577.21.0090 (project ID RFMEFI57714X0090); the work was done using the Shared-Use Equipment Center of the Technological Institute for Superhard and Novel Carbon Materials.