I. INTRODUCTION
Diamond-like carbon (DLC) has been subjected to intense research over the last three decades owing to its interesting material properties such as excellent hardness, high chemical inertness, wear resistance, thermal conductivity, optical transparency, and low coefficient of friction (COF).Reference Robertson1 With these attractive properties, DLC has found many important applications such as structural elements in micro-electromechanical systems, protective coating in magnetic storage disk, and biocompatible coatings for medical applications.Reference Robertson1
In the application of protective coating, the reliability of the coating is often governed by the adhesion and tribological properties of the films. At macroscopic scales, as suggested by Amonton’s law, the friction coefficient is independent of contact area and applied load.Reference Kim, Asay and Dugger2 However, as the critical dimension for devices continues to shrink, the surface forces such as adhesion, friction, meniscus forces, viscous drag forces, and surface tension become more dominant compared to volume-related forces such as inertia or electromagnetic forces.Reference Kim, Asay and Dugger2, Reference Bhushan and Dandavate3 The breakdown of Amanton’s law at nanoscale means that the individual asperities on the surface of films should be taken into consideration and can affect the reliability of the coatings. For example, Gabriel et al. in their early study showed that wear is one of the dominant failure mechanisms for polysilicon microturbine and gears, while Lee et al. showed that the lifetime of microfabricated radial-gap electric motor was limited to 10,000 cycles due to high friction and wear of nitride polysilicon bearings.Reference Sheeja, Tay, Yu and Lau4–Reference Chen and Hong8 With the high wear resistance, hardness, and ultrasmooth surface, DLC has become an attractive candidate as tribological coating. However, the practical application of DLC can be limited by the high internal stress (up 10 GPa), which can lead to buckling and spontaneous delamination of the films from the substrate.Reference Robertson1, Reference Mckenzie, Muller and Pailthorpe9, Reference Ban, Hasegawa, Fujii and Fujioka10
The incorporation of dopants into DLC not only been demonstrated as an effective method in relieving the internal stress, yet it is capable of diversifying the material properties of DLC.Reference Foong, Hsieh, Li and Chua11–Reference Marciano, Bonetti, Pessoa, Marcuzzo, Massi, Santos and Trava-Airoldi14 For examples, by incorporating silver, Marciano et al. showed that the internal stress of DLC films was reduced by ∼0.3–0.7 GPa while improving the life time of DLC films used in vacuum and space applications.Reference Marciano, Bonetti, Pessoa, Marcuzzo, Massi, Santos and Trava-Airoldi14 Owing to the similar electronic and crystallography structures to silver, non-carbide former, i.e., copper possesses many interesting properties that resembled to silver such as high ductility, malleability, and high electrical conductivity.Reference Dimigen and Kiages12, Reference Lide15 By incorporating copper into DLC, researchers have shown that the presence of soft copper nanoclusters reduced internal stress and improved the wear resistance of DLC.Reference Wei, Sharma, Sankar and Narayan13, Reference Wei, Narayan, Narayan, Sankar and Sharma16–Reference Chen and Hong18 On the other hand, as the most conductive material after silver yet available at a remarkable lower cost, copper was demonstrated to improve the electrical conductivity of highly insulating DLC by orders.Reference Dimigen and Kiages12 These suggest that low-cost nanocomposite with enhanced reliability and improved conductivity could be achieved through the incorporation of copper and thus could widen the application of DLC into other applications such as electrical interconnect. However, a recent study by Corbella et al. showed that the presence of metal dopants will alter the surface roughness of the films and influent the COF of DLC differently, depending on the type and the concentration of different dopants.Reference Corbella, Bertran, Polo, Pascual and Andújar19 As the physical properties, particularly the tribological properties and the film adhesion play an immense role in determining the reliability of the components; this study reports on the effects of copper, deposited in the presence of laser, on the morphology, microstructure, chemical binding states, interface, electrical, tribological properties, and the adhesion strength of copper-incorporated DLC films.
II. EXPERIMENTAL METHOD
Copper-doped DLC nanocomposite films with 80–100 nm thickness were deposited using Lambda Physik 248 nm pulsed laser deposition (PLD) system (Göttingen, Germany). First, five Cu/C mixture targets with different copper contents at 5, 10, and 15 at.% and a pure carbon target were prepared. Pure elemental powders of graphite (99.5% purity, <40 μm) and copper were mixed thoroughly by using a Y-mixer and then were compacted under about ∼480 MPa to form 60-mm diameter and 20-mm thickness cylindrical targets. During deposition, the deposition chamber was evacuated to a base pressure below 4 × 10⁻⁴ Pa, and the excimer laser (λ = 248 nm, pulse duration = 25 ns, repetition rate = 20 Hz) was used to ablate the target materials. The laser energy used was stabilized at 150 mJ before deposition, and the deposition time for the films was maintained constant around 5 min.
The surface roughness of the films was examined by using Digital Instrument Nanoscope III atomic force microscopy (AFM; Tonawanda, NY). Three readings each with scan size of 1 μm × 1 μm were taken at different locations on the films for comparison. A JEOL JEM-3010 transmission electron microscope (TEM; Tokyo, Japan) with LaB6 filament and point-to-point resolution of 0.17 nm was used to study the morphology of the films. During the scanning, the electrons were accelerated to 300 kV, and a high-angle annular detector was used to collect the electrons that were scattered at large angles.
The microstructural properties of the films were studied using a Reinshaw Raman spectroscopy system (Stonehouse, UK), in which a 514 nm Ar+ laser beam was incident to the surface of the films. The laser beam was focused on the films by using an optical microscope at a magnification of 50× (laser spot size ∼1 μm), and signals were acquired in the range of 300–2000 cm−1. During signal acquisition, a low input power of 1.5 mW was used to avoid damage to the films. The Raman spectra were deconvoluted to estimate the sp3 content of the films. A Kratos Axis Ultra DLD x-ray photoelectron spectroscopy (XPS) spectrometer using monochromatic Al Kα (1486.69 eV; Manchester, UK) was used to study the surface properties and the bonding states of the films. The analysis chamber was evacuated to 1.3 × 10⁻⁷ Pa or lower, and spectra were collected in a concentric hemispherical analyzer in a constant energy mode, with a pass energy, E p, of 20 eV and 160 eV was used for narrow scan and wide scan, respectively. The core-level spectra were obtained at a take-off angle of 90°. The C 1s peaks were then deconvoluted to determine the chemical bonding states present in the films. To examine the interface property, the depth profiles of film composition were obtained using ION-TOF ToF-SIMS (Time of Flight Secondary Ions Mass Spectroscopy). Ar+ ion beam (Münster, Germany) was used to sputter-etch the sample. The acceleration voltage for the analyzing beam was 1 kV, and the beam current was 13 nA. The spot size of the beam on the samples was 200 × 200 μm2.
A 200-μm Rockwell diamond-tipped stylus with 3.5 N progressive loads was drawn on the surface of the films to determine the adhesion strength of the films. The scratch length was fixed to 3 mm, and the loading rate was fixed at 0.3 N min−1. The COF, μ, can be determined from a plot of tangential force versus progressive normal load from the experiment where the slope of the curves was estimated as the COF of the samples. The electrical resistivity of the films was obtained using a four-point probe station connected to a constant-current source and a digital voltmeter. Different currents were applied to several measurement points on each specimen to minimize errors.
III. RESULTS
A. Microstructure, interface, and mechanical properties
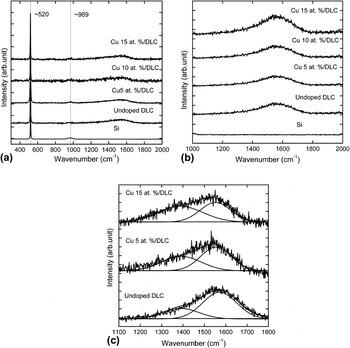
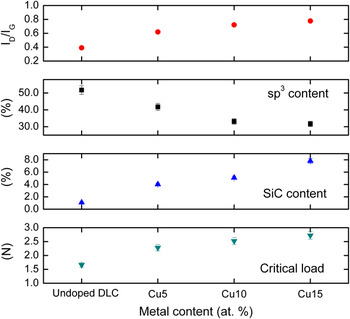
Raman spectra for all the copper-doped DLC samples are shown in Figs. 1(a)–1(c). It can be seen from Fig. 1(a) that sharp peaks were present around 520 cm−1 and 969 cm−1 for all the samples, and the peak positions are corresponding to first (520 cm−1) and second (969 cm−1) order of phonon scattering of silicon, respectively. This result is reasonable as silicon was used as substrate material in this study and showed that the resulted films were optical transparent at the Raman wave length (514 nm). A more careful study on the broad scan on Fig. 1(a) shows that no other obvious peaks occurred from ∼760 cm−1 to ∼796 cm−1, which indicates that the signal due to transverse optic (TO) modes from 3C-SiC, polytype SiC such as 4H-SiC or 6H-SiC, and amorphous SiCReference Zhao, He, Sun, Yi and Xiao20, Reference Jiang, Wang, Kim, Bae, Li, Nachimuthu, Zhu, Zhang and Weber21 are insignificant. However, as the peak position for longitudinal optic (LO) mode for 3C-SiC is around 973 cm−1,Reference Zhao, He, Sun, Yi and Xiao20, Reference Jiang, Wang, Kim, Bae, Li, Nachimuthu, Zhu, Zhang and Weber21 it is possible that the broadening of the LO peaks were merged with the signal from silicon and thus unnoticeable in the Raman spectra. When signal was acquired from 1000 to 2000 cm−1, broad peaks centered around 1550 cm−1, as shown in Fig. 1(b), were observed. As the Raman spectra of Si–C bondings is located between ∼700 and 1000 cm−1, it is reasonable to consider that the broad peaks between 1100 and 1800 cm−1 are associated with the C–C bondings from amorphous carbon instead of the effect of C in Si–C. These broad peaks can be deconvoluted into two Gaussian peaks,Reference Tay, Xu, Tan, Yang and Sun22 namely the D and G peaks, which are associated with the stretching of sp2 clusters and the in-plane C–C stretching mode of sp2 hybridized carbon atoms, respectively.Reference Dimigen and Kiages12, Reference Matsuyama, Yukimura and Maruyama23 Figure 1(c) shows the deconvoluted Raman spectra for undoped DLC, Cu 5 at.%/DLC, and Cu 15 at.%/DLC films. The D and G peak positions, the full width half maximums (FWHMs), the intensities of D peak (I D) and G peak (I G), the I D/I G ratios, and the estimated sp3 contents are given in Table I. The I D/I G ratio is commonly used to estimate the average distance among defects in graphite,Reference Lucchese, Stavale, Martins Ferreira, Vilani, Moutinho, Capaz, Achete and Jorio24 and some studies have shown that it can be used to derive the sp3 content under restricted condition, i.e., room temperature deposition such as as-deposited tetrahedral amorphous carbon (ta:C) or hydrogenated amorphous carbon (a-C:H).Reference Ferrari and Robertson25 In the cases such as high-temperature deposition, annealing after deposition, low-dose ion implantation, or unfiltered deposition, there is no unique relationship that can be derived between I D/I G and the sp3 content due to hysteresis effects that take place under those conditions.Reference Ferrari and Robertson25 Different studies have shown that the I D/I G ratios are correlated to sp3 content, in which a lower I D/I G ratio correspond to a higher composition of sp3 present in the film.Reference Tay, Xu, Tan, Yang and Sun22, Reference Ferrari and Robertson25–Reference Tamor and Vassell27 With the presence of 15 at.% copper, the I D/I G ratio of undoped DLC were increased from 0.39 to 0.78, which indicated a decrease in sp3 content with the presence of copper in DLC films. Based on empirical equation relationship reported by other researchers,Reference Sheeja, Tay, Lau and Xu28, Reference Xu, Tay, Tan, Zhong, Tu, Silva and Milne29 the presence of 5 and 15 at.% of copper had reduced the sp3 content in undoped DLC from ∼68% to ∼53% and ∼42%, respectively. As Raman spectroscopy is a less accurate method compared to nuclear magnetic resonant (NMR) in assessing the sp3 bonding, it should be noted that the sp3 content derived from Raman spectroscopy serves as a rough estimation of the sp3 content in the films, though it shows similar conclusion with XPS analysis in the later part of this article.
(a) Wide range scanning of Raman spectra on Si, undoped diamond-like carbon (DLC), and Cu/DLC nanocomposite films. (b) Narrow range scanning of Raman spectra on Si, undoped DLC, and Cu/DLC nanocomposite films. (c) Deconvoluted Raman spectra on undoped DLC (below), Cu 5 at.%/DLC (middle), and Cu 15 at.%/DLC (top).

D and G peaks positions, amplitude, full-width half-maximum (FWHM), I D/I G ratio, and estimated sp3 percent for diamond-like carbon (DLC) doped with different at.% of copper.

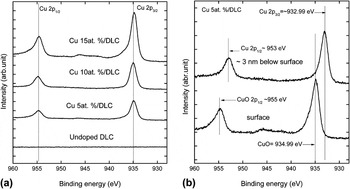
XPS survey scan confirmed that no other elements were observed and thus proving no other contaminations could be detected at <0.1 at.%. Figure 2(a) shows the XPS spectra on Cu 2p for undoped DLC and Cu-doped DLC films. The presence of peaks at binding energies ∼935 and ∼954.7 eV corresponds, respectively, to the Cu 2p3/2 and Cu 2p1/2 peaks of CuO.Reference Chastain30 However, the formation of copper oxides can be attributed to surface oxidation, as a light sputtering on the samples revealed the elemental Cu peak at ∼933 eV, as shown in Fig. 2(b).Reference Chastain30
(a) X-ray photoelectron spectroscopy (XPS) spectra for undoped DLC and Cu/DLC films at Cu 2p before light sputtering. (b) XPS spectra for Cu 5 at.%/DLC film at Cu 2p before light sputtering and after light sputtering.

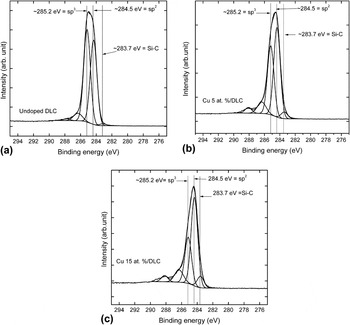
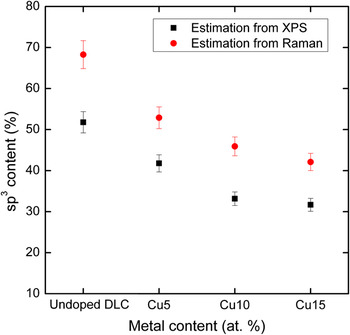
The effects of copper on DLC can be revealed by examining the C 1s spectra of the samples. The binding energies at 283.7, 284.5, 285.2, 286.5, and 288.5 eV have been reported to associate with Si–C, graphite, diamond, C–O contaminated, and C=O bonds, respectively.Reference Kim, Jang, Kim, Choi, Choi, Lee, You and Chun31, Reference Jouan, Peignon, Cardinaud and Lempérière32 When the C 1s peaks for the films were deconvoluted into five Gaussian peaks as shown in Figs. 3(a)–3(c), the peaks’ areas at 285.2 eV, which are corresponded to sp3 bonding in Cu 5 at.%/DLC [Fig. 3 (b)] and Cu 15 at.%/DLC [Fig. 3(c)], were found to decrease compared to undoped DLC [Fig. 3(a)]. With the presence of 15 at.% Cu, the sp3 bonding in undoped DLC was reduced from ∼52 to ∼32%. The sp3 content estimated by XPS overlay on the sp3 content estimated by Raman spectroscopy, and the estimation on sp3 content by using XPS was found to correlate reasonably well with the estimation from Raman spectroscopy, as shown in Fig. 4. Figures 3(b) and 3(c) further show that peaks at 283.7 eV, which correspond to Si–C bonding,Reference Ouerghi, Kahouli, Lucot, Portail, Travers, Gierak, Penuelas, Jegou, Shukla, Chassagne and Zielinski33 become more distinct in copper-doped DLC as compared to undoped DLC [Fig. 3(a)], and the Si–C content of the samples is shown in Fig. 5. The Si–C content was found to increase from 1.09% in undoped DLC films to a maximum value of ∼7.83% when 15 at.% of copper was added into DLC. Figure 5 also shows the critical load of copper-doped DLC films as a function of copper content. From undoped DLC, the adhesion strength of the film was improved from 1.66 N to a maximum of 2.72 N with the presence of 15 at.% copper, and the adhesion strength of the samples can be correlated directly with the content of Si–C bonding that is present in the films.
(a) Deconvolution on XPS C 1s spectra on undoped DLC. (b) Deconvolution on XPS C 1s spectra on Cu 5 at.%/DLC. (c) Deconvolution on XPS C 1s spectra on Cu 15 at.%/DLC.

Estimation of sp3 content using Raman spectroscopy and XPS.

I D/I G ratio (circle), sp3 content estimated by XPS (square), percentage of Si–C estimated by XPS (triangular), and critical load (inverted triangular) for DLC doped with different fraction of copper.

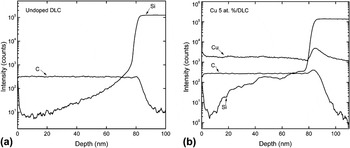
The interface between film and substrate of the samples was characterized by using SIMS, and Figs. 6(a) and 6(b) show the depth profiling results on undoped DLC and in Cu 5 at.%/DLC, respectively. SIMS shows that silicon and carbon were detected at the interface and extended to surface of both undoped DLC and Cu 5 at.%/DLC. As the carbon and silicon coexist at a shallow region of the films, which lies in the sampling depth of XPS,Reference Watts and Wolstenholme34 thus it could be responsible for the Si–C bonding detected in XPS analysis. In addition, it can be seen from Fig. 6(b) that the signal of silicon within the films is higher in Cu 5 at.%/DLC compared to undoped DLC. Thus, explaining the higher fraction of Si–C bonding detected in Cu 5 at.%/DLC compared to DLC during XPS analysis.
(a) SIMS depth profiling on undoped DLC. (b) SIMS depth profiling on Cu 5 at.%/DLC.

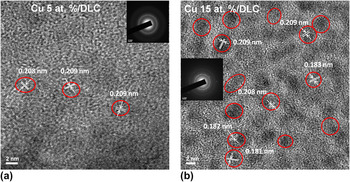
The formation of copper nanoclusters can be revealed by employing TEM on the samples. Results showed that copper nanoclusters were formed and embedded in the amorphous carbon matrix. Figures 7(a) and 7(b) show the selected TEM scannings on Cu 5 at.%/DLC and Cu 15 at.%/DLC. As confirmed by selected-area electron diffraction (SAED), the nanoclusters are crystalline in nature and measurement on the lattice fringes showed that the interplane distances are ∼0.209 and ∼0.181 nm correspond to (111) and (200) plane in copper, respectively.Reference Downs, Bartelmehs, Gibbs and Boisen35 In addition, it can be seen from Figs. 7(a) and 7(b) that the density of the copper nanoclusters was higher in Cu 15 at.%/DLC compared to Cu 5 at.%/DLC, but with no significant changes in the size of the nanoclusters formed.
(a) Transmission electron microscopy (TEM) scanning on Cu 5 at.%/DLC. (b) Transmission electron microscopy (TEM) scanning on Cu 15 at.%/DLC.

B. Electrical, surface morphology, and frictional properties
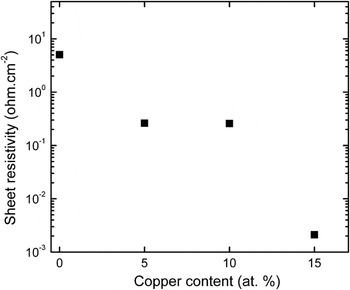
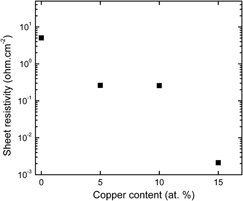
The electrical sheet resistivity of undoped and copper-doped DLC is shown in Fig. 8. It can be seen from Fig. 8 that the presence of 5 and 15 at.% of copper has reduced the electrical sheet resistivity of undoped DLC from ∼5 to ∼2.5 × 10⁻¹ and ∼2.1 × 10⁻³ Ω cm−2, respectively.
Electrical sheet resistivity of DLC doped with different copper content.

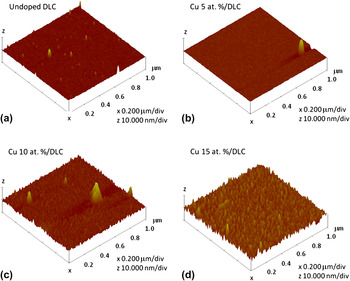
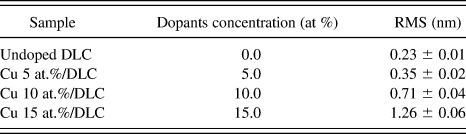
Figures 9(a), 9(b), 9(c), and 9(d) show the surface morphology of undoped DLC, Cu 5 at.%/DLC, Cu 10 at.%/DLC, and Cu 15 at.%/DLC, respectively. The average surface roughnesses (RMS) for the films as a function of copper composition are given in Table II. It can be seen from Fig. 9 and Table II that the surface roughness of the films increased from 0.23 to 1.26 nm when the copper concentration increased from 0 to 15 at.%.
Atomic force microscopy scanning (scan size: 1 μm ×1 μm, Z–data scale: 10 nm) on DLC doped with different fraction of copper; (a) Undoped DLC (b) Cu 5 at.%/DLC (c) Cu 10 at.%/DLC and (d) Cu 15 at.%/DLC.

Surface roughness for DLC films doped with different at.% of copper.

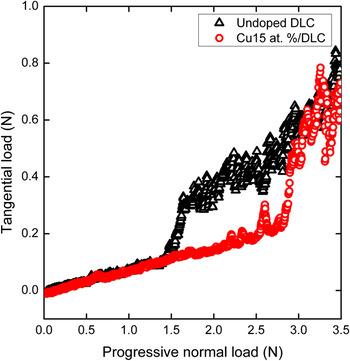
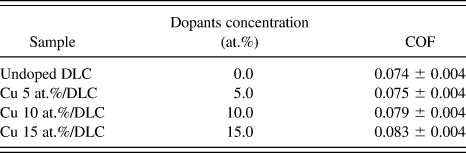
Figure 10 shows a plot of tangential load versus progressive normal load on undoped DLC and Cu 15 at.%/DLC samples. The slope of the Cu 15 at.%/DLC was approximately the same as DLC, and the COF obtained for these two samples are 0.07 and 0.08, respectively. Table III gives the COFs for all the samples under investigation. From the table, the changes on COF with the presence of copper are quite insignificant, and generally the COF for copper-doped films are similar to high sp3 content DLC films, at a low value of 0.1.
Tangential load versus progressive normal load for undoped DLC (triangular) and Cu 15 at.%/DLC (circle). The COF of the material can be estimated from the slope of the curve.

Coefficient of friction (COF) for DLC doped with different at.% of copper.

IV. DISCUSSION
PLD can be divided into three regimes: (1) the evaporation of target material because of the interaction between target material and laser beam, (2) the interaction between evaporated material with the incident laser which lead to isothermal plasma formation and expansion, and (3) anisotropic adiabatic expansion of the plasma leading to the formation of film on the substrate.Reference Singh and Narayan36 At low pulsed energy density (∼1–10 J cm−2), the evaporation of target materials can be considered thermal in nature. However, at sufficiently high energy density, the interaction of laser beam with evaporated material gives rise to athermal characteristics to the species in plasma.Reference Singh and Narayan36 During the interaction of plasma and laser at high laser density, the absorption of laser by plasma occurs mainly by an inversed bremsstrahlung process, which involves the absorption of photon by a free electron and can be expressed by the coefficient of absorption, α p,Reference Singh and Narayan36, Reference Willmott and Huber37 as,

where Z, ni, T, h, k, and υ are the average ion charge, ion density, temperature of the plasma, Planck constant, Boltzmann constant, and frequency of the laser light, respectively. The ion density in cm−3 can be estimated by using Saha equation,Reference Willmott and Huber37, Reference Chen, Huddlestone and Leonard38 which can be expressed as,

where n n and Ui are the density of neutrals in cm−3 and the first ionization potential of the gas atoms in question in eV, respectively.
The first ionization potential energy for carbon and copper are 11.26 and 7.73 eVReference Lide15 respectively, and the ionization potential for copper is about 1.5 times lower than those of carbon; thus, the ion density for singly charged copper is higher than those of singly charged carbon. Since the coefficient of absorption is a function of ion density, a higher ion density possessed by singly charged copper ions shows the possibility of a higher energy possessed by the copper–carbon systems compared to single-carbon system. The laser energy absorbed by electronic absorption, Q, can be approximated by using the product of coefficient of absorption, α p, and the radiation intensity of the laser, I, which can be expressed as,Reference Anisimov, Bityurin, Luk’yanchuk and Peled39

For a pure carbon system with a vaporization temperature of ∼3600 K under vacuum condition, the energy absorbed and possessed by carbon species is ∼24 eV, which is in close agreement to the value ∼20 eV reported by other researchers.Reference Robertson1, Reference Foong, Hsieh, Li and Chua11, Reference Cuomo, Pappas, Bruely, Doyle and Saenger40, Reference Lossy, Pappas, Roy, Doyle, Cuomo and Bruley41
Experimental data showed that the surface roughness of copper DLC films increased with the increasing copper content in DLC and can be attributed to the formation of copper nanoclusters in the carbon matrix. During the deposition process, energetic ions were delivered to the surface and where upon impingement, momentum, and excess energy from impinging ions can be transferred to the surface atoms through collision process.Reference Willmott and Huber37 As the collision process and thermalization process are usually short (∼10−11 to 10−13 s), these surface atoms have sufficient time to diffuse and form nanoislands during the growth process,Reference Lifshitz, Edrei, Hoffman, Grossman, Lempert, Berthold, Schultrich and Jäger42 before the next pulse of ions which will be delivered in 50 ms at a laser repetition rate at 20 Hz. The evolution of solid is generally accepted to be governed by two steps, i.e., (1) the nucleation and (2) the continuous growth of nucleus into larger clusters.Reference Porter and Easterling43 Previous study has shown that metal atoms can behave as a two-dimensional gas, diffusing until they encounter a surface defect to which they can bond and form a nucleation center.Reference Egelhoff and Tibbetts44, Reference Hamilton and Logel45 In the case of amorphous carbon, the surface of the film is effectively saturated with defects where metal atoms could bond together to form nucleation centers.Reference Egelhoff and Tibbetts44 In its diffusion path, metal atoms may encounter a new defect site to nucleate rather than diffusing to a prior nucleated defect site with a preexisting nanocluster. Thus, with the reduction in step 2 occurrences, uniformly distributed metal clusters with limited changes in cluster size were formed. In our case, because of the lower first ionization energy, the energy content estimated on copper species by using Eqs. (1)–(3) will be higher than those of carbon species. As the copper content increased in the DLC, the overall energy dissipated is higher and could enhance the diffusion of metal atoms to migrate, bond together to form nucleation sites, and subsequently the nucleation of nanoclusters in DLC. Thus, this can manifest as an increase in the density of nanoclusters and subsequently the surface roughness, as evidenced by TEM and AFM, respectively. However, as surface defects density of DLC could be high as reported in previous study,Reference Egelhoff and Tibbetts44 the further growth in cluster size could be limited by high surface defects density of amorphous carbon, whereby the metal atoms might have bond to form nucleation of nanoclusters instead of the growth in cluster size. Experimental data from Raman spectroscopy, i.e., the gradual increase in I D/I G ratio and composition analysis from XPS confirmed an increase in the sp2 contents with the increasing copper contents. Copper has been well known as a catalyst in accentuating the formation of sp2 sheet in the growth of carbon materials such carbon nanotubes and graphene, which are fabricated from high-temperature chemical vapor deposition (CVD) process.Reference Zhou, Han, Wang, Zhang, Jin, Sun, Zhang, Yan and Li46–Reference Cheung, Kurtz, Park and Lieber48 In these cases, gaseous carbon source is used as the precursor in the form of methane (CH2) or ethylene (C2H4). In order for the sp2 formation to proceed, the precursor gases have to be first broken down by a suitable catalyst, which in these cases copper or nickel is frequently used. However, in a physical deposition process such as PLD or sputtering, the carbon ion source is supplied through the ablation of a solid carbon or carbon composite target,Reference Foong, Hsieh, Li and Chua11, Reference Wei, Sharma, Sankar and Narayan13, Reference Wei, Narayan, Narayan, Sankar and Sharma16, Reference Corbella, Bertran, Polo, Pascual and Andújar19, Reference Matenoglou, Evangelakis, Kosmidis, Foulias, Papadimitriou and Patsalas49–Reference Koh, Hsieh and Chua54 which does not require a chemical reaction or catalyst as compared to CVD process. Thus, the chemical catalytic effect of copper is minimal in the formation of laser-fabricated Cu/DLC system. Instead, the accentuation from copper in the formation of sp2 bonding can be understand from subplantation model, which is applicable to hyperthermal species with energy around 1–103 eV as in current case.Reference Lifshitz, Kasi and Rabalais55, Reference Lifshitz, Lempert and Grossman56 As copper species is capable of absorbing more energy in comparison to carbon species and TRIM calculation from other researchers shown that about 75–90% of the energy will be dissipated as phonon and electron excitation,Reference Lifshitz, Lempert and Grossman56 excess energy can be released and graphitized the films upon the impingement of these energetic species on the films during deposition. As the copper content increased in the DLC, the overall energy dissipated is higher and could lead to a more obvious graphitization process, as revealed by the more obvious D peak for Cu 15 at.%/DLC in Raman spectroscopy and the reduced sp3 bondings detected by XPS (Figs. 1(c), 3, and 4). As the presence of sp2 bonding have been reported to increase the electrical conductivity of DLC due to hopping transport mechanism along sp2 carbon atoms,Reference Wong, Foong and Chua52, Reference Grill57 the more severe graphitization that accentuated the formation of sp2 bonding may have contributed to the decrease in sheet resistivity of copper-doped DLC in addition to the formation of inherently conductive copper nanoclusters. On the other hand, because of the lower first ionization potential energy, the energy absorbed by copper ions is higher than those of carbon ions, and the impingement of the non-carbide former copper ions can rearrange the distribution of carbon and silicon atoms, thus could possibly form Si–C bonding. As the energy absorbed by the copper–carbon system increased with increasing copper content, the collision process was enhanced and thus could increase the amount of Si–C bonding formed in the nanostructured samples, as evidenced by XPS and SIMS.
The superior mechanical properties of amorphous carbon are generally associated with the sp3 bonding,Reference Robertson1 and thus the presence of copper that reduced the sp3 bonding may be perceived as a form of degradation to the mechanical properties of DLC. However, mechanical property such as adhesion strength is not solely dependent on sp3 but also on the internal stress of the film.Reference Foong, Hsieh, Li and Chua11, Reference Wei, Narayan, Narayan, Sankar and Sharma16, Reference Ji, Li, Zhao, Chen and Zhou26, Reference Wei, Sankar, Sharma, Oktyabsky, Narayan and Narayan53 In fact, experimental results showed that the adhesion strength increased with the presence of copper though the sp3 content was reduced. Hence, it is necessary to examine both factors when evaluating the mechanical properties of Cu/DLC composites. The G peak position in Raman spectroscopy has been related to internal stress by several researchers, whereby a shift of G peak position to a longer wave number can imply an increase in compressive stress in the films.Reference Wei, Narayan, Narayan, Sankar and Sharma16, Reference Narayan51, Reference Weng, Chen, Lin and Wang58, Reference Ahmad, Roy, Rahman, Okpalugo, Maguire and McLaughlin59 The change in residual stress, δ, can be estimated in terms of shear modulus of the film, G, Poisson ratio of the film, v, the changes of Raman wave number with respect to reference state, Δω, and the Raman wave number for reference state, ω oReference Foong, Hsieh, Li and Chua11, Reference Wei, Narayan, Narayan, Sankar and Sharma16, Reference Narayan51:

A more careful study on the G peak position from Raman spectra in this work showed that the presence of copper has reduced the internal stress of the films, in which the wave number for G peaks has decreased from ∼1574 cm−1 (undoped DLC) to ∼1556 cm−1 (Cu 15 at.%). By taking 300 GPa for undoped DLC as reference state,Reference Wei, Narayan, Narayan, Sankar and Sharma16 the residual stress in films had reduced for ∼3.4 GPa when 15 at.% of copper is doped into DLC. Stress relaxation process has been attributed to the formation of interfaces that allow grain boundary sliding and grain-boundary diffusion.Reference Ji, Li, Zhao, Chen and Zhou26 As such, with the formation of copper nanoclusters, which increased the interfaces between components, could have contributed to the reduced internal stress. Since the reduction in internal stress and the presence of Si–C bonding have reported to improve the adhesion strength,Reference Wei, Narayan, Narayan, Sankar and Sharma16, Reference Ji, Li, Zhao, Chen and Zhou26, Reference Sheeja, Tay, Lau and Xu28, Reference Sheeja, Tay, Lau, Shi, Shi, Li, Ding, Liu and Sun60 the decreasing internal stress and increasing Si–C content, when more copper was present in the films, explained the improved adhesion strength observed in the nanostructured films.
V. CONCLUSIONS
In summary, the effects of copper on DLC films deposited by PLD were investigated by using AFM, TEM, Raman spectroscopy, XPS, SIMS, four-point probe, and MST. With the increased energy absorbed owing to a lower first ionization potential, the presence of copper was found to enhance the formation of nanoclusters and subsequently the surface roughness of the DLC films. Raman spectroscopy and XPS confirmed the decrease of sp3 content with the increasing copper fraction, which could be a result from more severe thermalization on carbon matrix owing to the presence of copper. With the formation of copper nanoclusters and Si–C bondings, DLC nanocomposite films with enhanced electrical conductivity and adhesion strength were obtained.
ACKNOWLEDGMENTS
This research work is funded by National University of Singapore WBS R-288-000-057-272 and R 284-000-087-112. Y. M. Foong and A. T. T. Koh would like to acknowledge the funding support from National University of Singapore Research Scholarship.