1. INTRODUCTION
A fast ignition scheme, in which the ignition process is separate from the compression procedure, is expected to save driver energy and realize high-gain fusion (Tabak et al., Reference Tabak, Hammer, Glinsky, Kruer, Wilks, Gampbell, Perry and Mason1994). In this scheme, various methods are used to ignite a compressed core, for example, a fast electron beam, a proton beam, and shock wave (Tabak et al., Reference Tabak, Hammer, Glinsky, Kruer, Wilks, Gampbell, Perry and Mason1994; Roth et al., Reference Roth, Cowan, Key, Hatchett, Brown, Fountain, Johnson, Pennington, Snavely, Wilks, Yasuike, Ruhl, Pegoraro, Bulanov, Campbell, Perry and Powell2001; Murakami et al., Reference Murakami, Nagatomo, Azechi, Ogando, Perlado and Eliezer2006). Many studies related with these methods have been performed (Charakhch’yan et al., Reference Charakhch’yan, Krasyuk, Pashinin and Semenov1999; Tabak et al., Reference Tabak, Clark, Hatchett, Key, Lasinski, Snavely, Wilks, Town, Stephens, Campbell, Kodama, Mima, Tanaka, Atzeni and Freeman2005; Key, Reference Key2007; Norreys et al., Reference Norreys, Scott, Lancaster, Green, Robinson, Sherlock, Evans, Haines, Kar, Zepf, Key, King, Ma, Yabuuchi, Wei, Beg, Nilson, Theobald, Stephens, Valente, Davies, Takeda, Azechi, Nakatsutsumi, Tanimoto, Kodama and Tanaka2009; Renard-Le Galloudec & D’Humieres, Reference Renard-Le Galloudec and D'Humieres2010). In Japan, experiments using cone-guided targets, in which a fast electron beam is used to ignite a core, were performed, and a high temperature of approximately 800 eV was achieved (Kodama et al., Reference Kodama, Norreys, Mima, Dangor, Evans, Fujita, Kitagawa, Krushelnick, Miyakoshi, Miyanaga, Norimatsu, Rose, Shozaki, Shigemori, Sunahara, Tampo, Tanaka, Toyama, Yamanaka and Zepf2001, Reference Kodama, Shiraga, Shigemori, Toyama, Fujioka, Azechi, Fujita, Habara, Hall, Izawa, Jitsuno, Kitagawa, Krushelnick, Lancaster, Mima, Nagai, Nakai, Nishimura, Norimatsu, Norreys, Sakabe, Tanaka, Youssef, Zepf and Yamanaka2002). As a next step, the first phase of the fast ignition realization experiments project (FIREX-I) (Azechi & The FIREX Project, Reference Azechi2006) has begun at the Institute of Laser Engineering (ILE), Osaka University. The goal of FIREX-I is to demonstrate an ignition temperature of 5–10 keV in the laser for fast ignition experiment (LFEX), which is a four-beam bundled high-energy peta-watt (10 kJ/10 ps) laser. The first integrated experiments using the LFEX laser, in which the laser was operated with one beam in low-energy mode, were performed in 2009 (Mima et al., Reference Mima, Sunahara, Shiraga, Nishimura, Azechi, Nakamura, Johzaki, Nagatomo, Garcia and Velarde2010), and integrated experiments using the two-beam LFEX laser were performed in 2010. Many simulation studies were also coducted (Sakagami & Mima, Reference Sakagami and Mima2002, 2004; Sakagami et al., Reference Sakagami, Johzaki, Nagatomo and Mima2006, Reference Sakagami, Johzaki, Nagatomo and Mima2009; Nagatomo et al., Reference Nagatomo, Ohnishi, Mima, Sawada, Nishihara and Takabe2002; Johzaki et al., Reference Johzaki, Mima, Nakao, Yokota and Sumita2003, Reference Johzaki, Sakagami, Nagatomo and Mima2007; Sunahara et al., Reference Sunahara, Nishihara and Sasaki2008; Nakamura et al., Reference Nakamura, Mima, Sakagami, Johzaki and Nagatomo2008; Chrisman et al., Reference Chrisman, Sentoku and Kemp2008; Kemp et al., Reference Kemp, Sentoku and Tabak2008; Cai et al., Reference Cai, Mima, Sunahara, Johzaki, Nagatomo, Zhu and He2010). In simulations of fast ignition, the overall fluid dynamics of implosion, laser-plasma interactions and fast electron generation, and fast electron energy deposition within the core must be calculated. However, it is extremely difficult to simulate all these phenomena with a single simulation code because they are dominated by different physics, each having very different time and space scales. Therefore, we developed the fast ignition integrated interconnecting (FI3) code, which includes all the important physics from implosion to core heating (Sakagami & Mima, Reference Sakagami and Mima2004; Sakagami et al., Reference Sakagami, Johzaki, Nagatomo and Mima2006, 2009; Johzaki et al., Reference Johzaki, Sakagami, Nagatomo and Mima2007). The typical scenario in FI3 simulations is summarized as follows. First, the overall fluid dynamics of the implosion process are calculated with the radiation hydrodynamic code PINOCO (Nagatomo et al., Reference Nagatomo, Ohnishi, Mima, Sawada, Nishihara and Takabe2002). Second, the relativistic Particle-In-Cell (PIC) code FISCOF (Sakagami & Mima, Reference Sakagami and Mima2002) is used to simulate interactions between the heating laser and the plasmas; PINOCO-calculated plasma profiles are introduced to this simulation as background profiles. Third, energy deposition to the core is calculated with the Fokker-Planck code FIBMET (Johzaki et al., Reference Johzaki, Mima, Nakao, Yokota and Sumita2003) using PINOCO-calculated plasma profiles and FISCOF-simulated fast electron characteristics.
A cone-guided target, of which the inner surface of the cone is coated with low-density foam, is proposed for FIREX-I. Preformed plasmas (preplasmas) generated by a heating laser prepulse are a critical issue in fast ignition because the preplasma greatly affects fast electron generation and hence core heating (Chrisman et al., Reference Chrisman, Sentoku and Kemp2008; Kemp et al., Reference Kemp, Sentoku and Tabak2008; Cai et al., Reference Cai, Mima, Sunahara, Johzaki, Nagatomo, Zhu and He2010). As it is difficult to completely eliminate the prepulse preceding the main pulse from the laser system, preplasma creation is unavoidable. Although the preplasma profile depends on the prepulse properties, these properties are not easily controllable. Thus, it is conceived to control fast electron generation by coating the inner surface of the cone with low-density foam and simulation studies indicate that such a coating enhances fast electron generation (Sakagami et al., Reference Sakagami, Johzaki, Nagatomo and Mima2009). However, these simulations ignore the preplasma created by prepulse interactions with the foam. In this paper, we investigate the effects of a preplasma located in front of the foam on fast electron generation using the relativistic PIC code. We also estimated its effects on core heating by FI3 simulations.
2. PREPLASMA EFFECTS ON FAST IGNITION
We adopt CH as a suitable material to make a low-density foam. The CH foam is ionized by the heating laser prepulse and the preplasma is created. The process of preplasma creation is affected mainly by the ionization process. Thus, it is necessary to calculate the interaction between the prepulse and the CH foam by a code that can handle the ionization process. The main pulse of the heating laser interacts with the preplasma. During this time, the interaction is calculated with the relativistic PIC code to investigate the characteristics of the fast electrons that are generated.
2.1. Preplasma Profiles
Interactions between the heating laser prepulse and the CH foam were calculated to obtain the preplasma profiles. The heating laser was set to λL = 1.06 µm and I L = 1019 W/cm2, the parameters of the LFEX laser. The contrast ratio was assumed to be 108; thus, the prepulse was set to I L = 1011 W/cm2 and τL = 1 ns. The average density of the CH foam was set to that can be produced, namely 100 mg/cm3. The calculation was performed with the one-dimensional (1D) Lagrangian radiation hydrodynamic code Star-1D, which includes photoexcitation effects using detailed atomic data (Sunahara et al., Reference Sunahara, Nishihara and Sasaki2008). The obtained profiles of electron density, average ionization degree, and electron temperature are shown in Figure 1. The electron density profile exhibits steepening because of the ablation reaction. The electron density profile of the preplasma approximately consists of three exponential profiles with L pre = 56.9, 18.0, and 0.869 µm. Its average ionization degree is approximately 3.5, which indicates full ionization. We used the fitted electron density profile and assumed a fully ionized preplasma, but we did not include the obtained temperature profile in our simulations because the leading part of the main pulse instantaneously heats the plasmas to an extremely high temperature.
(Color online) Profiles of physical values obtained by the simulation of preplasma creation; solid red, dashed blue, and dashed green lines indicate the electron density, average ionization degree, and electron temperature, respectively.

2.2. Fast Electron Generation
Interactions between the main pulse and the target with the preplasma were calculated using the 1D relativistic PIC code FISCOF1 (Sakagami & Mima, Reference Sakagami and Mima2002). The preplasma profiles obtained in Section 2.1 were used.
Figure 2 shows the initial electron density profiles of the target with the preplasma. The Au plasma has a flat profile with the average ionization degree 〈Z 〉 = 40, the mass number A = 197, 10 µm thickness and the electron density 100n cr. The CD plasma has also the flat profile with 〈Z〉 = 3.5, 〈A〉 = 7, 35 µm thickness and 100n cr. The ionization degrees of the Au and CD plasmas are estimated from simulation results of the radiation hydrodynamic code PINOCO. The CH foam was introduced in front of the Au plasma, and the preplasma was located in front of the CH foam. We assumed full ionization on the basis of the preplasma simulations and set the averaged ionization degree and the averaged mass number of CH plasmas to 3.5 and 6.5, respectively. The CH foam plasma has a flat profile with 20 µm thickness and n foam, and the preplasma has three exponential profiles with scale lengths L pre = 56.9 (0.10–0.22n cr), 18.0 (0.22–0.80n cr), and 0.869 µm (0.80-n foam), where n foam is set to 10, 20, 40, or 80n cr to investigate the dependence of the fast electron characteristics on the foam density. In the simulations, the generated fast electrons were reflected by a sheath field at the right edge of the CD plasma, and thus circulation occurred. To avoid this, fast electrons were artificially cooled to the initial temperature in the rear part (x = 35–45 µm) of the CD plasma. Fast electrons were observed in the CD plasma, 10 µm behind the Au-CD boundary. The intensity of the heating laser was assumed to be 1020 W/cm2 because the intensity of the LFEX laser is 1019 W/cm2 but the cone concentrates the light. The laser intensity increased with a Gaussian profile having a half-width at half maximum of 375 fs and was kept constant for 2500 fs after reaching the maximum. It then decreased with a Gaussian profile having a half-width at half maximum of 375 fs. We performed simulations under these conditions and compared the results with and without preplasmas.
(Color online) Initial electron density profile of a target with the preplasma.
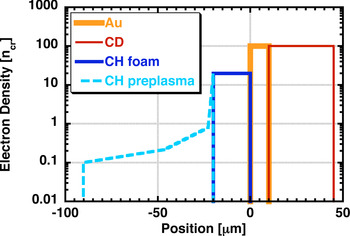
Figure 3 shows the time evolutions of the fast electron beam intensities with and without preplasmas for n foam = 10, 20, 40, and 80n cr. The fast electron beam intensity began to rise 200 fs later with the preplasma than without it. The time at which the main pulse started to interact with the leading edge of the plasma was defined as zero in the simulations; therefore, fast electrons took longer to arrive at the observation point with the preplasma than without it. Because the preplasma was approximately 70 µm long, and fast electrons propagate at almost speed of light, their estimated time lag is 233 fs, which agrees well with the observed delay. When n foam = 10 and 20n cr, the evolutions of the fast electron beam intensities with and without preplasmas do not differ significantly. When n foam = 40 and 80n cr, however, the fast electron beam intensity with the preplasma is much higher than that without it after 800 fs.
(Color online) Time evolutions of fast electon beam intensity with and without preplasma for n foam = (a) 10, (b) 20, (c) 40, and (d) 80n cr.

Figure 4 shows time-integrated energy spectra of fast electrons with and without preplasmas for n foam = 10, 20, 40, and 80n cr; the integration time ranges from 0 to 8000 fs. When n foam = 10 and 20n cr, energy spectra with and without preplasmas are almost the same. When n foam = 40 and 80n cr, more fast electrons are generated with the preplasma than without it. In particular, the high-energy component (>5 MeV) of fast electrons is generated only when the preplasma exists.
(Color online) Time-integrated energy spectra of fast electrons with and without preplasmas for n foam = (a) 10, (b) 20, (c) 40, and (d) 80n cr; integration time ranges from 0 to 8000 fs.

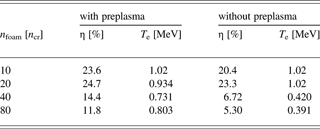
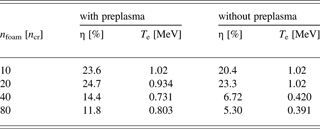
Coupling efficiencies from the laser to the observed fast electrons (η) and the slope temperatures of the electrons (T e) for n foam = 10, 20, 40, and 80n cr with and without preplasmas are summarized in Table 1. The estimated slope temperatures are between 0.5 and 4 MeV. The laser coupling efficiencies of fast electrons with and without preplasmas are similar when n foam = 10 and 20n cr. In contrast, the laser coupling efficiency with the preplasma is higher than that without it when n foam = 40 and 80n cr. The slope temperatures show the same tendencies. The effective electron temperature estimated by Beg's law (Beg et al., Reference Beg, Bell, Dangor, Danson, Fews, Glinsky, Hammel, Lee, Norreys and Tatarakis1997) is approximately 1.04 MeV. This agrees well with the temperatures for n foam = 10 and 20n cr with and without preplasmas and is similar with those for n foam = 40 and 80n cr with the preplasma.
Coupling efficiencies from the laser to the observed electrons and slope temperatures of the electrons for nfoam = 10, 20, 40, and 80ncr with and without preplasmas.
The above results show a clear difference between the preplasma effects for n foam < 20n cr and n foam > 40n cr. Therefore, we studied 20 and 40n cr cases in detail. Figure 5 shows the energy spectra of fast electrons for (n foam, t) = (20n cr, 1200 fs), (20n cr, 2400 fs), (40n cr, 1200 fs), and (40n cr, 2400 fs). We compared the results at different times because fast electrons with the preplasma reach the observation point 200 fs later than those without it, as stated above. For 20n cr at 1200 fs, the high-energy (>5 MeV) component of fast electrons with the prelasma is generated, but those generated without the preplasma have no high-energy component. However, the energy spectra with and without preplasmas for 20n cr are similar except in the early stage. The number of electrons in the high-energy component at 1200 fs is negligible compared to that at 2400 fs. Thus, the difference in the early stage does not appear in the time-integrated energy spectra, and the spectra are similar. For 40n cr, more fast electrons are generated in the high- and low- (<5 MeV) energy components with the preplasma than without it at 1200 fs. This difference becomes somewhat small at 2400 fs, but still appears. Thus, an obvious difference appears in the time-integrated energy spectra of fast electrons for 40n cr (Fig. 4).
(Color online) Energy spectra of fast electrons for (n foam, t) = (a) (20n cr, 1200 fs), (b) (20n cr, 2400 fs), (c) (40n cr, 1200 fs), and (d) (40n cr, 2400 fs). Results at different times are compared because fast electrons with the preplasma reach the observation point 200 fs later than those without it.

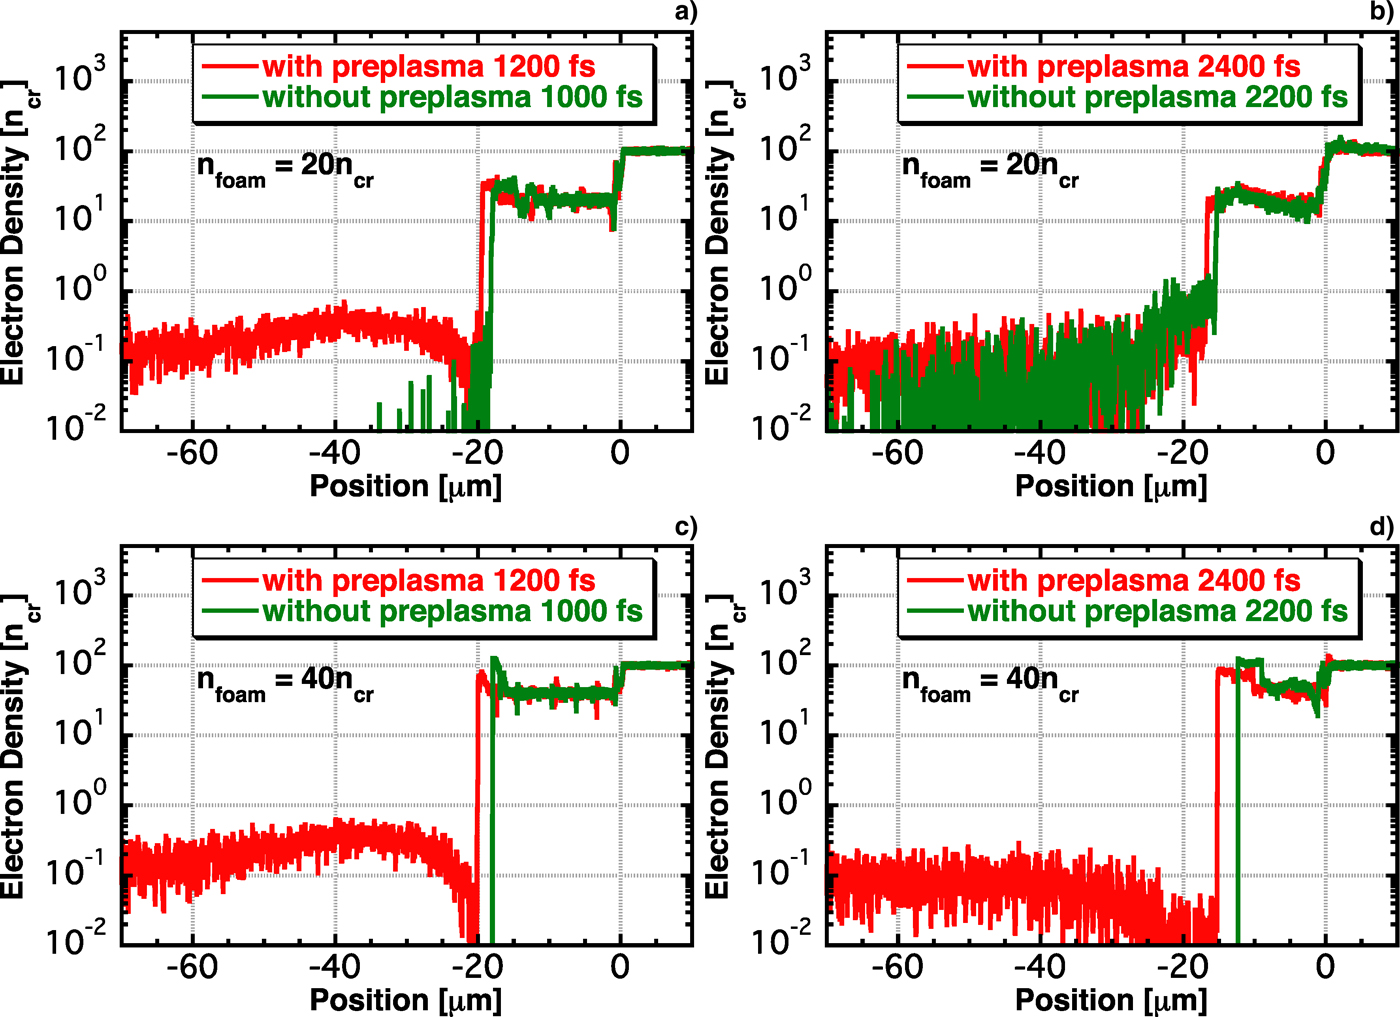
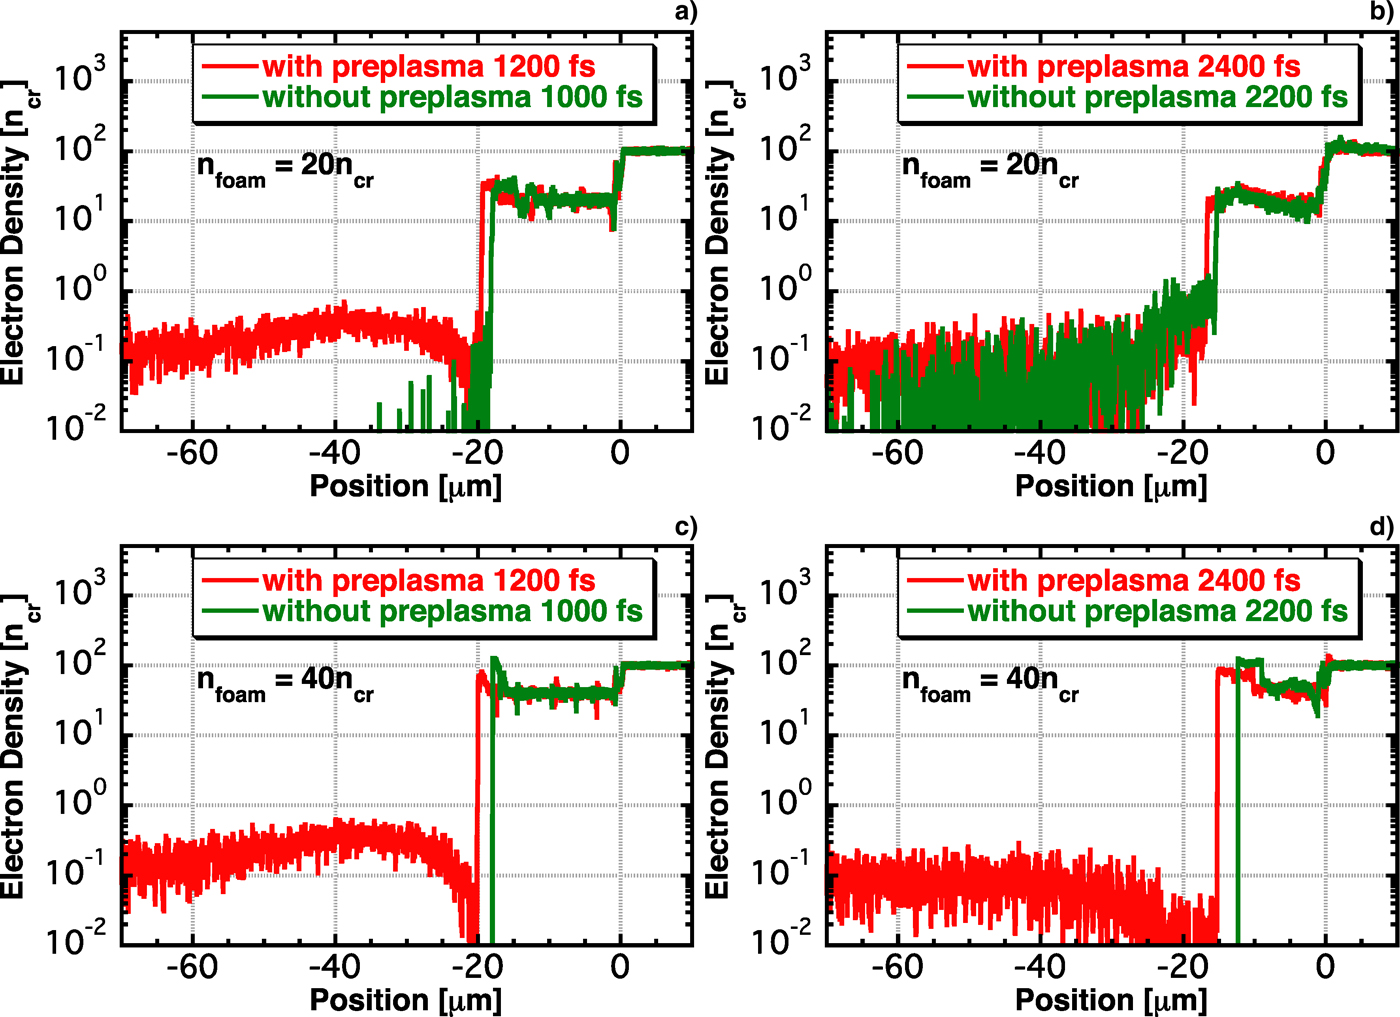
Figure 6 shows electron density profiles for (n foam, t) = (20n cr, 1200 fs), (20n cr, 2400 fs), (40n cr, 1200 fs), and (40n cr, 2400 fs). At 1200 fs, a low-density plasma exists for n foam = 20n cr with the preplasma, and no low-density plasma exists without the preplasma. It is considered that the existence of the low-density plasma causes high energy fast electron generation. At 2400 fs, the low-density plasma is created in front of the foam plasma even without the preplasma. As the low-density plasma is the source of high-energy fast electrons, these electrons are generated both with and without preplasmas. The low-density plasma is blown away from the laser front plasma after 1200 fs and continues to be generated. When n foam = 40n cr without the preplasma, the low-density plasma is not created at 1200 and 2400 fs. When the preplasma exists, the low-density plasma appears at both 1200 and 2400 fs. Because the differences in electron density profiles are maintained untill approximately 3000 fs, when the laser intensity drops, high-energy fast electrons are generated only when the preplasma exists.
(Color online) Electron density profiles for (n foam, t) = (a) (20n cr, 1200 fs), (b) (20n cr, 2400 fs), (c) (40n cr, 1200 fs), and (d) (40n cr, 2400 fs).
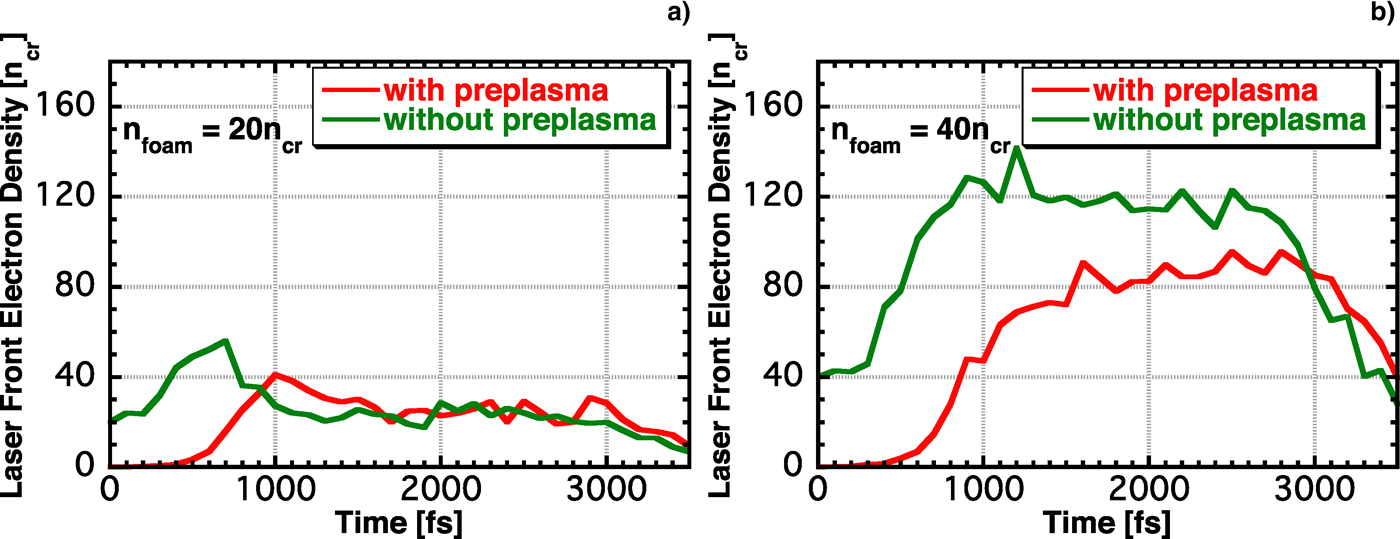
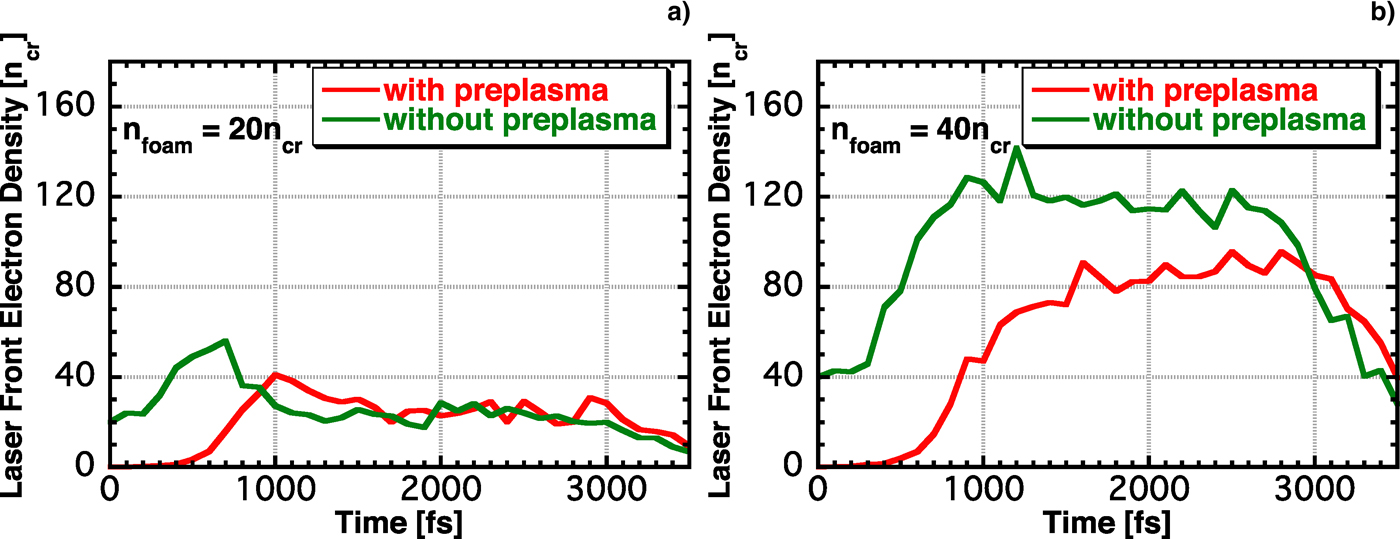
High-energy fast electrons are generated from underdense plasmas, but most of the fast electrons are generated at the laser front. Therefore, we examined the electron density at the laser front. The laser front is defined as the point at which the electromagnetic fields evanesce, and the electron density at this point is defined as the laser front electron density. Figure 7 shows the time evolutions of the laser-front electron density for n foam = 20 and 40n cr. No data appear after 3500 fs because the laser front electron density cannot be determined after the laser intensity drops. When n foam = 20n cr, the laser front electron density with the preplasma is smaller than that without it at the early stage, and the densities are similar after 1000 fs. On the other hand, when n foam = 40n cr, the laser front electron density with the preplasma remains smaller than that without it untill the laser intensity drops. The fast electron beam intensity reportedly becomes low as the laser front electron density increases (Sakagami et al., Reference Sakagami, Johzaki, Nagatomo and Mima2009). Thus, the fast electron beam intensities are similar for n foam = 20n cr with and without preplasmas, and the fast electron beam intensity with the preplasma is higher than that without it when n foam = 40n cr.
(Color online) Time evolutions of the laser front electron density for n foam = (a) 20 and (b) 40n cr.
To study why the low-density plasma is blown away, we evaluated pressure in the laser front plasma. Figure 8 shows electron pressure profiles for n foam = 20 and 40n cr with and without preplasmas at 2400 fs; red, green, blue, and sky blue lines indicate the average electron pressures with and without preplasmas and the light pressures for perfect reflection and perfect absorption, respectively. When n foam = 20n cr, the electron pressure at the laser front is equivalent to the light pressure for perfect reflection. In contrast, when n foam = 40n cr, it is smaller than the light pressure for perfect reflection and is approximately that for perfect absorption. As the laser is partially absorbed, the actual laser can lie between the pressures for perfect reflection and perfect absorption. Thus, the electron pressure at the laser front is greater than the light pressure when n foam = 20n cr, but smaller than the light pressure when n foam = 40n cr. As a result, the low-density plasma can be ejected when n foam = 20n cr, but not when n foam = 40n cr.
(Color online) Electron pressure profiles for nfoam = (a) 20 and (b) 40ncr with and without preplasmas; red, green, blue, and sky blue lines indicate average electron pressures with and without preplasmas at 2400 fs and the light pressures for perfect reflection and perfect absorption, respectively.

2.3. Core heating
Finally, we evaluated the effects of the preplasma on core heating under the parameters of the four-beam LFEX laser. The heating laser parameters were set to λL = 1.06 µm, I L = 1020 W/cm2, τHWHM,rise/fall = 375 fs, τflat = 10 ps; the pulse duration was longer than the previous one (τHWHM,rise/fall = 375 fs, τflat = 2.5 ps) because we assume the LFEX design value, 10 kJ/10 ps. The other simulation parameters were the same as in the previous simulation, except for some changes. The electron densities of both the Au and CD plasmas were greater than these in the previous simulations and were set to 500n cr, and the thickness of the CD plasma was 50 µm. The CH foam plasma had an electron density of 20n cr and a thickness of 60 µm, and these parameters were chosen on the basis of optimum foam conditions in an earlier study (Sakagami et al., Reference Sakagami, Johzaki, Nagatomo and Mima2009).
Figure 9 shows the time evolutions of the fast electron beam intensities with and without preplasmas. The electron beam intensity with the preplasma is slightly lower than that without it from 4 to 10 ps. This relationship is then reversed, however, and it is clearly different after 10 ps because the laser interacts directly with the high-density plasma as it blows away the low-density foam when no preplasma exists.
(Color online) Time evolutions of fast electron beam intensities with and without preplasmas.

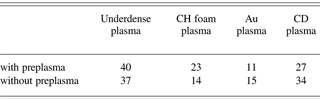
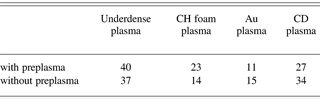
Figure 10 shows time-integrated energy spectra with and without preplasmas; the integration times range from 0 to 10 ps and from 10 to 15 ps. In the time-integrated energy spectra from 10 to 15 ps shown in Figure 10b, more fast electrons are generated with the preplasma than without it because of the above relationship. Moreover, the time-integrated energy spectra before 10 ps are similar, but slightly fewer fast electrons are generated with the preplasma than without it. To determine the reason, we calculated electron energies. Table 2 summarizes the energy ratios [%] of each plasma with respect to the total electron energy at 7.5 ps. The plasmas are underdense, CH foam, Au, and CD plasmas, where underdense plasma is defined as that which exists in front of the laser reflected point. When the preplasma exists, the contribution of the energy in the CH foam plasma is larger than that without preplasma. In addition, the contribution of the energy in the underdense plasma exhibits the same tendency. In contrast, the energies of the Au and CD plasmas with the preplasma are less than those without it. More laser energy is believed to be converted to electron energy of the CH foam plasma when the preplasma is present than when it is not because the CH foam plasma in the case with the preplasma is remained more than that without it. Therefore, the observed fast electrons with the preplasma are less energetic than those without it, as shown in Figure 10a.
(Color online) Time-integrated energy spectra with and without preplasmas; the integration times range (a) from 0 to 10 ps and (b) from 10 to 15 ps.

Energy ratios [%] of each plasma with respect to the total electron energy at 7.5 ps
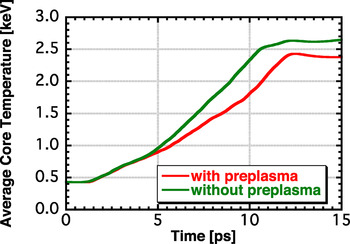
We performed a core heating simulation using the FI3 code. Assuming the same core parameters as in an earlier study (Johzaki et al., Reference Johzaki, Sakagami, Nagatomo and Mima2007), the average core temperatures of electrons were estimated by Fokker–Planck simulations. Figure 11 shows the time evolutions of average core temperatures with and without preplasmas. The average core temperature with the preplasma is lower than that without it after 4.5 ps. The difference between the two cases increases until 10.5 ps because fewer fast electrons are generated with the preplasma than without it, as shown in Figure 10a. However, it decreases after 10.5 ps, because of the presence of more fast electrons with the preplasma than without it, as shown in Figure 10b. These results are consistent with the time evolution of the fast electron beam intensity shown in Figure 9. The temperature with the preplasma cannot reach that without it because the difference in Figure 10b is greater than that in Figure 10a. The temperature with the preplasma at 10.5 ps is 17% lower than that without it, and the maximum core temperature with the preplasma decreases by approximately 10% compared to that without it, reaching 2.4 keV.
(Color online) Time evolutions of average core temperatures of electrons with and without preplasmas.
3. SUMMARY
We performed 1D PIC simulations to estimate the effects of the preplasma on fast electron characteristics for the case of CH foam coated cone-guided target. The effects varied greatly depending on the foam's electron density. The preplasma did not signigficantly affect the fast electron characteristics when the foam's electron density was less than 20n cr, but it enhances fast electron generation when the foam's electron density was more than 40n cr. These differences could be determined depending on whether the low-density plasma can be blown away. When the density was less than 20n cr, the low-density plasma was blown away when the electron pressure was equivalent to or greater than the laser pressure, and it rolled the preplasma. Hence, the fast electron characteristics with and without preplasmas were similar. In contrast, the low-density plasma could not be blown away when the density was more than 40n cr without the preplasma; hence, the laser front electron density remained high for a long time. When the preplasma existed, the laser front electron density remained relatively low. Therefore, more fast electrons were generated with the preplasma than without it when the density was more than 40n cr.
We also performed integrated simulations to estimate the effects of the preplasma on core heating under more typical operating conditions by considering the real LFEX laser parameters and denser targets. The optimum foam parameters reported in an earlier study (Sakagami et al., Reference Sakagami, Johzaki, Nagatomo and Mima2009) were used in these simulations. The resulting fast electron characteristics were similar, and the preplasma did not significantly affect fast electron generation, although it was a slightly suppressed. Therefore, the average core temperatures was approximately 10% lower than that without the preplasma, reaching 2.4 keV. If a large preplasma exists and has a longer scale length and larger volume than that considered in this paper, its presence may prevent core heating to a greater degree because the number of fast electrons will be less. In addition, fast electron divergence is significant because the fast electron generation point is far from the compressed core in such a case. Because our conclusion is based on 1D PIC simulations, multi dimensional simulations are needed to clarify this point and estimate the fast electron divergence.