Implications
The majority of meat quality defects are directly related to preslaughter procedures, which are known to influence the physiological state of pigs before and at slaughter. Hence, the Lactate Scout Analyzer used in this study may be an accurate tool to assess the physiological condition of pigs under commercial conditions, and to predict the variation of meat quality traits. Furthermore, it may allow plant managers to identify critical points to be controlled in the preslaughter procedures in order to improve animal handling, facilities design, etc., and ultimately to limit meat quality losses.
Introduction
Muscular activity requires energy, which is provided by the breakdown of glycogen in the skeletal muscles. During intense muscular activity, the oxygen supply is often insufficient, so the energy is released through an anaerobic process, which converts pyruvate to lactate (Nelson and Cox, Reference Nelson and Cox2008). Therefore, lactate is either released into the blood flow in very disturbed or frightened animals or when there is some muscle damage (bruising), caused by vigorous physical exercise (Broom, Reference Broom1995), and indicates an acidosis status of the pig as showed by the low blood pH (Ritter et al., Reference Ritter, Ellis, Berry, Curtis, Anil, Benjamin, Butler, Dewey, Driessen, DuBois, Hill, Marchant-Forde, Matzat, McGlone, Mormede, Moyer, Pfalzgraf, Salak-Johnson, Sterle, Stull, Whiting, Wolter, Niekamp and Johnson2009). Earlier studies have associated greater values of exsanguination blood lactate to poor pork quality (Correa et al., Reference Correa, Torrey, Devillers, Laforest, Gonyou and Faucitano2010; Edwards et al., Reference Edwards, Engle, Correa, Paradis, Grandin and Anderson2010). As blood lactate is not influenced by post-stunning handling (Aalhus et al.,Reference Aalhus, Gariépy, Murray, Jones and Tong1991) and is a very short-term stress indicator (higher peak in 4 min and return to basal levels in 2 h after physical exercise; Anderson, Reference Anderson2010), the greater lactate level in blood at slaughter definitely mirrors the physiological state of pigs before slaughter. For practical reasons, there is a need to develop a blood lactate measurement in the bleeding rail at the slaughter plant alternative to the traditional time-consuming enzymatic analytical procedure. The hand-held Lactate Scout Analyzer (LSA; EKF Diagnostic GmbH, Magdeburg, Germany) is being increasingly used for the measurement of blood lactate at swine slaughter plants, based on its strong correlation (r=0.97; Edwards et al., Reference Edwards, Engle, Correa, Paradis, Grandin and Anderson2010) with the enzymatic procedure. This device would allow the monitoring of lactate variation in commercial conditions and assist in the development of improved animal handling methods before stunning. LSA blood lactate levels proved to be significantly correlated, although weakly, with a few pork quality traits, such as pH value 1 h postmortem and drip loss in the loin muscle (Edwards et al., Reference Edwards, Engle, Correa, Paradis, Grandin and Anderson2010). The low correlations reported in this study may be explained by the small sample size (n=128 pigs), the low-stress handling conditions and by the fact that only the loin muscle was used for meat quality evaluation. There is evidence that the longissimus muscle may not be the most suitable muscle to study meat quality variation in relation to physical stress (Correa et al., Reference Correa, Torrey, Devillers, Laforest, Gonyou and Faucitano2010).
Therefore, the objectives of this study were twofold: (1) to assess the relationship between lactate levels in blood collected at different points on the slaughter line and pork quality variation (in loins and hams) on a large sample size and under commercial preslaughter handling conditions and (2) to evaluate LSA’s reliability as tool to prevent meat quality losses.
Material and methods
Animal ethics
All experimental procedures performed in this study were approved by the institutional animal care committee based on the current guidelines of the Canadian Council on Animal Care (2009).
Animals and treatments
In a 6-week trial, a total of 600 market-weight pigs (crossbreed F1 Yorkshire female×Landrace sired with Duroc boar) were randomly chosen on arrival at a commercial slaughter plant (slaughter speed of 500 pigs/h; 7000 pigs/day) located in Eastern Canada over 6 slaughter days (1 day/week and 100 pigs/day). On each slaughter day, multiple trucks were randomly sampled to get 100 pigs (10% to 15% of total load/truck). Random selection of pigs was chosen in order to ensure the largest variation in pigs’ physical conditions on arrival at the plant, with pre-transport fasting interval ranging from 6 to 12 h and transport time ranging from 0.5 to 5 h. Animals were identified by a numbered plastic ear tag to facilitate their identification at each sampling point and to track the carcasses for the meat quality assessment after slaughter. Pigs were distributed into two main groups of 50 pigs each. The first group of 50 pigs was kept in one pen in lairage overnight (G1; n=300), whereas the second group was kept in two pens, with 25 pigs each, and kept in lairage between 2 and 3 h before slaughter (G2; n=300). In lairage, stocking density in the pen was 0.58 m2/pig for both groups. The stocking density in the lairage pen was controlled in this study as it may interfere, more than group size, on the effects of lairage time on pigs’ resting behaviour (Moss, Reference Moss1978). During lairage water was available through nipple type drinkers. Both lairage groups were sprinkled in the rest pen during the 30 to 45 min of end of lairage. Pigs were electrically stunned (head-to-chest electrical stunning) before exsanguination in the prone position.
Blood lactate analysis
Blood samples were collected from each pig by pricking one of the animal’s distal ear veins with a retractable gauge needle. A drop of blood from the animal’s ear was immediately dripped onto a sample strip (two strips or replicate/animal) and inserted into a hand-held LSA (EKF Diagnostic GmbH, Magdeburg, Germany), and the results were obtained in ~15 s. Pigs were sampled for lactate analysis at four different sampling points: at unloading (UN; n=600), after lairage at the exit of the resting pen (LA; n=600) and in the restrainer before stunning (RE; n=600). The blood collection in the restrainer was carried out by stopping the restrainer for a few seconds right after the entrance of the animal into it. After electrical stunning, exsanguination blood was collected from the bleeding wound (EX; n=600) in a plastic cup and lactate level was immediately assessed in duplicate with the LSA by dipping the test strips in the collected blood sample in order to collect 0.5 µl of blood in each strip. The bleeding wound was preferred for blood sampling at exsanguination instead of the ear based on the positive correlations between lactate content in the ear venous blood and that in the jugular venous and arterial blood (r=0.80 and r=0.74, respectively; P<0.001 for both sampling locations) obtained in a preliminary study (unpublished results).
Meat quality measurements
Each slaughter week, 25 carcasses were selected from each lairage groups (50 carcasses/slaughter day; total of 300 carcasses) according to the blood lactate level at exsanguination with the objective to ensure a large range of blood lactate levels and meat quality traits. About 35 min after slaughter, carcasses were blast chilled (−20°C) for 90 min and then transferred to standard chilling rooms (3°C) where they were kept until the next day.
Meat quality was assessed in the Longissimus thoracis (LT; at the 3rd/4th last rib), Semimenbranosus (SM; in the middle region) and Adductor (AD) muscles. Muscle pH was measured at 30 min postmortem (pH1) in the LT and in the SM muscles by means of a portable pH meter (Model pH 100 Series; Oakton Instruments, Vernon Hills, IL, USA) fitted with a Cole Parmer spear tip electrode (Cole Palmer Instrument Company, Vernon Hills, IL, USA) and an automatic temperature compensation probe. This measurement was repeated at 24 h postmortem (pHu) in the same muscles and in the AD muscle. At 24 h postmortem, colour data were collected on the LT and SM muscles at the aforementioned anatomical locations after 30 min blooming time. Visual colour was evaluated using the Japanese color standards (Nakai et al., Reference Nakai, Saito, Ikeda, Ando and Komatsu1975) in the LT muscle only, whereas instrumental colour (L*, a* and b* values) was measured with a Minolta Chromameter (CR-300; Minolta Canada Inc., Mississauga, Canada) equipped with a 25-mm aperture, 0° viewing angle and D65 illuminant in the LT and SM muscles. Drip loss was measured in a LT muscle chop removed at the 3rd/4th last rib level and in the middle region of the SM muscle by a modified EZ-DripLoss procedure (Correa et al., Reference Correa, Méthot and Faucitano2007). Briefly, three 25-mm diameter cores were removed from the centre of a 2.5-cm thick LT and SM muscle cross-section, weighed and placed into plastic drip loss containers (Christensen Aps Industrivaengetand, Hilleroed, Denmark), before being stored for 48 h at 4°C. At the end of the 48-h storage period, muscle cores were removed from their containers, surface moisture was carefully dabbed, cores were re-weighed and drip loss percentage was calculated by dividing the difference between initial and final core weights by the initial core weight.
The floppiness score of the LT muscle was assessed by finger testing before dissection by a trained evaluator using a subjective scale ranging from 1 to 3 (1=very soft and watery to 3=very firm and dry; National Pork Board, 2000).
A sample of the LT muscle was also harvested in the region of the 3rd/4th last rib and immediately frozen in liquid nitrogen at 24 h postmortem for the analysis of the glycolytic potential (GP). The analysis was performed according to the method described by Monin and Sellier (Reference Monin and Sellier1985) with some modifications and following the extraction protocol described by Bergmeyer et al. (Reference Bergmeyer, Bern, Schmidt and Stork1974). Briefly, 1 g of the LT muscle was homogenized in a Polytron device (System Polytron® PT 3100, Kinematica AG, Luzern, Switzerland) and then the samples were centrifuged at 2000×g for 20 min at 4°C. For the enzymatic determination of glycogen, glucose and glucose-6-Phosphate, 500 μl were transferred to glass tubes and the rest of homogenate was filtered with a filter paper (Whatman # 4; Buckinghamshire, UK) and the homogenate was kept at 4°C for the enzymatic determination of lactate. The samples were homogenized in buffer containing Rhizopus amyloglucosidase to decompose glycogen to glucose and glucose-6-phosphate. Lactate concentration in the homogenized samples was determined using NAD and lactate dehydrogenase. Glucose concentration was determined using a NAD, glucose-6-phosphate, ATP and enzymatic solution of hexokinase. The GP was quoted in terms of potential lactate formation according to the following formula proposed by Monin and Sellier (Reference Monin and Sellier1985): 2 ([glycogen]+[glucose]+[glucose-6-phosphate])+[lactate]. GP is expressed as µmole glucose equivalent/g of fresh muscle.
Statistical analyses
All statistical procedures performed in the current study were carried out using the Statistical Analysis Software (SAS Institute Inc., Cary, NC, 2002). Blood lactate values were log-transformed (log10) for data normalization before analysis. Log values were analysed for each sampling point with the MIXED procedure of SAS using sampling points as repeated measures in a one-way ANOVA for the group effect with the animal as the experimental unit and the week as random effect. Resulting adjusted means and confidence limits were back transformed to the original scale and used to build up Figure 1. Multiple comparisons between sampling points were adjusted with a Tukey–Kramer correction.
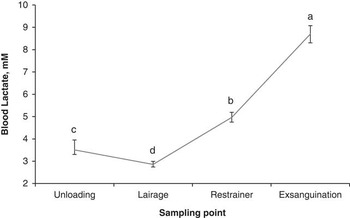
Preslaughter variation of blood lactate levels (mM; ±confidence limits) collected in pigs at four different sampling points at the slaughter plant. Between sampling points, means with a different letter differ significantly (P<0.001).

ANOVA for quality traits, potential glycolytic, muscle lactate and muscle glucose were carried out using the MIXED procedure of SAS. The model included the group as a fixed effect, the animal as the experimental unit and the week as a random effect. For variables showing a non-normal distribution of residuals, the analysis was performed with the non-parametric Wilcoxon Mann–Whitney test, using the NPAR1WAY procedure with the WILCOXON option. Spearman correlations were performed between blood lactate concentration at different sampling points and meat quality. Floppiness scores were analysed by the FREQ procedure of SAS using the Cochran–Mantel–Haenszel statistic to determine the effect of group on the mean score.
Results and discussion
Blood lactate variation
The physical activity associated with handling and fighting in lairage may cause physiological changes in pigs during the preslaughter period. As showed in Figure 1, in this study average lactate levels were of 3.66 mM (range: 3.50 to 3.83 mM) at unloading, dropped to 2.88 mM (range: 2.77 to 3.00 mM; P<0.001) after resting in the lairage pen, regardless of the resting time and increased to 5.00 mM (range: 4.81 to 5.19 mM; P<0.001) before stunning and to 8.71 mM (range: 8.37 to 9.08 mM) at exsanguination. The increase in blood lactate concentration between LA and RE reflects the progressively higher level of muscle activity and stress as the animals are handled and pass from a free-moving group situation to a single line of aligned and restrained individuals. Other studies also reported increased blood concentration of lactate at exsanguination (Hunter et al., Reference Hunter, Weeding, Guise, Abbott and Penny1994; Edwards et al., Reference Edwards, Engle, Grandin, Ritter, Sosnicki, Carlson and Anderson2011), and body temperature (Stewart et al., Reference Stewart, Webster, Schaefer, Cook and Scott2005) in pigs being moved forward in a single line to the stunning point.
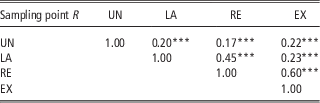
Based on the highest correlation between RE and EX blood lactate levels (r=0.60; P<0.001; Table 1), the measurement of blood lactate level using the LSA at the entrance into the restrainer appears to be the best indicator of physical fatigue of pigs at slaughter. However, our results also showed an increase in the blood lactate level between RE and EX (P<0.001; Figure 1), meaning that electrical stunning may have an impact on the rate of lactate release into the blood flow at slaughter in this study. Greater blood lactate levels have also been reported in electrically v. gas stunned pigs by Bertoloni et al. (Reference Bertoloni, Silveira, Ludtke and Costa2006). This difference can be explained by the greater muscle contraction (tonic phase) in response to electrical current application.
Spearman correlations between lactate concentrations collected in pigs at four different sampling points at the slaughter plant

UN=unloading (n=600); LA=end of lairage (n=583); RE=restrainer (n=581); EX=exsanguination (n=583).
***P<0.001.
Similarly to Edwards et al.’s study (Reference Edwards, Engle, Grandin, Ritter, Sosnicki, Carlson and Anderson2011), EX blood lactate levels as measured by the LSA in this study were lower than those reported by Hambrecht et al. (Reference Hambrecht, Eissen, Nooijen, Ducro, Smits, Den Hartog and Verstegen2004 and Reference Hambrecht, Eissen, Newman, Smits, Verstegen and Den Hartog2005) that reported lactate values ranging from 12 to 31 mM in exsanguination blood analysed with the traditional enzymatic procedure. The explanation for these differences between studies may be twofold: (1) the different distribution of lactate between whole blood (i.e. blood from which no constituent, such as red blood cells, white blood cells, plasma or platelets, has been removed according to the American Heritage® Science Dictionary, 2005) and plasma resulting in the underestimation of blood lactate concentrations when whole blood instead of plasma alone is used for analysis and (2) the difference in stress level (high v. minimal) experienced by pigs before slaughter in the two studies. Indeed, results obtained in a preliminary study showed that LSA is an efficient tool to detect pig fatigue after physical exercise based on the significant (P>0.001) increase in blood lactate levels from rest to post-handling stress, that is, pigs were imposed to walk at a fast pace for 250 m (2.41±0.84 v. 7.63±3.98 mM, unpublished results).
According to Pösö and Puolanne (Reference Pösö and Puolanne2005), blood lactate concentration may vary between 5 and 25 mM in meat animals. Furthermore, the distribution of lactate in blood does not appear to be homogenous (Harris and Dudley, Reference Harris and Dudley1989). For example, it was reported that whole blood lactate is ~40% lower than plasma lactate concentration, although they are strongly correlated (r=0.993; Foxdal et al., Reference Foxdal, Sjödin, Rudstam, Östman, Östman and Hedenstierna1990). The greater concentration of lactate in plasma compared with whole blood may explain the difference in lactate values reported by Hambrecht et al. (Reference Hambrecht, Eissen, Nooijen, Ducro, Smits, Den Hartog and Verstegen2004 and Reference Hambrecht, Eissen, Newman, Smits, Verstegen and Den Hartog2005) in blood plasma and those found in our study and in Edwards et al. (Reference Edwards, Engle, Correa, Paradis, Grandin and Anderson2010 and Reference Edwards, Engle, Grandin, Ritter, Sosnicki, Carlson and Anderson2011) where lactate content was analysed by the LSA in the whole blood. The underestimation of the blood lactate content as measured with the LSA may be also explained by the significant delay of the transfer of lactate from plasma into red cells in the whole blood after it is generated in the muscle tissue until a balance is reached (Forrest et al., Reference Forrest, Morton and Lambardarios1990).
Considering the speed rate of lactate to reach the maximum concentration after stress in blood (4 min; Anderson, Reference Anderson2010), the stress level applied in the perimortem phase may be another possible explanation for the difference in blood lactate contents between this study and those reported in the literature. Greater lactate concentrations in exsanguination blood have been reported in pigs aggressively moved (use of electric prods and yells) to the stunner (Hambrecht et al., Reference Hambrecht, Eissen, Nooijen, Ducro, Smits, Den Hartog and Verstegen2004). Whereas, similarly to Edwards et al. (Reference Edwards, Engle, Correa, Paradis, Grandin and Anderson2010), in this study where the perimortem handling conditions were controlled (i.e. driving small groups without electric prods), the stress level applied on pigs before stunning does not appear to have been sufficient to produce an elevation of lactate levels in blood at exsanguination. Benjamin et al. (Reference Benjamin, Gonyou, Ivers, Richardson, Jones, Wagner, Seneriz and Anderson2001) also reported no variation in blood lactate concentration in pigs that were pushed to walk a long distance (300 m), but were handled gently (natural pace without electric prods).
Effect of lairage time on blood lactate concentration
Differently from Warriss et al. (Reference Warriss, Brown, Edwards and Knowles1998) and Edwards et al. (Reference Edwards, Engle, Correa, Paradis, Grandin and Anderson2010) who reported greater exsanguination blood lactate levels in pigs after long lairage (overnight v. 4 h), blood lactate levels did not differ between lairage groups in this study, meaning that lairage time did not influence blood lactate concentration at slaughter (Table 2). Pérez et al. (Reference Pérez, Palacio, Santolaria, Aceña, Chacón, Verde, Calvo, Zaragoza, Gascón and Garcia-Belenguér2002) and Hambrecht et al. (Reference Hambrecht, Eissen, Newman, Smits, Verstegen and Den Hartog2005) did not find significant effect on blood lactate concentration at exsanguination between long (up to 9 h) and short (<45 min) lairage groups either.
Descriptive statistics of blood lactate levels (mM) per lairage groupFootnote 1 of pigs at four sampling points

UN=unloading; LA=end of lairage; RE=restrainer; EX=exsanguination.
1 G1=group kept in lairage overnight; G2=group kept in lairage between 2 and 3 h.
It is worth mentioning that blood lactate levels recorded at LA in this study were lower than 4 mM, which is the resting level of blood lactate reported for market-weight pigs in a previous study (Edwards et al., Reference Edwards, Engle, Grandin, Ritter, Sosnicki, Carlson and Anderson2011). Based on the speed of blood lactate level to return to rest level (120 min; Anderson, Reference Anderson2010), the low blood lactate levels after lairage recorded in this study would indicate that pigs had the adequate lairage conditions to recover from the stress of transport and unloading, regardless of the lairage time.
Meat quality
Effect of lairage time on meat quality traits
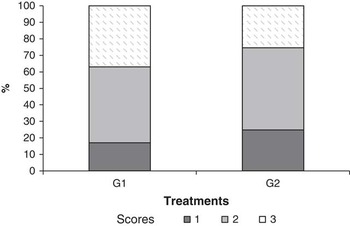
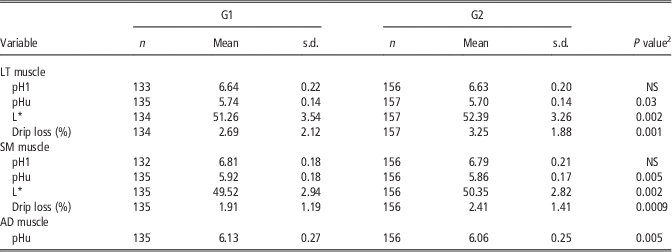
The purpose of lairage is to allow an opportunity for stressed and (or) fatigued animals to recover from loading and transport and to improve pork quality (Warriss, Reference Warriss2003). No difference was observed in pH1 between lairage groups. As expected, compared with 2 to 3 h lairage (G2), overnight lairage (G1) resulted in a greater pHu in the LT, SM and AD muscles (P=0.03, P=0.005 and P=0.005, respectively) and lower L* and drip loss values in the LT and SM muscles (P=0.002 for both muscles and P=0.001 and P<0.001, respectively; Table 3). Moreover, a greater (P=0.02) proportion of firm and dry (score 3) loins was found in G1 loins compared with G2 (37.0% v. 25.5%; Figure 2). Increased incidence of greater pHu and darker and firmer pork after long lairage has been extensively reported in the literature (Warriss, Reference Warriss2003) and is explained by muscle glycogen depletion caused by extended feed restriction and muscle fatigue (Fernandez and Tornberg, Reference Fernandez and Tornberg1991; Hambrecht et al., Reference Hambrecht, Eissen, Nooijen, Ducro, Smits, Den Hartog and Verstegen2004).
Comparison of scores frequency (from 1 to 3) for floppiness assessed by finger test in the longissumus thoracis (LT) muscle of pigs in two lairage groups. Floppiness scores: 1=very soft and watery; 2=normal and 3=very firm and dry. G1=group kept in lairage overnight; G2=group kept in lairage between 2 and 3 h.

Variation of meat quality characteristics in the longissimus thoracis (LT), semimembranosus (SM) and adductor (AD) muscles of pigs according to the lairage groupFootnote 1

1 G1=group kept in lairage overnight; G2=group kept in lairage between 2 and 3 h.
2 Z-Wilcoxon test.
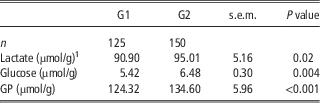
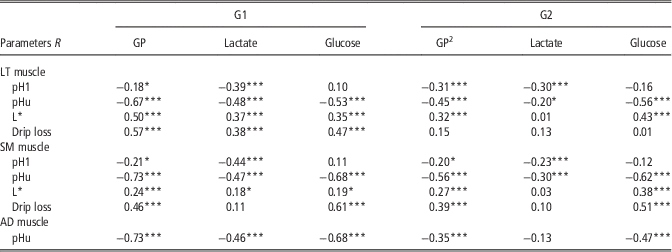
Overall, the GP values obtained in this study (Table 4) are within the range reported for the LT muscle of pigs in the literature (128 to 154 μmol/g fresh tissue; Przybylski et al., Reference Przybylski, Vernin and Monin1994; Hambrecht et al., Reference Hambrecht, Eissen, Nooijen, Ducro, Smits, Den Hartog and Verstegen2004). However, similarly to meat quality traits, lairage time had an effect on the GP of the LT muscle, with muscle lactate and glucose contents and GP values being lower (P=0.02, P=0.004 and P<0.001, respectively) in the LT muscle of pigs kept in lairage overnight (Table 4). Zhen et al. (Reference Zhen, Liu, Li, Ge, Chen, Li and Ren2013) also reported decreased lactate and glucose concentrations and GP value in the LT muscle of pigs as lairage time increased. The GP variation reflects the greater antemortem muscle energy exhaustion in the loin muscle of G1 pigs and contributes to explain the variation in pHu in the LT, SM and AD muscles (r=−0.67 and r=−0.73 for both SM and AD muscles, respectively; P<0.001 for all muscles), in drip loss (r=0.57; P<0.001) and L* value (r=0.50; P<0.001) in the LT muscle compared with G2 (Table 5). The correlation between GP of the LT muscle and pHu in the SM muscle is not surprising as these muscles have comparable metabolic characteristics (Laborde et al., Reference Laborde, Talmant and Monin1985; Monin et al., Reference Monin, Mejenes-Quijano, Talmant and Sellier1987). Indeed, similarly to the LT muscle, in the SM muscle pHu variation follows a curvilinear regression when GP increases (r=−0.80; P<0.001; Przybylski et al., Reference Przybylski, Vernin and Monin1994).
Variation of lactate content, glucose content and glycolytic potential measured in the longissimus thoracis (LT) muscle of pigs from two lairage groups

GP=glycolytic potential.
1 All results are presented by µmol/g of meat from the LT muscle at 24 h postmortem.
Spearman correlations between glycolytic potential and meat quality characteristics as assessed in the longissimus thoracis (LT), semimembranosus (SM) and adductor (AD) muscles by lairage groupFootnote 1 , Footnote 2

GP=glycolytic potential.
1 G1=group kept in lairage overnight; G2=group kept in lairage between 2 and 3 h.
2 LT muscle (n=124 for G1 and n=148 for G2); SM muscle (n=123 for G1 and n=148 for G2) AD muscle (n=125 for G1 and n=148 for G2).
*P<0.05; ***P<0.001.
Correlations between blood lactate levels and meat quality
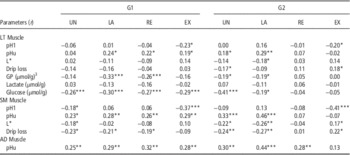
Spearman correlations between blood lactate concentration at different sampling points and meat quality traits by lairage event are showed in Table 6. Similarly to Edwards et al. (Reference Edwards, Engle, Correa, Paradis, Grandin and Anderson2010), in this study the correlations between blood lactate levels and meat quality traits in the LT muscle were generally low for both lairage groups. The greatest correlation was found between blood lactate level recorded at the end of the resting period when exiting the lairage pen (LA) and the pHu value in the SM and AD muscles (r=0.46; P<0.001 and r=0.44; P<0.001, respectively) in the G2 group.
Spearman correlations between blood lactate level at different sampling points on the dressing line and meat quality characteristics as assessed in the longissimus thoracis (LT), semimembranosus (SM) and adductor (AD) muscles by lairage groupFootnote 1 , Footnote 2

UN=unloading; LA=end of lairage; RE=restrainer; EX=exsanguination; GP=glycolytic potential.
1 G1=group kept in lairage overnight; G2=group kept in lairage between 2 and 3 h.
2 LT muscle (n=134 for G1 and n=156 for G2); SM muscle (n=133 for G1 and n=155 for G2) AD muscle (n=135 for G1 and n=156 for G2).
3 GP (n=124 for G1 and n=148 for G2).
*P<0.05; **P<0.01; ***P<0.001.
The second greatest correlation was found between blood lactate levels at EX and pH taken at 1 h post-slaughter in the SM muscle in both G1 and G2 groups (r=−0.37 and r=−0.41, respectively; P<0.001 for both lairage groups), suggesting a decreased pH1 as blood lactate levels increase at exsanguination. The contribution of exsanguination blood lactate levels to early postmortem acidification rate found in this study confirms what was already reported in previous studies (Hambrecht et al., Reference Hambrecht, Eissen, Newman, Smits, Verstegen and Den Hartog2005; Edwards et al., Reference Edwards, Engle, Correa, Paradis, Grandin and Anderson2010). However, the correlations obtained in this study are greater than those reported by Edwards et al. (Reference Edwards, Engle, Correa, Paradis, Grandin and Anderson2010) using the LSA and the LT muscle as meat quality indicator (r=−0.32).
Overall, the greater correlations between blood lactate levels and meat quality traits in the ham muscles are not surprising as they are locomotors muscles and thus more prone to rapid glycogen exhaustion after physical exercise rather than postural muscles, such as the LT muscle. These results, similar to others from previous studies (Hambrecht et al., Reference Hambrecht, Eissen, Newman, Smits, Verstegen and Den Hartog2005; Correa et al., Reference Correa, Torrey, Devillers, Laforest, Gonyou and Faucitano2010), show that the effects of a specific stress on meat quality, either physical or psychological, are muscle dependent.
Conclusions
Overall, our results suggest that the hand-held scout analyzer is capable of measuring blood lactate levels variation associated with the physiological condition of pigs in the perimortem phase. However, although significant, the magnitude of the correlations between blood lactate and meat quality traits found in this study is rather low, meaning a poor reliability in predicting pork quality variation. Possible reasons for these low correlations can be either the small range of variation in the preslaughter stress levels applied in this study or the use of whole blood for lactate analysis resulting in an underestimation of lactate concentrations in blood. Thus, for a more reliable validation of the LSA technique for the monitoring of the preslaughter conditions and control of pork quality variation, further studies in which the LSA is used as stand-alone measurement or in combination with other non-invasive tools (e.g. IR thermography) under more variable preslaughter conditions are needed.
Acknowledgements
The authors appreciate the assistance of S. Horth, R. Formighieri and P. Mattanna for the blood sampling, meat quality measurements and laboratory analysis. Special thanks go to S. Méthot for his expertise with the statistical analysis. The authors are grateful to Olymel Fork® for the financial support and for providing the slaughter facilities and the manpower to conduct this project.