


Introduction
The Association of Southeast Asian Nations (ASEAN) countries are geographically close but exhibit vast differences in their level of economic development. According to 2021 statistics, the per capita income of Singapore, the richest ASEAN country, is more than 50 times that of Myanmar, the poorest.Footnote 1 In parallel, ASEAN countries are characterised by large variances in their institutional environments, driven by their heterogeneous cultural, socio-economic, and political development paths. Efficient institutions are however key in building the knowledge base and supporting investments and innovation for the achievement of competitive advantages in the global economy. In this study, we sought to uncover how various characteristics of human capital, productivity enhancement, and institutional environments are linked in the diverse ASEAN economies to pinpoint through a comparative perspective and from a new angle some particular sets of challenges that those countries are facing in their economic development.
Numerous theoretical and empirical studies have concluded that technology adoption and innovation are essential for long-term economic growth and development (see, e.g. Abramovitz Reference Abramovitz1993; Coe and Helpman Reference Coe and Elhanan1995; Funke and Strulik Reference Funke and Strulik2000; Grossman and Helpman Reference Grossman and Helpman1991; Hasan and Tucci Reference Hasan and Tucci2010; Liu and Xia Reference Liu and Xia2018; Maradana et al. Reference Maradana, Pradhan, Dash, Gaurav, Jayakumar and Chatterjee2017; Bilbao-Osorio and Rodríguez-Pose Reference Bilbao-Osorio and Rodríguez-Pose2004; Pece et al. Reference Pece, Simona and Salisteanu2015; Segerstrom Reference Segerstrom1991; Thompson Reference Thompson2018). There is therefore a growing emphasis on understanding the factors, such as human capital development and institutional setting, that drive technological adoption and undertaking innovations. Human capital is considered one of the prerequisites for implementing new technologies or technological improvements and is indispensable in innovation (Cervellati and Sunde Reference Cervellati and Sunde2005; Che and Zhang Reference Che and Zhang2018; Cosar Reference Cosar2011; Danquah and Amankwah-Amoah Reference Danquah and Amankwah-Amoah2017; Dakhli and De Clercq Reference Dakhli and De Clercq2004; Dunne and Troske Reference Dunne and Troske2005; Funke and Strulik Reference Funke and Strulik2000; Galor and Moav Reference Galor and Moav2004; Gómez and Vargas Reference Gómez and Vargas2012; Keller Reference Keller1996; Nelson and Phelps Reference Nelson and Phelps1966; Bilbao-Osorio and Rodríguez-Pose Reference Bilbao-Osorio and Rodríguez-Pose2004). Human capital development and accumulation, however, are highly dependent on the existing institutional setting (Acemoglu et al. Reference Acemoglu, Johnson and Robinson2001; Ali et al. Reference Ali, Egbetokun and Memon2018; Glaser et al. 2014; North and Thomas Reference North and Thomas1973; Robinson and Acemoglu Reference Robinson and Acemoglu2012). Economic development in low-income countries is often constrained by a lack of technological advancement, which is caused by a shortage of human capital that could be engaged in absorbing and utilising new technologies, driven by the efficiency of institutions (e.g. Acemoglu and Dell Reference Acemoglu and Dell2010). How those interrelated phenomena have manifested in the diverse context of ASEAN economies is not yet well understood.
The ASEAN countries collectively constitute the third largest economy in Asia and the fifth largest economy in the world, after the United States, the European Union, China, and Japan, with a total GDP of approximately $3.6 trillion.Footnote 2 Although the importance of the ASEAN countries in the global economy is increasing, the differences in the levels of development and wealth distribution within the member countries are huge. Six of the ASEAN countries account for 86 per cent of the total ASEAN GDP, and although the four least developed ASEAN countries—Cambodia, Laos, Vietnam, and Myanmar—have had overall higher growth rates since 2008, their combined GDP is 14 per cent of the total GDP of the ASEAN region (International Monetary Fund, World Economic Outlook database, 2022). As the ASEAN region becomes more important in the world economy, the patterns of economic development, human capital development, and institutional setting in these countries warrant further study so that the development paths and challenges in these heterogeneous economies can be better understood.
A key objective of ASEAN is to seek deeper integration among the member countries, significantly reduce the gaps between the ASEAN member states, and achieve substantial increases in their rates of economic growth. New synthesising perspectives on institutional, human capital, and productivity enhancement-related disparities and challenges of the ASEAN economies in meeting those goals are therefore useful.
In the study described in this paper, we examined empirical data from 2007 to 2017 to identify connections between research and development (R&D)-relevant human capital and productivity-enhancing factors in nine ASEAN countries, namely, Cambodia, Indonesia, Laos, Malaysia, Myanmar, the Philippines, Singapore, Thailand, and Vietnam. In addition, we sought to gain an understanding of how productivity-enhancing institutional factors are associated with current levels of R&D-relevant human capital. For this purpose, we used multiple sources of data and applied the canonical correlation method. Canonical correlation, unlike the classical regression method, permits the investigation of dimensions between different sets of productivity-enhancing factors and human capital.
Section Two of this paper provides the conceptual background, and Section Three outlines the data and methodology used. Section Four presents the results of the analysis and a discussion of these results, and the last section concludes the paper.
Literature
The shift of focus from physical capital accumulation to labour and intangible factors as sources of economic growth in twentieth-century economics has paved the way for a deeper understanding of development and income inequalities across countries (Funke and Strulik Reference Funke and Strulik2000; Galor and Moav Reference Galor and Moav2004). Theoretical foundations of this study depart largely from endogenous growth theory (e.g. Aghion et al. Reference Aghion1998; Nelson and Phelps Reference Nelson and Phelps1966; Romer Reference Romer1990), emphasising the crucial role of human capital in contributing to R&D or adoption of new technologies for the achievement of economic growth. Both the accumulated level and development of human capital are key in absorbing technological advancements and augmenting them for subsequent innovative activities, which in turn trigger returns to education (e.g. Galor and Moav Reference Galor and Moav2004; Lucas Reference Lucas1990; Romer Reference Romer1990). Theoretical advances over the past few decades include explaining factors that support human capital development, like the social environment of education (Lucas Reference Lucas2015), and distinguishing the quantity and quality of education (e.g. Griliches Reference Griliches1997). Cosar (Reference Cosar2011), however, argued that because a labour force with heterogeneous skills performs different tasks, labour cannot be aggregated into a single human capital component. His theoretical argumentation showed that skilled labour availability may have even greater effects on development than have been found to date by aggregating the human capital component. On the other hand, concepts of skills mismatch (e.g. McGuinness et al. Reference McGuinness, Pouliakas and Redmond2018) have provided useful insights into imperfections on how the skills of labour are matched to those required in the economy and by available technology, including digital solutions and information. Overall, given the multifaceted role that human capital has been theoretically shown to have in triggering or hindering economic development, in this study we addressed various aspects of human capital development, like quantity and quality of education, returns to education, availability of top knowledge in the economy, and technology–skills mismatch.
Advancements in endogenous growth theory have suggested that productivity enhancement induces capital intensive economic development by absorbing contemporary technologies rather than just by accumulating human capital (Aghion and Howitt Reference Aghion and Howitt1992; Galor and Moav Reference Galor and Moav2004). Departing from the Schumpeterian concepts of creative destruction and evolutionary patterns in economic development (Schumpeter Reference Schumpeter1942), production efficiency is not infinitely diminishing, and industry-heavy economies eventually tend to support development by shifting towards more intangible values and innovation that require greater development of human capital (Aghion and Howitt Reference Aghion and Howitt1992; Galor and Moav Reference Galor and Moav2004; Sokoloff Reference Sokoloff1988). Evolutionary approaches to understanding dynamics in productivity and economic development have provided important theoretical foundations for this study (for a comparative review of the endogenous growth theory with neoclassical economics foundations and evolutionary economics perspectives on development, see Verspagen Reference Verspagen, Fagerberg, Mowery and Nelson2005). On the linkages of human capital development and productivity enhancing factors, Galor and Moav (Reference Galor and Moav2004) and Cervellati and Sunde (Reference Cervellati and Sunde2005) have provided extensive theoretical frameworks on how human capital development, technology, and innovation promote productivity growth. Furthermore, it follows from endogenous growth theory that not only does human capital trigger technological progress but also that higher levels of human capital can attract modern physical capital (Lucas Reference Lucas1990). Long-term growth can be achieved through absorptive capacity if, in addition to new technologies, the knowledge pool grows faster than before (Keller Reference Keller1996). Similar results have been obtained empirically by Dunne and Troske (Reference Dunne and Troske2005) and Gómez and Vargas (Reference Gómez and Vargas2012), who concluded that human capital has a larger effect on technological adoption in more technologically advanced fields of activity. In the light of the intricate theoretical insights into how productivity enhancement matters for economic development in synergy with human capital development, in this study we considered a range of factors that support productivity growth, like existing capital stock, capital inflows from outside the economy, innovation, availability of latest technologies, and real GDP on the output side as a measure of productive capacity.
However, human and physical capital accumulation alone does not account for cross-country differences in economic development and income inequalities. Institutions in standard economic theory have been often left implicit, which has raised the debate over the causal chain of institutional and human capital development (Acemoglu et al. Reference Acemoglu, Gallego and Robinson2014). There are broadly two distinct views among economists about the role of institutions in combination with human capital in fostering development. The first view follows the seminal work of Lipset (Reference Lipset1959), who suggested that changes in human capital formation lead to the strengthening of institutions to support economic development. This view is supported by Glaser et al. (2014), who argued that human capital is more important than institutions at first because the accumulation of human capital eventually leads to stronger institutions and poverty can be overcome by laws and policies that support the development of human capital. Similar conclusions have been derived empirically by Guisan (Reference Guisan2009), for example, based on a cross-country study of European countries.
The second theoretical framework, initially proposed by North and Thomas (Reference North and Thomas1973), has suggested that institutions pave the way for fostering human capital accumulation that, along with physical capital and total factor productivity growth, lead to economic development. Acemoglu et al. (Reference Acemoglu, Johnson and Robinson2001), for example, showed in their study that physical and human capital growth increase the output only in countries with sufficient institutional settings. Dias and Tebaldi (Reference Dias and Tebaldi2012) argued that the development-inducing mechanism between productivity and human capital is self-perpetuating but requires institutions that foster human capital at first. Based on a cross-sectional empirical study, Ali et al. (Reference Ali, Egbetokun and Memon2018) concluded that strong institutions make it possible to derive higher utility from human capital and thus promote growth. Overall, given the contrasting theoretical argumentations on the role of institutions in supporting development along with human capital development and the mixed empirical evidence, we incorporate in this study a set of diverse institutional measures—political stability, economic freedom, freedom to express views and preferences, and protection of property rights—to explore their nexus with human capital in fostering development.
Having established the theoretical background, we will now discuss our empirical modelling approach and available data with variables to be used as proxies in capturing the above phenomena in the ASEAN context. We have highlighted some earlier empirical studies where similar approaches were used.
Data and Methodology
In this study, we utilised multiple databases retrieved from the World Bank, Penn World Tables version 10, and the historical World Economic Forum Global Competitiveness Index for nine ASEAN countries for the years 2007 to 2017. The nine countries in the sample were Cambodia (KHM), Vietnam (VNM), Laos (LAO), Myanmar (MMR), Thailand (THA), Malaysia (MYS), Singapore (SGP), Indonesia (IDN), and the Philippines (PHL). The list of variables used in the analysis is given in Table A1 in the appendices.
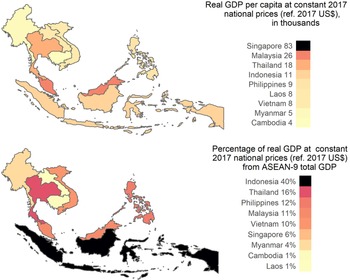
Among the ASEAN member countries, Cambodia, Laos, Myanmar, and Vietnam are in the group of lower-income transition economies. There is a vast gulf between the lower-income and other ASEAN economies in their stages of development, as illustrated in Figure 1. While most of the ASEAN countries maintained a high rate of growth in GDP in constant national prices between 4.7 per cent and 5.6 per cent in the 2007–2017 period, the less developed transition economies were able to accelerate their GDP in constant national prices growth to an average rate of between 6.6 per cent and 7.7 per cent during the same period. More than 50 per cent of the ASEAN workforce is engaged in the services sector. Over 35 per cent work in manufacturing, and over ten per cent work in agriculture. The sectoral distribution of labour varies across the ASEAN countries but with more agriculture-heavy labour markets in Myanmar, Cambodia, Laos, Vietnam, and Indonesia and a more services-based workforce in Singapore, the Philippines, Thailand, and Malaysia.Footnote 3
GDP per capita in constant national prices among ASEAN-9 countries and their contributions to total ASEAN-9 aggregated GDP in constant national prices (2017).
Source: Authors’ illustration based on Penn World Tables version 10 (2019 data).

The economic backgrounds and historical development of the ASEAN countries are very heterogeneous. This led us to study the nexus of R&D-relevant human capital, productivity-enhancing economic factors, and productivity-relevant institutional factors in those countries. In particular, we sought to investigate how R&D-promoting human capital is associated with productivity-enhancing economic and institutional factors and where each of the nine countries is positioned with respect to these factors.
The selection of variables used in this study relied on the framework of previous theoretical studies discussed previously in Section 2. We characterised the countries’ knowledge bases using tertiary education enrolment (to capture population attainment in higher or vocational education), education quality, Human Capital Index, availability of scientists and engineers (to capture the share of the top knowledge in the country), and proportion of the population using the internet (as a proxy for the accessibility of information and data) (with reference to Ali et al. Reference Ali, Egbetokun and Memon2018; Barro Reference Barro2001; Cervellati and Sunde Reference Cervellati and Sunde2005; Galor and Moav Reference Galor and Moav2004; Lee et al. Reference Lee, Florida and Gates2010; Maneejuk and Yamaka Reference Maneejuk and Yamaka2021).
The advancement in productivity-enhancing economic factors stems from the initial knowledge base for utilising new technologies, attracting physical capital foreign direct investments (FDI), and innovation itself (e.g. Dakhli and De Clercq Reference Dakhli and De Clercq2004; Danquah and Amankwah-Amoah Reference Danquah and Amankwah-Amoah2017). The set of productivity-enhancing factors included capital stock, foreign direct investment inflows, the output side of real GDP, an innovation index, and the availability of the latest technologies. These variables capture each country's level of wealth through economic activity, capital inflows from foreign direct investments, and the overall level of real capital stock required from the physical capital accumulation side to carry out innovation (with reference to Alguacil et al. Reference Alguacil, Cuadros and Orts2008; Dunning 1994; Fu et al. Reference Fu, Carlo and Luc2011; Iamsiraroj and Ulubaşoğlu Reference Iamsiraroj and Ulubaşoğlu2015). The level of availability of the latest technologies serves as a proxy for the existing base of technologies required for innovation (Rivera-Batiz and Romer Reference Rivera-Batiz and Romer1991; Romer Reference Romer1990).
To characterise the productivity-enhancing institutional setting, we used data on economic freedom, political stability, voice accountability, and intellectual property protections. Economic freedom encompasses four pillars of the economic environment: government size, regulatory efficiency, openness, and the rule of law necessary to protect individuals’ rights to do business freely and benefit from open markets for the flow of knowledge (see Romer Reference Romer1990). Intellectual property protection, political stability, and voice accountability reflect the legal rights of inventors to protect their inventions from imitation (Guisan Reference Guisan2009; Hall et al. Reference Hall, Mairesse, Mohnen, Hall and Rosenberg2010; Lin et al. Reference Lin, Lin and Song2010; Xu et al. Reference Xu, Chen, Xu and Chan2016; Yang and Maskus Reference Yang and Keith E.2001).
Descriptive statistics are given in Table A2, and the correlation matrix is provided in Figure A1 in the appendices. Figure 2 below illustrates that the economies with higher levels of innovativeness and technology adoption have accumulated more human capital and are freer in international trade. The lower-income transition economies (i.e. Myanmar, Laos, Vietnam, and Cambodia) have long been closed economies with relatively little economic integration outside Asia, and they exhibit significantly lower levels of innovativeness. Myanmar, as a very dramatic example, was in economic isolation until 2010 because of its military regime and political issues. Innovativeness in the ASEAN countries ranges from the world-leading Singapore to the technologically underdeveloped Myanmar and Cambodia.
Adoption of technology, innovation, freedom of international trade, and human capital in ASEAN countries.
Source: Authors’ calculation based on Penn World Table (PWT) 10, World Bank, and World Economic Forum Global Competitiveness Index report for 2015.

We used canonical correlation analysis as our main method of analysis to assess the associations between the factors of interest. Canonical correlation is a family of multivariate statistics methods that makes it possible to assess linear relationships between dependent and independent sets of variables Y and X, respectively. Canonical correlation is useful in understanding the relationship between paired sets of variables when the sample size is insufficient in terms of the desired dimensionality. This allows for a better assessment of the relationship between the sets in higher dimensions than is possible with regression analysis methods. The pairs of canonical covariates are defined as:
 $$A_i = a_1V_1 + \ldots + A_iV_i\;{\rm and}\;B_i = b_1V_1 + \ldots + b_1V_i, \;$$
where i is the number of predictors in a multivariate set. The canonical correlation between the canonical pairs is then defined as:
 $$\rho = ( {cov( {A_iB_i} ) } ) /\surd ( {var( {A_i} ) var( {B_i} ) } ) . $$
To evaluate the fit of canonical correlation results, we estimated Wilks’ lambda using an F-approximation for which the null hypothesis was that the canonical pairs were not correlated (Androniceanu et al. Reference Androniceanu, Kinnunen, Georgescu and Androniceanu2020; Hardoon et al. Reference Hardoon, Szedmak and Shawe-Taylor2004; Uurtio et al. Reference Uurtio, Monteiro, Kandola, Shawe-Taylor, Fernandez-Reyes and Rousu2017).
The choice of method for the analysis has to suit the aim of the paper and the availability and structure of the data. Institutional change is mostly evolutionary and slow in time, and most of the variation in data stems from cross-country differences in their institutional settings and realities. Low time variation in institutional variables is a challenge for time-series estimators that require high time variability, such as vector autoregressive models or long time series such as cointegration methods. Also, many institutional variables are not measurable on a continuous scale and are not linear, which is another reason why the linear time series or cross-sectional estimators may not be an optimal choice. Canonical correlation is a helpful tool for pursuing multivariate statistical analysis; the method joins multiple variables into more general synthetic dimensions carrying a latent common meaning, finds the pairs of these synthetic dimensions that have the strongest correlation between them, and ranks these pairs according to their strength in the underlying correlation. Using canonical correlation analysis on a sample of 27 European countries for the period 2016–2018, Androniceanu et al. (Reference Androniceanu, Kinnunen, Georgescu and Androniceanu2020) investigated the multivariate relationships between competitiveness and innovation. Our analysis explores nine ASEAN countries over an observation period of ten years at most, whereas for certain sample countries, the series are substantially shorter. Since canonical correlation relies more on data dimensionality than on data dynamics, it enables us to discover general patterns governing the institution–development nexus across the ASEAN region without being compromised by the data limitations.
Results and Discussion
The canonical correlation results for the productivity-enhancing factors and R&D-relevant human capital are summarised in Table 1 and Figure 3 below. The overall correlation between the sets of variables in the canonical correlation was 0.986, with a p-value of 0.000. The overall correlation between the sets of variables decreased considerably in the subsequent dimensions of the canonical correlation, but the correlation remained statistically significant up to the fourth dimension. The coefficients of the canonical correlation combined with the yearly weighted average of the first-dimension canonical correlation coefficients illustrated in Figure 3 indicate that although ASEAN countries with higher GDPs in constant national prices (see Figure 1 for reference) have a higher correlation between the levels of productivity-enhancing factors and R&D-relevant human capital, the overall dependency on human capital in the sample ASEAN countries is relatively low. This can be explained by the fact that a considerable number of ASEAN countries are agricultural and basic industry intensive, with little value added in production (Booth Reference Booth2016; Kea et al. Reference Kea, Li and Pich2016). In these countries, the share of innovative firms is relatively low, and the innovative activities target mostly process improvements in order to achieve efficiency gains rather than focus on R&D-driven innovation output (see Cirera et al. (Reference Cirera, Mason, De Nicola, Kuriakose and Tran2021) for an extensive overview). The negative coefficient for FDI inflows indicates that FDI is not determined by the human capital-driven competitiveness of these economies but rather by the supply of cheap labour that is attractive for foreign investors looking to benefit from the possibility of cheap production.
Canonical correlation coefficients for the quality of human capital relevant for R&D and factors enhancing productivity

Notes: Canonical correlations coefficients are derived based on data for the years 2007–2017, except for Myanmar, for which data were only available for the years 2014–2016, and Lao PDR, for which data were only available for the years 2013–2017.
Source: Authors’ calculations based on data from the World Bank, Penn World Table 10, and the World Economic Forum Global Competitiveness Index.
First-dimension canonical correlation coefficients of human capital relevant for R&D and factors in productivity growth in nine ASEAN countries.
Notes: First-dimension canonical correlation yearly weighted average coefficients were derived based on data for the years 2007–2017, except for Myanmar, for which data were only available for the years 2014–2016 and Lao PDR, for which data were only available for the years 2013–2017.
Source: Authors’ calculations based on data from the World Bank, Penn World Table 10, and the World Economic Forum Global Competitiveness Index.

One potential explanation for the differences in these linkages between the four ASEAN transition economies, as illustrated in Figure 3, could be that as foreign investors are looking for alternatives to China, Vietnam has proven itself an attractive destination for FDI. Foreign investors’ attraction to Vietnam, which is the closest of the four transition economies to China both geographically and culturally, lies particularly in the still-unused potential of the domestic market, the abundant working-age population, and the low cost of labour, even though the level of productivity is higher than in Laos, Cambodia, and Myanmar, the other three ASEAN transition countries. In addition, Vietnam has introduced several policies to support investment and provide a better institutional framework for enhanced FDI inflows. Although Cambodia, Laos, and Myanmar are playing growing roles as target countries for foreign investors, FDI inflows to them remain modest when compared to those going to the other ASEAN countries that have higher levels of technological readiness, such as Malaysia, Thailand, and Singapore.
On the other hand, the six more highly developed ASEAN countries show a greater dependency on the human capital relevant for R&D in the factors that enhance productivity. This may be partly because manufacturing sectors with higher value added account for a larger share of these economies, and the service sector accounts for a growing share. In addition, efforts by these countries to keep pace with global demands for the availability of skilled labour encourages them to support advances in the adoption of technology and in innovation. In Singapore, which has the highest indicators for human capital relevant for R&D among the ASEAN group, a large proportion of the economic activities that occur are directly or indirectly related to advanced technology and innovation.
Next, we examine the results of our analysis of factors affecting human capital development. In the sample countries, as illustrated in Figure 4, the accumulation of human capital is correlated most strongly with the quality of education and access to tertiary education. A high degree of correlation between the urban population and internet access demonstrates the larger shares of knowledge capital in more developed and urbanised economies with better information and communications technologies, which enable better information sharing. For example, Singapore, which stands out among the sample countries in this respect, has substantially upgraded its educational system over a long time, putting considerable effort into the quality of education. As the main language of instruction is English, and children are already speaking English before they start primary school, the labour force is better prepared to access and contribute to international knowledge and communication. The quality of higher education in Singapore is widely recognised around the world, and higher education has been the most commonly achieved educational attainment level over the past five decades for the people of Singapore. The preference for higher education has, however, left Singapore with a shortage of labour with vocational training, which has been revived recently. Other countries in the region have undertaken reforms of their education systems to respond to their development priorities and the requirements for specific skills in the economy. Although schooling attainment has considerably risen over time in the catching-up ASEAN countries, meaning a rise in quantities school enrolments, but not necessarily in quality which builds over time (Hanushek Reference Hanushek2013).
Principal component analysis of human capital development.
Notes: First- and second-dimension principal components were derived based on 2016 data. Abbreviations stand for the following variables: Empl. – employment-to-population ratio, 15+ total (%); HCI – Human Capital Index; Tert. – tertiary education enrolment; Int. – individuals using internet; Upop. – urban population (%), Qual. – education quality.
Source: Authors’ calculations based on data from the World Bank and the World Economic Forum Global Competitiveness Index.

The associations between the R&D-relevant human capital and productivity-enhancing institutional factors are summarised in Table 2 and Figure 5 below. The results show that the institutional quality in the sample countries is linked to human capital development. Compared to the results for the R&D-relevant human capital factors and productivity-enhancing factors, the canonical correlation coefficients are higher, and the overall correlation score in the first dimension is 0.978, with a p-value of 0.000. Again, the correlation falls in the subsequent dimensions but remains statistically significant throughout all the canonical correlation dimensions.
Canonical correlation coefficients for the quality of human capital relevant for R&D and productivity-enhancing institutional factors

Notes: Canonical correlation coefficients were derived from data for the years 2007–2017, except for Myanmar, for which data were only available for the years 2014–2016, and Lao PDR, for which data were only available for the years 2013–2017.
Source: Authors’ calculations based on data from the World Bank, Penn World Table 10, World Bank Governance Index, and the World Economic Forum Global Competitiveness Index.
First-dimension canonical correlation coefficients of the quality of human capital relevant for R&D and institutional factors by country.
Notes: First-dimension canonical correlation yearly weighted average coefficients were derived from data for the years 2007–2017, except for Myanmar, for which data were only available for the years 2014–2016, and Lao PDR, for which data were only available for the years 2013–2017.
Source: Authors’ calculations based on data from the World Bank, Penn World Table 10, World Bank Governance Index, and the World Economic Forum Global Competitiveness Index.

Institutional efficiency appears to come together with the level of human capital development. From the human capital development perspective, the overall development path in ASEAN appears to be one of producing workers with top-level skills, such as scientists and engineers, and making improvements in overall educational quality. The overall accessibility of education remains low in some ASEAN countries, however, leading to wide gaps in human capital development between them.
The greatest concern regarding human capital development is in the transition economies—Cambodia, Laos, Myanmar, and Vietnam—where the share of the population that is rural is higher than it is in the more advanced ASEAN countries and the educational opportunities for the urban and rural populations are unequal. Another issue with the accumulation of human capital in all four of the transition economies in the ASEAN group is their high level of dependency on economic activities with low value added that do not necessarily require high levels of education but rather depend on simple skills that can be acquired on the job. As argued by Galor and Moav (Reference Galor and Moav2004) and Cervellati and Sunde (Reference Cervellati and Sunde2005), acquiring education is costly and relies on often short-term rational considerations about the benefits gained from the higher level of knowledge and the skills accumulated in view of the income lost during the same period. The limited opportunities and perspectives for exploiting the benefits of more advanced education in the less developed ASEAN economies tend to adjust the values of educational needs among the population. Furthermore, even in the developed economies of the ASEAN group, technological disruptions, such as developments in robotics and machine learning, have replaced specific tasks in existing jobs, and this has led to changes in demand for skills in several occupations. The new trends require not only the developing economies of ASEAN but also its more developed ones to carry out educational reforms to meet current labour needs and anticipate future economic demands.
Conclusion
This paper has described a study of the links between the quality of human capital, productivity-enhancing factors, and institutional backgrounds in nine ASEAN countries based on data for the period 2007–2017. The sample countries are notable for the heterogeneity of their institutional backgrounds and of their adoption of technology and innovation. Countries with high GDP per capita in constant national prices, such as Singapore and Malaysia, exhibit a high association between R&D-relevant human capital development, productivity-enhancing factors, and institutional strength. These findings are consistent with previous studies that have argued that human capital is indispensable for attracting FDI, adopting new technologies, innovating, and achieving economic growth (e.g. Cervellati and Sunde Reference Cervellati and Sunde2005; Che and Zhang Reference Che and Zhang2018; Dakhli and De Clercq Reference Dakhli and De Clercq2004; Danquah and Amankwah-Amoah Reference Danquah and Amankwah-Amoah2017; Dunne and Troske 2015; Galor and Moav Reference Galor and Moav2004; Gómez and Vargas Reference Gómez and Vargas2012; Keller Reference Keller1996; Lucas Reference Lucas1990). In addition, human capital is indispensable for institutional development, as stressed by Glaser et al. (2014) and Ali et al. (Reference Ali, Egbetokun and Memon2018).
The four transition countries in the ASEAN group—Laos, Cambodia, Vietnam, and Myanmar—are the fastest growing in the region, but they are still heavily dependent on the accumulation of physical capital in the low value-added agricultural and production sectors, where there is quite a low level of technology adoption and even less innovation. Cambodia, Laos, and Myanmar have remained closed economies, with institutional backgrounds that are largely focused on state control and a low level of human capital development. The other ASEAN countries have advanced faster technologically, which is reflected in their higher levels of income and their productivity-enhancing factors.
Although technology adoption and innovation have been understood in the ASEAN countries to play important roles in achieving long-term sustainable growth and overcoming poverty gaps, the levels of human capital needed to achieve these goals are yet to be developed in the transition economies of the ASEAN group or even in the more developed countries in the group. These developments appear to be asymmetric in time and associated with the countries’ institutional backgrounds. Thus, the main policy implication stemming from the results of this research points towards the need for human capital accumulation, especially concerning the educational quality and availability of a workforce with top-level skills. Knowledge accumulation is crucial for adopting new technologies that create a sufficient technological base for innovation, institutional development, and subsequent economic growth.
A key issue for human capital in the ASEAN countries is that the institutional setting appears to be rather elite oriented, as opportunities for human capital development are unequally distributed between countries. The more developed ASEAN countries are more focused on developing top-level skills, having managed to achieve relatively high levels of human capital development, but the transition economies of the ASEAN group are lagging behind. Human capital endowments remain low for these countries, and access to training may be biased towards urban areas, leaving a large part of the population with few opportunities for education and training.
Acknowledgements
This project received support from the following programmes: Erasmus Programme of the European Union (611059-EPP-1-2019-1-EE-EPPJMO-MODULE), the European Union's Horizon 2020 Research and Innovation programme grant (952574), the Marie Sklodowska-Curie grant (734712), the European Economic Area (EEA) Financial Mechanism 2014–2021 Baltic Research Programme (S-BMT-21-8 [LT08-2-LMT-K-01-073]) and the Doctoral School in Economics and Innovation, supported by the European Union, European Regional Development Fund (Tallinn University of Technology ASTRA project “TTÜ Development Program 2016-2022” [2014-2020.4.01.16-0032]). The authors are grateful to Chintana Khouangvichit, Souliphone Luanglath, Thanouxay Volavong, Thaviphone Inthakesone, Rotha Ung, Hoan Duong, Sokun Prum, Huy Chheang, Sonesana Mixayboua, and the Project IKID leaders for their input.
APPENDICES
List of variables

Descriptive statistics

Correlation matrix.
Notes: Variables have been relabelled to save space. Variable order corresponds to the order shown in Table A1 and Table A2.
Source: Authors’ calculations based on the World Bank TC360 data, World Bank Governance Indicators, Penn World Table 10.0, and World Economic Forum Global Competitiveness Index data for ASEAN-9 countries for the years 2007–2017.