



%20--%3e%3c!DOCTYPE%20svg%20PUBLIC%20'-//W3C//DTD%20SVG%201.0//EN'%20'http://www.w3.org/TR/2001/REC-SVG-20010904/DTD/svg10.dtd'%3e%3csvg%20version='1.0'%20id='Layer_1'%20xmlns='http://www.w3.org/2000/svg'%20xmlns:xlink='http://www.w3.org/1999/xlink'%20x='0px'%20y='0px'%20width='64px'%20height='64px'%20viewBox='5.5%20-3.5%2064%2064'%20enable-background='new%205.5%20-3.5%2064%2064'%20xml:space='preserve'%3e%3cg%3e%3ccircle%20fill='%23FFFFFF'%20fill-opacity='0'%20cx='37.785'%20cy='28.501'%20r='28.836'/%3e%3cpath%20fill='%23595959'%20d='M37.441-3.5c8.951,0,16.572,3.125,22.857,9.372c3.008,3.009,5.295,6.448,6.857,10.314%20c1.561,3.867,2.344,7.971,2.344,12.314c0,4.381-0.773,8.486-2.314,12.313c-1.543,3.828-3.82,7.21-6.828,10.143%20c-3.123,3.085-6.666,5.448-10.629,7.086c-3.961,1.638-8.057,2.457-12.285,2.457s-8.276-0.808-12.143-2.429%20c-3.866-1.618-7.333-3.961-10.4-7.027c-3.067-3.066-5.4-6.524-7-10.372S5.5,32.767,5.5,28.5c0-4.229,0.809-8.295,2.428-12.2%20c1.619-3.905,3.972-7.4,7.057-10.486C21.08-0.394,28.565-3.5,37.441-3.5z%20M37.557,2.272c-7.314,0-13.467,2.553-18.458,7.657%20c-2.515,2.553-4.448,5.419-5.8,8.6c-1.354,3.181-2.029,6.505-2.029,9.972c0,3.429,0.675,6.734,2.029,9.913%20c1.353,3.183,3.285,6.021,5.8,8.516c2.514,2.496,5.351,4.399,8.515,5.715c3.161,1.314,6.476,1.971,9.943,1.971%20c3.428,0,6.75-0.665,9.973-1.999c3.219-1.335,6.121-3.257,8.713-5.771c4.99-4.876,7.484-10.99,7.484-18.344%20c0-3.543-0.648-6.895-1.943-10.057c-1.293-3.162-3.18-5.98-5.654-8.458C50.984,4.844,44.795,2.272,37.557,2.272z%20M37.156,23.187%20l-4.287,2.229c-0.458-0.951-1.019-1.619-1.685-2c-0.667-0.38-1.286-0.571-1.858-0.571c-2.856,0-4.286,1.885-4.286,5.657%20c0,1.714,0.362,3.084,1.085,4.113c0.724,1.029,1.791,1.544,3.201,1.544c1.867,0,3.181-0.915,3.944-2.743l3.942,2%20c-0.838,1.563-2,2.791-3.486,3.686c-1.484,0.896-3.123,1.343-4.914,1.343c-2.857,0-5.163-0.875-6.915-2.629%20c-1.752-1.752-2.628-4.19-2.628-7.313c0-3.048,0.886-5.466,2.657-7.257c1.771-1.79,4.009-2.686,6.715-2.686%20C32.604,18.558,35.441,20.101,37.156,23.187z%20M55.613,23.187l-4.229,2.229c-0.457-0.951-1.02-1.619-1.686-2%20c-0.668-0.38-1.307-0.571-1.914-0.571c-2.857,0-4.287,1.885-4.287,5.657c0,1.714,0.363,3.084,1.086,4.113%20c0.723,1.029,1.789,1.544,3.201,1.544c1.865,0,3.18-0.915,3.941-2.743l4,2c-0.875,1.563-2.057,2.791-3.541,3.686%20c-1.486,0.896-3.105,1.343-4.857,1.343c-2.896,0-5.209-0.875-6.941-2.629c-1.736-1.752-2.602-4.19-2.602-7.313%20c0-3.048,0.885-5.466,2.658-7.257c1.77-1.79,4.008-2.686,6.713-2.686C51.117,18.558,53.938,20.101,55.613,23.187z'/%3e%3c/g%3e%3c/svg%3e)
%20--%3e%3c!DOCTYPE%20svg%20PUBLIC%20'-//W3C//DTD%20SVG%201.0//EN'%20'http://www.w3.org/TR/2001/REC-SVG-20010904/DTD/svg10.dtd'%3e%3csvg%20version='1.0'%20id='Layer_1'%20xmlns='http://www.w3.org/2000/svg'%20xmlns:xlink='http://www.w3.org/1999/xlink'%20x='0px'%20y='0px'%20width='64px'%20height='64px'%20viewBox='5.5%20-3.5%2064%2064'%20enable-background='new%205.5%20-3.5%2064%2064'%20xml:space='preserve'%3e%3cg%3e%3ccircle%20fill='%23FFFFFF'%20fill-opacity='0'%20cx='37.637'%20cy='28.806'%20r='28.276'/%3e%3cg%3e%3cpath%20fill='%23595959'%20d='M37.443-3.5c8.988,0,16.57,3.085,22.742,9.257C66.393,11.967,69.5,19.548,69.5,28.5c0,8.991-3.049,16.476-9.145,22.456%20C53.879,57.319,46.242,60.5,37.443,60.5c-8.649,0-16.153-3.144-22.514-9.43C8.644,44.784,5.5,37.262,5.5,28.5%20c0-8.761,3.144-16.342,9.429-22.742C21.101-0.415,28.604-3.5,37.443-3.5z%20M37.557,2.272c-7.276,0-13.428,2.553-18.457,7.657%20c-5.22,5.334-7.829,11.525-7.829,18.572c0,7.086,2.59,13.22,7.77,18.398c5.181,5.182,11.352,7.771,18.514,7.771%20c7.123,0,13.334-2.607,18.629-7.828c5.029-4.838,7.543-10.952,7.543-18.343c0-7.276-2.553-13.465-7.656-18.571%20C50.967,4.824,44.795,2.272,37.557,2.272z%20M46.129,20.557v13.085h-3.656v15.542h-9.944V33.643h-3.656V20.557%20c0-0.572,0.2-1.057,0.599-1.457c0.401-0.399,0.887-0.6,1.457-0.6h13.144c0.533,0,1.01,0.2,1.428,0.6%20C45.918,19.5,46.129,19.986,46.129,20.557z%20M33.042,12.329c0-3.008,1.485-4.514,4.458-4.514s4.457,1.504,4.457,4.514%20c0,2.971-1.486,4.457-4.457,4.457S33.042,15.3,33.042,12.329z'/%3e%3c/g%3e%3c/g%3e%3c/svg%3e)
1. Introduction
Particle-laden turbulent flows are encountered in many geophysical and industrial processes. One of the major focuses in this area is understanding the dynamics of fluid and solid phases. With the advent of high-speed computational systems, although performing direct numerical simulations for small system sizes has become possible, modelling still plays a vital role in studying large-scale systems of practical importance. Most of the modelling techniques are based on the approximation of local isotropy in the inertial and dissipation range. Kolmogorov's similarity hypothesis for the inertial subrange states that for every turbulent flow at a sufficiently high Reynolds number, the statistics of the motions of scale ( $r$) in the range,
 $\eta \ll r \ll L$, have a universal form that is uniquely determined by
 $\epsilon$ and independent of
 $\nu$ (Kolmogorov Reference Kolmogorov1941). Here,
 $L$ is the integral length scale,
 $\eta$ is the Kolmogorov length scale,
 $\nu$ is the kinematic viscosity and
 $\epsilon$ is the mean viscous dissipation rate of turbulent kinetic energy. The spectral energy in the inertial subrange is expressed as
 $E(k)= C \epsilon ^{2/3}k^{-5/3}$, where
 $k$ is the wavenumber and
 $C$ is the proportionality prefactor known as the Kolmogorov constant. The Kolmogorov constant is obtained following the Kolmogorov hypothesis for different types of flows like boundary layers (Saddoughi & Veeravalli Reference Saddoughi and Veeravalli1994; Sreenivasan Reference Sreenivasan1995), channel flows (Antonia, Zhou & Romano Reference Antonia, Zhou and Romano1997; Choi, Yeo & Lee Reference Choi, Yeo and Lee2004), homogeneous isotropic turbulence (Yeung & Zhou Reference Yeung and Zhou1997; Donzis & Sreenivasan Reference Donzis and Sreenivasan2010; Sawford & Yeung Reference Sawford and Yeung2011), etc. The Kolmogorov constant for different experiments and simulations have been summarized by Sreenivasan (Reference Sreenivasan1995), Yeung & Zhou (Reference Yeung and Zhou1997) and Lien & D'Asaro (Reference Lien and D'Asaro2002). The stochastic turbulence models (Pope Reference Pope1985, Reference Pope2011; Thomson Reference Thomson1987; Wilson & Sawford Reference Wilson and Sawford1996; Heinz Reference Heinz2002; Reynolds Reference Reynolds2003; Shotorban & Mashayek Reference Shotorban and Mashayek2006; Marchioli Reference Marchioli2017) and other turbulence models like the Smagorinsky model (Smagorinsky Reference Smagorinsky1963; Pope Reference Pope2000; Sagaut Reference Sagaut2006), as well as other eddy viscosity based models (Sagaut Reference Sagaut2006) use Kolmogorov constant. Another implication of the Kolmogorov constant (
 $C_0$) is that the turbulent diffusivity is expressed as
 $D_t = 2\sigma _u^4/C_0 \epsilon$, where
 $T_L = 2 \sigma _u^2/C_0 \epsilon$ is the integral time scale and
 $\sigma _u^2$ is the variance of velocity fluctuation (Tennekes Reference Tennekes1979; Sawford & Yeung Reference Sawford and Yeung2011).
Consolidating a large number of experimental data, Sreenivasan (Reference Sreenivasan1995) has reported the universality of Kolmogorov constant which is independent of the flow geometry and Reynolds number. At a sufficiently high Reynolds number where local isotropy is satisfied at dissipation scales and in the inertial range, the Kolmogorov constant attains a universal value (Yeung & Zhou Reference Yeung and Zhou1997). However, at low and moderate Reynolds numbers, the Kolmogorov constant may differ from the universality (Sreenivasan Reference Sreenivasan1995; Yeung & Zhou Reference Yeung and Zhou1997). In their experiments for channel flow, Antonia et al. (Reference Antonia, Zhou and Romano1997) found a lower value of the Kolmogorov constant. Through the analysis of second- and third-order velocity structure functions, they have stated that the small-scale isotropy is a necessary condition for the existence of a universal inertial range. Yeung & Zhou (Reference Yeung and Zhou1997) mentioned that for the presence of inertial range, isotropy should also be present along with  $-5/3$ scaling. The Kolmogorov constant may attain a different value if isotropy is not satisfied in the inertial range. Heinz (Reference Heinz2002) discussed the variations of the Kolmogorov constant for equilibrium turbulent boundary layer and homogeneous isotropic stationary turbulence. He stated that for stochastic modelling, the value is near two, and anisotropic velocity and acceleration fluctuations dominate the energy budget. Furthermore, the value is near six if those contributions disappear. All the above studies address the deviation of the Kolmogorov constant from a universal value due to the occurrence of anisotropy at low and moderate Reynolds numbers for unladen fluid flows. A large number of studies (discussed below) have used different modelling approaches, viz. the LES approach considers the universality of Kolmogorov constant to address particle-laden flows. It is expected that if there is a modulation/attenuation of turbulence due to the effect of particles, the extent of anisotropy may change for wall bounded turbulent flows. Therefore, first, we have discussed the effect of particles on turbulence modulation and then we have focused on the consequent change in local isotropy.
In the case of the particle-laden flows, the addition of particles modifies the turbulence intensity in turbulent flows. Here, we briefly discuss the capability of point-particle approximation-based numerical simulation to predict second moments of fluid phase fluctuations and drag reduction in particle-laden flows. The various parameters, such as the ratio of particle diameter to integral length scale, Stokes number, particle Reynolds number, etc. affect the turbulence of the carrier phase (Kulick, Fessler & Eaton Reference Kulick, Fessler and Eaton1994; Kajishima et al. Reference Kajishima, Takiguchi, Hamasaki and Miyake2001; Li et al. Reference Li, McLaughlin, Kontomaris and Portela2001; Yamamoto et al. Reference Yamamoto, Potthoff, Tanaka, Kajishima and Tsuji2001; Vreman et al. Reference Vreman, Geurts, Deen, Kuipers and Kuerten2009; Vreman Reference Vreman2015; Yu et al. Reference Yu, Lin, Shao and Wang2017, Reference Yu, Xia, Guo and Lin2021; Muramulla et al. Reference Muramulla, Tyagi, Goswami and Kumaran2020). The various authors have attempted to quantify the regimes of turbulence attenuation and augmentation (Gore & Crowe Reference Gore and Crowe1989; Hetsroni Reference Hetsroni1989; Crowe Reference Crowe2000; Hosokawa & Tomiyama Reference Hosokawa and Tomiyama2003; Righetti & Romano Reference Righetti and Romano2004; Tanaka & Eaton Reference Tanaka and Eaton2008; Noguchi & Nezu Reference Noguchi and Nezu2009; Luo, Luo & Fan Reference Luo, Luo and Fan2016). Various authors have observed the increase in turbulence attenuation in different flow configurations (Kulick, Fessler & Eaton Reference Kulick, Fessler and Eaton1994; Vreman et al. Reference Vreman, Geurts, Deen, Kuipers and Kuerten2009; Bari, Yunus & Hadi Reference Bari, Yunus and Hadi2010; Zhao, Andersson & Gillissen Reference Zhao, Andersson and Gillissen2010; Vreman Reference Vreman2015; Zade et al. Reference Zade, Costa, Fornari, Lundell and Brandt2018; Kumaran et al. Reference Kumaran, Muramulla, Tyagi and Goswami2020; Muramulla et al. Reference Muramulla, Tyagi, Goswami and Kumaran2020; Rohilla, Muramulla & Goswami Reference Rohilla, Muramulla and Goswami2022), and this has also been reviewed by Balachandar & Eaton (Reference Balachandar and Eaton2010), Kuerten (Reference Kuerten2016), Elghobashi (Reference Elghobashi2019) and Brandt & Coletti (Reference Brandt and Coletti2022). It is in debate whether spherical particles can cause drag reduction or not, which has been observed for point-particle simulations (Yu et al. Reference Yu, Lin, Shao and Wang2017). A drag reduction by point-particle simulations has been reported in many numerical studies (Vreman Reference Vreman2007; Dritselis & Vlachos Reference Dritselis and Vlachos2008; Zhao et al. Reference Zhao, Andersson and Gillissen2010; Muramulla et al. Reference Muramulla, Tyagi, Goswami and Kumaran2020; Laín et al. Reference Laín, Ortíz, Ramirez and Duque2023), and in experiments by Bari et al. (Reference Bari, Yunus and Hadi2010) and Kartushinsky et al. (Reference Kartushinsky, Mulgi, Tisler and Michaelides2005). Dave & Kasbaoui (Reference Dave and Kasbaoui2023) performed simulations for particle-laden turbulent channel flows with a point-particle approach. It is observed that the drag increases and decreases for the particles having  $St^+ = 6$ and 30, respectively. Here,
 $St^+$ is the particle Stokes number based on viscous scales. In the case of drag reduction, the particles are aligned along the streamwise direction in long clusters. This causes the stabilization of streamwise structures and suppression of bursting events. However, drag reduction has not been observed in particle-resolved direct numerical simulation (PR-DNS) studies (Picano, Breugem & Brandt Reference Picano, Breugem and Brandt2015; Fornari et al. Reference Fornari, Formenti, Picano and Brandt2016; Yu et al. Reference Yu, Lin, Shao and Wang2017; Costa, Brandt & Picano Reference Costa, Brandt and Picano2020, Reference Costa, Brandt and Picano2021), where either particle inertia is very low or the effect of gravity has not been included. Yu et al. (Reference Yu, Xia, Guo and Lin2021) performed fully resolved DNS in upward vertical channel flow including gravity. A decrease in the wall friction is observed for a settling coefficient (
 $u_i$) less than 0.3 compared with the unladen cases. A further increase in settling coefficient (
 $u_i > 0.3$) results in higher wall-friction. Zhu et al. (Reference Zhu, Yu, Pan and Shao2020) also observed the low wall-friction for spherical particles than oblate particles for a particle settling coefficient of 0.3 (figure 2 of their paper). This happens due to the attenuation of the large vortices by spherical particles. This study was done while keeping a constant bulk flow rate for an upward channel flow including gravity. Zade et al. (Reference Zade, Costa, Fornari, Lundell and Brandt2018) have performed experiments for square duct with different particle sizes (
 $2H/d_p = 9, 16$ and 40), Reynolds numbers (
 $Re_{2H} \sim 10\ 000\unicode{x2013}27\ 000$) and volume fractions (5 %, 10 % and 20 %) where particles considered are almost neutrally buoyant. Here,
 $2H$ is the duct's full height. It is found that the friction factor is significantly high (approximately by
 $10\,\%\unicode{x2013}50\,\%$) compared with a single phase at a low Reynolds number (
 $Re_{2H} = 10\ 042$). However, an increase in Reynolds number results in a decrease in friction factor. The friction factor decreases with an increase in particle diameter for a volume fraction less than 10 %. This leads to drag reduction compared with the single-phase flow even at
 $Re_{2H} \sim 27\ 000$. The decrease in drag is related to the attenuation of the turbulence. However, a non-monotonic drag modification is observed for a volume fraction of 20 % with the increase in particle diameter. At this volume loading, there is a decrease in the fluid fluctuations and Reynolds stress, but drag is increased due to an increase in particle-induced stress.
Costa et al. (Reference Costa, Brandt and Picano2021) performed the fully resolved simulations in a channel flow with a bulk Reynolds number of 5600 and observed an increase in drag at a particle volume fraction of  $3\times 10^{-5}\unicode{x2013}3.4\times 10^{-4}$. However, they commented that a drag reduction might be observed at a higher particle volume fraction which has been observed for point-particle simulations. Also, various efforts have been put to validate the point-particle approach with fully resolved simulations and experiments (Wang et al. Reference Wang, Fong, Coletti, Capecelatro and Richter2019). Costa et al. (Reference Costa, Brandt and Picano2020) compared the statistics of point particles and fully resolved cases and concluded that the inclusion of the Saffmann lift improves the particle statistics in the near-wall region. Mehrabadi et al. (Reference Mehrabadi, Horwitz, Subramaniam and Mani2018) did the comparison of point particle and PR-DNS for decaying isotropic turbulent flow. The authors found that for comparison of point particles and PR-DNS, correction for undisturbed velocity and finite Reynolds number are required in the point particle simulations to match the particle acceleration density function and second-order moments statistics with PR-DNS at high Stokes number. A Stokes number (
 $St_\eta$) of 100 is taken in their study (
 $St_\eta$ is based on the particle relaxation time and initial Kolmogorov time scale). For
 $St_\eta = 1$, there is not much difference in the simulations with and without correction of undisturbed velocity for point particles, and observed a good match with the particle-resolved simulations for the calculation of fluid kinetic energy and fluid dissipation rate. For
 $St_\eta = 100$, it is observed that the point particles with the Schiller–Naumann and undisturbed corrections show a good match with particle-resolved simulations for the fluid kinetic energy and fluid dissipation rate. Kulick et al. (Reference Kulick, Fessler and Eaton1994) performed experiments for particle-laden channel flows for a Reynolds number of 13 800 based on half-channel width. The authors observed a decrease in fluid fluctuations with increased particle mass loading, Stokes number and distance from the wall. It is reported that the anisotropy of fluid fluctuations increases with an increase in particle mass loading. In their study, the particle size is smaller than the Kolmogorov scale. Peng, Ayala & Wang (Reference Peng, Ayala and Wang2019) performed particle-resolved direct numerical simulations for turbulent channel flows using the lattice Boltzmann method (LBM). The authors considered the neutrally buoyant particles with and without rotation. It is observed that the neutrally buoyant particles affect the inter-component transfer rate of turbulent kinetic energy, and the energy is transferred from the streamwise component to the other two components in the buffer region. However, an opposite behaviour happens very close to the wall with rotating particles. It is worth noting that the authors considered the particle size larger than the Kolmogorov length scale (
 $d_p/\eta = 43.34$ and 21.7 in their case) and the material density of the particle was very similar to that of the fluid phase. However, in the present study, particle size is of the order of the Kolmogorov length scale and particle density is three orders of magnitude higher than the fluid phase. Yu et al. (Reference Yu, Lin, Shao and Wang2017) performed fully resolved simulations for turbulent channel flows with particle to fluid density ratio of 1–104.2 (
 $d_p/h = 0.1$). It is observed that there is almost no turbulence modulation for a density ratio of one, while the transverse fluid fluctuations decrease more than the streamwise fluid fluctuations for the density ratio of 10.42 and 104.2. Fornari et al. (Reference Fornari, Formenti, Picano and Brandt2016) performed PR-DNS for channel flow and adopted a particle to fluid density ratio (
 $\rho _r$) of 1–1000. It is observed that the anisotropy for the fluid fluctuations is increased in the near-wall zone at
 $\rho _r = 1000$ also. However, significant turbulence suppression happens away from the wall. Both of the above studies did not include the gravity in their work. Uhlmann (Reference Uhlmann2008) performed PR-DNS for vertical upward channel flows at bulk Reynolds number of 2700. The authors simulated the system with particle to fluid densities ratio of 2.21 and 10, including gravity. It was observed that the fluid fluctuations in the streamwise direction increase while the transverse direction decreases. Xia et al. (Reference Xia, Lin, Pan and Yu2021) performed the PR-DNS for upward and downward channel flows at bulk Reynolds number of 5746 and particle to fluid density ratios of 2–100. There is an insignificant change in fluid fluctuations for downward channel flows when the particle settling coefficient (ratio of particle velocity to friction velocity) is 0.1 and 0.2. However, the transverse fluid fluctuations decrease more than the streamwise fluid fluctuations for upward flow for similar particle settling coefficients. Vreman & Kuerten (Reference Vreman and Kuerten2018) simulated turbulent channel flow past a moving array of spherical particles with an overall particle volume fraction of
 $7.5\times 10^{-4}$. They observed that the turbulence kinetic energy (TKE) decreased significantly throughout the flow domain with an increase in anisotropy of the turbulence fluctuations. The authors have also mentioned that their findings are consistent with observations from experiments and point-particle simulations of dilute particle-laden flows in the limit of high Stokes numbers. Most of the PR-DNS for channel flow simulations are performed for low particle inertia (Uhlmann Reference Uhlmann2008; Picano et al. Reference Picano, Breugem and Brandt2015; Peng et al. Reference Peng, Ayala and Wang2019; Yang et al. Reference Yang, Peng, Wang and Wang2021) or without gravity (Fornari et al. Reference Fornari, Formenti, Picano and Brandt2016; Yu et al. Reference Yu, Lin, Shao and Wang2017; Costa et al. Reference Costa, Brandt and Picano2020, Reference Costa, Brandt and Picano2021). The wake induced reduction of anisotropy is possible for high particle Reynolds numbers and when the particle size is much larger than the Kolmogorov scale, which differs from the scope of the present work. A good accuracy of statistics between the point particle and fully resolved simulations has been demonstrated by Fröhlich et al. (Reference Fröhlich, Schneiders, Meinke and Schröder2018). The above discussion suggests that there is no consensus in the literature on the drag reduction in particle-laden wall-bounded flows, which depends on the parameters like fluid Reynolds number, particle Reynolds number and also on the particle terminal velocity. More systematic numerical simulations and their validation with controlled experiments are required to conclude the drag reduction phenomenon of particle-laden flows and the limitations of point-particle and PR-DNS methodology.
An increase in turbulence attenuation also leads to a further increase in anisotropy as a significant decrease is observed in wall-normal and spanwise directions than in the streamwise direction (Kulick et al. Reference Kulick, Fessler and Eaton1994; Zhao et al. Reference Zhao, Andersson and Gillissen2010; Shringarpure, Cantero & Balachandar Reference Shringarpure, Cantero and Balachandar2012; Gualtieri et al. Reference Gualtieri, Picano, Sardina and Casciola2013; Richter & Sullivan Reference Richter and Sullivan2013; Richter Reference Richter2015; Rohilla et al. Reference Rohilla, Muramulla and Goswami2022). Gualtieri et al. (Reference Gualtieri, Picano, Sardina and Casciola2013) commented that care should be taken while applying Kolmogorov theory as anisotropy is increased for particle-laden flows. Ferrante & Elghobashi (Reference Ferrante and Elghobashi2003) and Ahmed & Elghobashi (Reference Ahmed and Elghobashi2000) also discussed the increase in anisotropy for particle-laden homogenous isotropic and homogenous shear turbulence, respectively. In a recent study, Rohilla et al. (Reference Rohilla, Muramulla and Goswami2022) demonstrated that the LES models, like Smagorinsky and dynamic Smagorinsky models, perform poorly in predicting the turbulence modulation and the critical volume loading at which turbulence collapses completely. The scale-similarity and mixed models are found to perform better than Smagorinsky and dynamic models in predicting local energy flux (Boivin, Simonin & Squires Reference Boivin, Simonin and Squires2000). The authors mentioned that the former models could capture the backscatter and thus perform well. In earlier works, the deviation between DNS and LES in predicting statistical properties was attributed to the modelling error (Dritselis & Vlachos Reference Dritselis and Vlachos2011; Rohilla et al. Reference Rohilla, Muramulla and Goswami2022). All these observations demand a rigorous analysis to check the local isotropy of small scales, which is the basis of LES formulation. In the present study, we want to explore whether particles can alter the extent of anisotropy in the gas phase, and if so, what is the effect of increased anisotropy on the Kolmogorov constant? Direct numerical simulation is performed for turbulent channel flow at Reynolds numbers 3300 and 5600 based on average gas velocity and channel width to answer the above questions. The Kolmogorov constant has been computed following different methods using the simulation results. When the Kolmogorov constant is studied, the bottleneck and intermittency effects are worth discussing. These effects are studied by Donzis & Sreenivasan (Reference Donzis and Sreenivasan2010) where DNS is performed for isotropic turbulence for a range of Taylor Reynolds numbers ( $Re_\lambda = 38\unicode{x2013}1000$). The authors discussed the scaling of the bottleneck effect and the related problems in calculating the Kolmogorov constant. It is reported that the bottleneck effect would vanish at a Taylor Reynolds number of approximately
 $2\times 10^5$. Kaneda et al. (Reference Kaneda, Ishihara, Yokokawa, Itakura and Uno2003) observed that the Kolmogorov's theory (Kolmogorov Reference Kolmogorov1941) is valid for
 $Re_\lambda < 700$, and the scaling is steeper than
 $(-5/3)$ for
 $Re_\lambda > 700$. Ishihara et al. (Reference Ishihara, Morishita, Yokokawa, Uno and Kaneda2016) proposed the scaling law for higher Reynolds numbers similar to work by Kolmogorov (Reference Kolmogorov1962). Wang et al. (Reference Wang, Chen, Brasseur and Wyngaard1996) performed high-resolution simulations for free-decaying and stationary forced turbulence to examine the K62 hypothesis (Kolmogorov Reference Kolmogorov1962). The authors observed that the probability distribution of averaged dissipation shows an intermittent behaviour in the inertial range. The authors concluded that their study was in agreement with the K62 hypothesis. In earlier studies, such as those by Donzis & Sreenivasan (Reference Donzis and Sreenivasan2010) and Yeung & Zhou (Reference Yeung and Zhou1997), it has been observed that the presence of inertial range is not possible for
 $Re_\lambda < 200$. However, the Kolmogorov constant for lower
 $Re_\lambda$ can be defined from the peak point of compensated spectra or second-order velocity structure functions (Jiménez et al. Reference Jiménez, Wray, Saffman and Rogallo1993; Sreenivasan Reference Sreenivasan1995; Antonia et al. Reference Antonia, Zhou and Romano1997; Choi et al. Reference Choi, Yeo and Lee2004). In the present work, the simulations are carried out at low
 $Re_\lambda$ where we do not expect a clear inertial range. Thus, the term apparent Kolmogorov constant is used for the peak point of compensated spectra and second-order velocity structure functions. A constant value of Kolmogorov prefactor exists for
 $Re_\lambda > 10^{4}$ (Lien & D'Asaro Reference Lien and D'Asaro2002). The aim of the present study is not to comment on the universality of the Kolmogorov constant which is achieved at a high Reynolds number. It rather highlights the increase in local anisotropy of small and large scales of turbulence for particle-laden cases that consequently affects the apparent Kolmogorov constant. The variation of the apparent Kolmogorov constant as a function of particle volume loading has been used to predict the fluid phase statistics. In the proposed modelling approach, the variation of the Smagorinsky coefficient is estimated from the variation of the apparent Kolmogorov constant. The simulations are performed to predict the dynamics of the fluid phase without solving the particle phase equations simultaneously, and thus it is computationally less expensive. The present analysis of variation of the apparent Kolmogorov constant with particle volume loading and the new methodology will provide insight to develop advanced models for two-phase turbulent flows. This work is important for the current scenario because many studies are performed at similar Reynolds numbers (
 $\sim Re_b = 5600$) (Armenio, Piomelli & Fiorotto Reference Armenio, Piomelli and Fiorotto1999; Kuerten & Vreman Reference Kuerten and Vreman2005; Kuerten Reference Kuerten2006; Marchioli, Salvetti & Soldati Reference Marchioli, Salvetti and Soldati2008; Vreman et al. Reference Vreman, Geurts, Deen, Kuipers and Kuerten2009; Dritselis & Vlachos Reference Dritselis and Vlachos2011; Zamansky, Vinkovic & Gorokhovski Reference Zamansky, Vinkovic and Gorokhovski2013; Duque-Daza, Ramirez-Pastran & Lain Reference Duque-Daza, Ramirez-Pastran and Lain2021; Rohilla et al. Reference Rohilla, Muramulla and Goswami2022) which are of practical importance.
The outline of the article is as follows. In § 2, the fluid and particle phase equations and the simulation parameters are discussed. In § 3, the simulation results on assessing anisotropy and second-order velocity structure functions are presented for different Reynolds and Stokes numbers. The new methodology for the subgrid-scale model to capture the fluid phase statistics in particle-laden turbulent flows without the particles is discussed in § 4. The summary of the work is discussed in § 5.
2. Simulation methodology
In the present investigation, fluid phase is considered to be incompressible and described by the continuity and Navier–Stokes equation as
 $$\begin{gather} \frac{\partial \boldsymbol{u}_i}{\partial \boldsymbol{x}_i}=0, \end{gather}$$
 $$\begin{gather}\frac{\partial
\boldsymbol{u}_i}{\partial t} +
\frac{\partial\boldsymbol{u}_i \boldsymbol{u}_j}{\partial
\boldsymbol{x}_{j}} ={-} \frac{1}{\rho_f}
\frac{\partial p}{\partial \boldsymbol{x}_i} + {\nu}
\frac{\partial^2 \boldsymbol{u}_i}{\partial
\boldsymbol{x}_{j} \partial
\boldsymbol{x}_{j}} +
\frac{\boldsymbol{f}_{i}({\boldsymbol
x},t)}{\rho_f},
\end{gather}$$
where  $\boldsymbol{u}_i$ is the velocity,
 $p$ is the pressure,
 $\rho _f$ is the density of the fluid and
 $\nu$ is the kinematic viscosity. The feedback force density due to the solid phase is considered using the
 $f({\boldsymbol x},t)$ term. The pseudo-spectral method has been used to solve the Navier–Stokes equation. A second-order Adams–Bashforth scheme for the nonlinear term and Crank–Nicholson time discretization has been used for the linear terms. The lift and drag forces are included in the feedback force term, which can be expressed as
 \begin{equation}
\boldsymbol{f}_{i}({\boldsymbol x},t) ={-} \sum_I
(\boldsymbol{F}_{i,I}^D + \boldsymbol{F}_{i,I}^L) \delta
({\boldsymbol x}-{\boldsymbol x}_I),
\end{equation}
where  ${\boldsymbol x}$ is the fluid node,
 ${\boldsymbol x}_I$ is the position of the
 $I$th particle,
 $\boldsymbol {F}_{i,I}^L$ and
 $\boldsymbol {F}_{i,I}^D$ are the lift and drag forces on the particle
 $I$. Additionally,
 $\delta ({\boldsymbol x}-{\boldsymbol x}_I)$ is the Dirac delta function in three dimensions. The fluid phase momentum equation is not corrected including the fluid volume fraction term as the particle volume fraction is much lower compared with the continuum phase volume fraction (
 $\phi _v^{air}\approx 1$) (Dritselis & Vlachos Reference Dritselis and Vlachos2008, Reference Dritselis and Vlachos2011; Richter Reference Richter2015; Vreman Reference Vreman2015; Ghosh & Goswami Reference Ghosh and Goswami2022a,Reference Ghosh and Goswamib).
In the present study, the point-particle approach (Bagchi & Balachandar Reference Bagchi and Balachandar2003; Mehrabadi et al. Reference Mehrabadi, Horwitz, Subramaniam and Mani2018) is considered with drag and lift corrections as discussed in detail by Muramulla et al. (Reference Muramulla, Tyagi, Goswami and Kumaran2020). The point particles are tracked in the Lagrangian frame, and Newton's second law describes their motion. The particle–wall and particle–particle collisions have also been considered. The particle motion is described by
 \begin{equation}
m_p \frac{{\rm d} \boldsymbol{v}_{i,I}}{{\rm d}t} =
\boldsymbol{F}_{i,I}^{D} +
\boldsymbol{F}_{i,I}^{L} +
\sum_{I\neq J} \boldsymbol{F}_{i,IJ} +
\boldsymbol{F}_{i,Iw} + m_p
\boldsymbol{g},\end{equation}
where  $m_p$ is the mass,
 $\boldsymbol {v}_{i,I}$ is the velocity of the
 $I$th particle,
 $\boldsymbol {F}_{i,I}^{D}$ is the drag force and
 $\boldsymbol {F}_{i,I}^{L}$ is the lift force exerted on the particle. In (2.4),
 $\boldsymbol {g}$ is the gravitational acceleration,
 $\boldsymbol {F}_{i,IJ}$ is the force due to interaction between the
 $I$th and
 $J$th particles, and
 $\boldsymbol {F}_{i,Iw}$ is the force due to interaction between the
 $I$th particle and wall. In the present study, the effect of gravity and lift are included as it is reported that the implementation of the lift force improves the particle statistics in the near-wall region (Marchioli, Picciotto & Soldati Reference Marchioli, Picciotto and Soldati2007; Costa et al. Reference Costa, Brandt and Picano2020). Marchioli et al. (Reference Marchioli, Picciotto and Soldati2007) explored the effect of gravity and lift on the particle distribution in wall-bounded flows. The hard-sphere approach is taken to account the the particle–particle and particle–wall elastic collisions. The inertia corrected drag law (Naumann & Schiller Reference Naumann and Schiller1935) is used to calculate the drag force as
 \begin{equation} \boldsymbol{F}_{i,I}^D = 3 {\rm \pi}\mu d_p (\tilde{\boldsymbol{u}}_{i,I}(\boldsymbol{x},t) - \boldsymbol{v}_{i,I}) (1+ 0.15Re_p^{0.687}).\end{equation}
Although a point-particle approximation has been used, the grid size very near the wall in the wall-normal direction may be smaller than the particle size in the near-wall region. Thus, the fraction of particle surface present in the cell is used to calculate the force on the grid. The fluid velocity is interpolated at the particle location to calculate the drag and lift. The detailed simulation procedure for the calculation of the feedback force, corrections to obtain the undisturbed fluid velocity field at the particle location, and the near-wall corrections in lift and drag force have been discussed in our earlier work (Muramulla et al. Reference Muramulla, Tyagi, Goswami and Kumaran2020). The implementation of Saffmann lift and correction for undisturbed velocity are important to accurately predict the spatial particle distribution (Mehrabadi et al. Reference Mehrabadi, Horwitz, Subramaniam and Mani2018; Wang et al. Reference Wang, Fong, Coletti, Capecelatro and Richter2019; Costa et al. Reference Costa, Brandt and Picano2020; Brandt & Coletti Reference Brandt and Coletti2022), which have been included in this study. The particle-to-fluid density ratios considered in the present study are  $\approx$1000 or higher. Therefore, the buoyancy and Basset history effects are neglected in the particle's equation of motion.
The simulations have been performed in a vertical channel with length  $8{\rm \pi} \delta$ in the streamwise (
 $x$) direction,
 $2\delta$ in the wall normal (
 $y$) direction and
 $(4/3){\rm \pi} \delta$ in spanwise (
 $z$) direction, where
 $\delta$ is the half-channel width. Wall normal direction is wall bounded, streamwise and spanwise directions are considered as periodic. No-slip boundary conditions are applied on the walls. The bulk Reynolds numbers (
 $Re_b = \rho _f \times \bar {u} \times 2\delta /\mu _f$) are fixed at 3300 and 5600 based on the channel width (
 $2\delta$) and average fluid velocity (
 $\bar {u}$). For Reynolds numbers of 3300 and 5600, 128 and 64, and 192 and 160 Fourier modes are used in the streamwise and spanwise directions, respectively (Muramulla et al. Reference Muramulla, Tyagi, Goswami and Kumaran2020). For wall-normal direction, 65 and 129 Chebyshev modes are used for
 $Re_b = 3300$ and 5600, respectively. The corresponding Reynolds numbers (
 $Re_c$) based on the centreline turbulent velocity and half-channel width are 2000 and 3360, and the Reynolds numbers (
 $Re_\tau$) based on unladen frictional velocity and half-channel width are 115 and 180. It is worth mentioning that the present investigation is performed under the fully developed turbulent flow condition as the transitional regime for the channel flow occurs in the range
 $1300\leq Re_b \leq 1800$ and
 $62.5\leq Re_\tau \leq 73.5$ (Patel & Head Reference Patel and Head1969; Carlson, Widnall & Peeters Reference Carlson, Widnall and Peeters1982; Sano & Tamai Reference Sano and Tamai2016; Zhang Reference Zhang2017). Thus, the simulations in our work are carried out at
 $Re_b$ of 1.8 and 3 times the upper limit of the transitional regime. The domain lengths (
 $L_x^+ \times L_y^+ \times L_z^+$) are
 $2921\times 232 \times 486$ and
 $4562 \times 363 \times 760$ for Reynolds numbers of 3300 and 5600, respectively. The (
 $^+$) symbol is used to indicate that the quantities are normalized with viscous scales. A time step of
 $0.0033h/\bar {u}$ is used in the simulations, where
 $h(=2\delta )$ is the channel width and
 $\bar {u}$ is the bulk velocity of the fluid phase. The pressure gradient is adjusted to maintain a constant bulk flow rate. The range of particle Stokes numbers is shown in table 1. In the present work, the particle diameter (
 $d_p$) is taken as
 $39\ \mathrm {\mu }$m and the particle density (
 $\rho _p$) is changed to have a range of Stokes number. The fluid phase is considered as air, where the fluid density (
 $\rho _f$) and dynamic viscosity (
 $\mu _f$) are 1.179 kg m
 $^{-3}$ and
 $1.75\times 10^{-5}\ {\rm kg}\ {\rm m}\ {\rm s}^{-1}$, respectively. The ratio of channel width (
 $2\delta$) to particle diameter (
 $d_p$) is 54. Simulations are performed for a range of Stokes numbers (
 $St = 52.73\unicode{x2013}210.93$). Various authors have reported simulations and experiments for Stokes numbers in this range (Li et al. Reference Li, McLaughlin, Kontomaris and Portela2001; Hwang & Eaton Reference Hwang and Eaton2006; Vreman et al. Reference Vreman, Geurts, Deen, Kuipers and Kuerten2009; Goswami & Kumaran Reference Goswami and Kumaran2011; Capecelatro, Desjardins & Fox Reference Capecelatro, Desjardins and Fox2015; Vreman Reference Vreman2015; Muramulla et al. Reference Muramulla, Tyagi, Goswami and Kumaran2020).
The Stokes number ( $St$) is defined as
 $St = \tau _p/\tau _f$, where
 $\tau _p = \rho _p d_p^2/18\mu _f$,
 $\tau _f = 2\delta /\bar {u}$,
 $\rho _p$ is the particle density,
 $d_p$ is the particle diameter,
 $\mu _f$ is the fluid dynamic viscosity,
 $\delta$ is the half channel width and
 $\bar {u}$ is the average fluid velocity. Here,
 $Re_b$ is the fluid bulk Reynolds number.

3. Results
The simulations are performed for bulk Reynolds numbers of 3300 and 5600 for a range of volume fractions and different Stokes numbers using a pseudo-spectral code used in our earlier studies (Kumaran et al. Reference Kumaran, Muramulla, Tyagi and Goswami2020; Muramulla et al. Reference Muramulla, Tyagi, Goswami and Kumaran2020). It is observed that the turbulence attenuation increases with an increase in volume loading steadily up to a certain volume fraction, and then there is a sudden collapse in the turbulence intensities (Kumaran et al. Reference Kumaran, Muramulla, Tyagi and Goswami2020; Muramulla et al. Reference Muramulla, Tyagi, Goswami and Kumaran2020; Rohilla et al. Reference Rohilla, Muramulla and Goswami2022). The particle volume loading at which turbulence collapse happens is referred to as critical particle volume loading (CPVL). Other authors have also observed the complete turbulence collapse in different flow configurations (Mito & Hanratty Reference Mito and Hanratty2006; Shringarpure et al. Reference Shringarpure, Cantero and Balachandar2012; Capecelatro, Desjardins & Fox Reference Capecelatro, Desjardins and Fox2018; Duque-Daza et al. Reference Duque-Daza, Ramirez-Pastran and Lain2021; Wang, Li & Zheng Reference Wang, Li and Zheng2021; Yu et al. Reference Yu, Xia, Guo and Lin2021). A detailed analysis of the effect of volume fraction and Stokes number on the turbulence attenuation is presented in earlier studies (Li et al. Reference Li, McLaughlin, Kontomaris and Portela2001; Mito & Hanratty Reference Mito and Hanratty2006; Dritselis Reference Dritselis2016; Capecelatro et al. Reference Capecelatro, Desjardins and Fox2018; Kumaran et al. Reference Kumaran, Muramulla, Tyagi and Goswami2020; Muramulla et al. Reference Muramulla, Tyagi, Goswami and Kumaran2020). In this work, we quantify the modification in the extent of anisotropy of turbulence fluctuations, which is associated with the modulation of turbulence due to the presence of the dispersed phase. The local isotropy of the small scales across the channel width can be assessed from the ratio of Kolmogorov time scale to mean shear time scale (Corrsin Reference Corrsin1957; Antonia & Kim Reference Antonia and Kim1992; Saddoughi & Veeravalli Reference Saddoughi and Veeravalli1994). The necessary condition for the small scale to be isotropic was provided by Corrsin (Reference Corrsin1957) as
 \begin{equation} \left( \frac{\nu}{\epsilon}\right)^{1/2} \ll \frac{1}{S}\ {\rm or} \ S_c^* \ll 1, \end{equation}
where  $S = {\rm d}U/{{\rm d} y}$ is the mean shear rate,
 $\epsilon$ is the mean energy dissipation rate and
 $S_c^* = S (\nu /\epsilon )^{1/2}$. However, Antonia & Kim (Reference Antonia and Kim1992) reported that this condition is too restrictive and can be relaxed with
 $S_c* \leq 0.2$ for the small scales to be isotropic. Antonia & Kim (Reference Antonia and Kim1992) performed a DNS study for channel flow and found a value of
 $S_c^* = 2.5$ at the wall, and it reduces to a low value for
 $y^+ > 60$. The
 $S_c^*$ is plotted as a function of wall-normal position for a particle Stokes number of
 $105.47$ and fluid phase Reynolds number of 3300 at different average volume fractions (
 $\phi _{av}$), which is shown in figure 1(a). It is observed that the
 $S_c^*$ is 2.53 at the wall for unladen flow, and a decrease of almost one order of magnitude is observed away from the wall. The value of
 $S_c^*$ increases across the channel width as the particle volume loading is increased. For a particle loading of
 $9\times 10^{-4}$,
 $S_c^*$ at the wall is 1.5 times higher than the unladen flow. Spatial averaged
 $S_c^*$ across the channel (
 $\langle S_c^* \rangle _s$) for the bulk Reynolds numbers of 3300 and 5600 and different Stokes numbers are shown in figure 1(b). In the case of unladen flows,
 $\langle S_c^* \rangle _s$ is higher for
 $Re_b = 3300$ compared with
 $Re_b = 5600$ which indicates that the time scale separation is less at lower Reynolds number. Here,
 $\langle S_c^* \rangle _s$ increases with an increase in particle loading for both the Reynolds numbers. With an increase in particle inertia (
 $St$),
 $\langle S_c^* \rangle _s$ increases marginally when the particle volume fraction is high. This suggests an increase in anisotropy of the small scales for particle-laden cases.
The ratio of Kolmogorov time scale to mean shear time scale, ( $S_c^* = S (\nu /\epsilon )^{1/2}$), for different volume fractions. (a)
 $S_c^*$ for
 ${Re_b = 3300}$ and St = 105.47. (b) Spatial averaged
 $S_c^*$ across the channel width for
 ${Re_b = 3300}$ and 5600 with different Stokes numbers (
 $St$) and average volume fraction (
 $\phi$ or
 $\phi _{av}$). In panel (b), the symbols with dashed lines are for
 $Re_b = 3300$ and symbols with solid lines are for
 $Re_b = 5600$. In panel (a),
 $\delta$ is the half-channel width.

It is observed from figure 1 that the local isotropy of small scales decreases across the channel with an increase in solid volume fraction. However, it is important to calculate the Taylor Reynolds number ( $Re_\lambda$) across the channel flow, which is defined as
 $Re_\lambda = [(20/3)(k^{+^2}/\epsilon ^+)]^{1/2}$ (Choi et al. Reference Choi, Yeo and Lee2004; Yu et al. Reference Yu, Xia, Guo and Lin2021). Here,
 $k^+$ and
 $\epsilon ^+$ are the fluctuating kinetic energy and dissipation rate normalized with viscous scales. The Taylor Reynolds number is plotted for a range of volume fractions at
 $Re_b = 3300$,
 $St = 105.47$ and
 $Re_b = 5600$,
 $St = 210.93$, figure 2(a,b). The Taylor Reynolds number is almost constant away from the wall for the unladen case, and a decrease is observed near the channel centre region. The Taylor Reynolds number of 25 was observed in the channel centre by Yu et al. (Reference Yu, Xia, Guo and Lin2021) for
 $Re_b = 5746$ which is almost the same in our case also for the
 $Re_b = 5600$ unladen case. The
 $Re_\lambda$ decreases across the channel with an increase in particle volume loading. The horizontal dashed line across the graphs is plotted at
 $Re_\lambda = 20$, and two dashed vertical lines refer to
 $y^+ = 15$ and 50. The three different channel locations are chosen for the assessment of local isotropy. These locations are
 $y^+ = 15, 50$ and 115 for
 $Re_b = 3300$, and are
 $y^+ = 15, 50$ and 180 for
 $Re_b = 5600$. The wall-normal distance (
 $y^+$) is normalized with unladen frictional velocity and kinematic viscosity. The
 $y^+ = 15$ and 50 are chosen to have a
 $Re_\lambda > 20$ for all the considered cases as Sreenivasan (Reference Sreenivasan1995) also has collected the experimental data for
 $Re_\lambda > 20$ only. The channel centre location is also taken for the assessment as the particle affects the turbulence intensities more in the channel centre than the near-wall region (Kulick et al. Reference Kulick, Fessler and Eaton1994). The
 $Re_\lambda$ at these locations for both the Reynolds numbers is plotted in figure 2(c,d) for the considered Stokes numbers. For laden cases, a large decrease in
 $Re_\lambda$ is observed in the channel centre region as the volume fraction is increased. The decrease in
 $Re_\lambda$ is less and remains above 20 at
 $y^+ = 15$ and 50 with an increase in volume loading, except just before CPVL. The Stokes number effect on the
 $Re_\lambda$ with an increase in particle volume loading is negligible except near the CPVL.
The Taylor Reynolds number ( $Re_\lambda$) is plotted in the wall-normal direction for a range of volume fractions in (a)
 $Re_b = 3300$,
 $St = 105.47$ and (b)
 $Re_b = 5600$,
 $St = 210.93$. The
 $Re_\lambda$ at three channel locations and different Stokes numbers is plotted over a range of volume fractions for (c)
 $Re_b = 3300$ and (d)
 $Re_b = 5600$.

The local isotropy at the small scales can also be checked using the expressions of the second-order velocity structure function and the mean energy dissipation rate for the homogeneous isotropic turbulence. In the limit of small  $r$, the moment of longitudinal velocity fluctuation is defined with the following expression (Kolmogorov Reference Kolmogorov1941):
 \begin{equation} \langle (\delta u'_x)^2\rangle r^{{-}2} = \left(\frac{\partial u'_x}{\partial x}\right)^2, \end{equation}
where  $r$ is the distance between the two points and
 $\delta u'_x = u'_x(x+r) - u'_x(x)$ with
 $u'_x$ being the longitudinal fluctuation. The mean energy dissipation rate (
 $\epsilon$) for homogeneous isotropic turbulence (Pope Reference Pope2000) is expressed as
 \begin{equation} \epsilon = 15 \nu \left(\frac{\partial u'_x}{\partial x}\right)^2. \end{equation}
Using the above two equations for local isotropy of the dissipation range, the following relation holds:
 \begin{equation} \langle (\delta u^{'*}_x)^{2}\rangle (r^*)^{{-}2} = \tfrac{1}{15}.\end{equation}
Here, (*) denote the non-dimensionalized quantities. Additionally,  $\delta u'_x$ is normalized using Kolmogorov velocity scale,
 $u_k = (\nu \epsilon )^{1/4}$, and
 $r$ is normalized with Kolmogorov length scale,
 $\eta = \nu ^{3/4}/\epsilon ^{1/4}$. Using DNS, we have computed
 $\langle (\delta u^{'*}_x)^{2}\rangle (r^*)^{-2}$ and compared the unladen cases with (3.4) and also with the experimental data reported by Antonia et al. (Reference Antonia, Zhou and Romano1997) for both the Reynolds numbers, as shown in figure 3(a). A good agreement is observed for different wall-normal locations and Reynolds numbers. Figure 3(a) shows that for both Reynolds numbers, the channel centre location is nearly isotropic for unladen flows. However, the near-wall region deviates from the isotropic condition, which has been reported in experiments (Antonia et al. Reference Antonia, Zhou and Romano1997). In figure 3(b–d), we present the effect of particle volume loading on local isotropy at three different channel locations for
 $St = 210.93$ and
 $Re_b = 5600$. It is observed that the deviation from the local isotropy increases with an increase in particle volume loading at
 $y^+ = 15$ and 180. There is negligible change in the profiles at
 $y^+ = 50$ (figure 3c) in spite of a very similar decrease in
 $Re_\lambda$ at both
 $y^+ = 15$ and 50, shown in figure 2(c,d). Similar observations are followed for a Reynolds number of 3300, which are not shown here for brevity. The isotropy of the inertial range is unlikely to be achieved if there is a deviation from isotropy at the small scales (Antonia et al. Reference Antonia, Zhou and Romano1997). Thus, it is expected that the decrease in the local isotropy of small scales with an increase in particle volume loading will affect the local isotropy at inertial range and the Kolmogorov constant. Here, we examine that effect via second-order velocity structure function and compensated spectra. The reduction in isotropy for particle-laden flows is related to the extent of attenuation of the different components of fluid velocity fluctuations. It is observed that the decrease in the transverse velocity component is more than the streamwise component (Kulick et al. Reference Kulick, Fessler and Eaton1994; Zhao et al. Reference Zhao, Andersson and Gillissen2010; Gualtieri et al. Reference Gualtieri, Picano, Sardina and Casciola2013; Richter & Sullivan Reference Richter and Sullivan2013; Richter Reference Richter2015; Rohilla et al. Reference Rohilla, Muramulla and Goswami2022) as the particle volume fraction is increased. Richter & Sullivan (Reference Richter and Sullivan2013) mentioned that inertial particles reduce the ability of the carrier phase to transfer the momentum flux in a wall-normal direction. This increased anisotropy may affect the Kolmogorov constant for particle-laden cases, which is analysed hereafter.
The second-order velocity structure functions multiplied with  $r^{*-2}$ are plotted for (a) unladen cases, and for a range of volume fractions (
 $\phi$) at (b)
 $y^+ = 15$, (c)
 $y^+ = 50$ and (d)
 $y^+ = 180$ for
 $Re_b = 5600$ and
 $St = 210.93$. The dashed black line is the (
 $1/15$) ordinate.

The second-order velocity structure function in the inertial range is defined as (Kolmogorov Reference Kolmogorov1941)
 \begin{equation} \langle (\delta u'_x)^2 \rangle = C_2 (\epsilon r)^{2/3},\end{equation}
where  $\epsilon$ is the mean viscous dissipation rate and
 $\delta u'_x = u'_x(x+r) - u'_x(x)$, with
 $u'_x$ being the longitudinal fluctuations. The
 $r$ is described as
 $\eta \ll r \ll L$, with
 $L$ as the integral length scale. In the above expression,
 $C_2$ is the Kolmogorov constant and angular brackets denote the time averaging. An equivalent relation in terms of scaled variables can be written as
 $\langle (\delta u^{'*}_x)^2 \rangle = C_2 (r^*)^{2/3}$. The second-order velocity structure function for the unladen case is plotted in figure 4 using the scaled form of (3.5). The (
 $^*$) denotes the scaled variables. To validate our results, the profiles are plotted for both the Reynolds numbers at two locations, one in the near-wall region (
 $y^+ = 15$) and the other at the channel centre (at
 $y^+ = 180$ for
 $Re_b = 5600$ and at
 $y^+ = 115$ for
 $Re_b = 3300$). Figure 4(a) shows the validation for unladen flows against the experimental data for channel flow reported by Antonia et al. (Reference Antonia, Zhou and Romano1997), and simulation data for isotropic turbulence reported by Yeung & Zhou (Reference Yeung and Zhou1997) and Donzis & Sreenivasan (Reference Donzis and Sreenivasan2010). There is a good agreement between the experimental data and the present DNS results for both the channel locations and Reynolds numbers. The simulation data of isotropic turbulence (Yeung & Zhou Reference Yeung and Zhou1997; Donzis & Sreenivasan Reference Donzis and Sreenivasan2010) predict a higher value of
 $C_2$ due to higher
 $Re_\lambda$ used in those studies. In figure 4, the peak value of
 $C_2$ (from the plateau in the inertial range where statistical properties are only dependent on the mean energy dissipation rate) is considered as the apparent Kolmogorov constant (Sreenivasan Reference Sreenivasan1995; Sreenivasan & Antonia Reference Sreenivasan and Antonia1997; Donzis & Sreenivasan Reference Donzis and Sreenivasan2010). The majority values of
 $C_2$ (peak value of the second-order velocity structure function) reported in the literature are 2 or more (Saddoughi & Veeravalli Reference Saddoughi and Veeravalli1994; Antonia et al. Reference Antonia, Zhu, Anselmet and Ould-Rouis1996; Yeung & Zhou Reference Yeung and Zhou1997; Choi et al. Reference Choi, Yeo and Lee2004; Donzis & Sreenivasan Reference Donzis and Sreenivasan2010; Sawford & Yeung Reference Sawford and Yeung2011). However, a lower value of
 $C_2$ occurs due to lower Reynolds number (Sreenivasan Reference Sreenivasan1995) or if there is a deviation of isotropy in dissipation (Antonia et al. Reference Antonia, Zhou and Romano1997) and inertial range (Yeung & Zhou Reference Yeung and Zhou1997).
The second-order velocity structure functions multiplied by  $r^{*-2/3}$ are plotted for (a) unladen cases, and for a range of volume fractions (
 $\phi$) at (b)
 $y^+ = 15$, (c)
 $y^+ = 50$ and (d)
 $y^+ = 180$ for
 $Re_b = 5600$ and
 $St = 210.93$. The dashed black line is the 1.2 ordinate.

In figure 4(b–d), the second-order velocity structure function profiles are shown as a function of different particle volume loadings at three channel locations and Reynolds number of 5600 with particles  $St = 210.93$. It is observed that at
 $y^+ = 15$ and 180 (Rohilla & Goswami Reference Rohilla and Goswami2022), there is a decrease in the value of the scaled second-order velocity structure function (
 $\langle (\delta u^{'*}_x)^2 \rangle r^{*-2/3}$) at all the
 $r^*$ locations for an increase in volume fraction. The peak value for unladen flow is 1.2 and it decreases nearly to 0.4 for
 $\phi = 0.0027$ for the unladen flow, which indicates that the two-point correlation of fluid velocity fluctuation becomes weaker with an increase in the solid volume loading, shown in figure 4(d). At
 $y^+ = 15$, with an increase in solid volume fraction, a maximum of 25 % decrease in Taylor Reynolds number is observed, figure 2. Therefore, the decrease in the peak value of the second-order structure function (
 $\langle (\delta u^{'*}_x)^2 \rangle r^{*-2/3}$) may be due to the increase in anisotropy across the channel width. However, no significant change is observed in the second-order structure function at
 $y^+ = 50$ location, figure 4(b). The length scale associated with the peak location of the second-order structure function (
 $L_{peak}$) from figure 4 and integral length scale calculated via the streamwise spatial correlation (
 $L_I$) for
 $Re_b = 5600$ and
 $St = 210.93$ show that at the near-wall region,
 $L_I/\eta$ is of the order of the channel half-width for the lower volume fractions, and it increases with an increase in particle volume fraction. The physical length scale associated with the peak value of the second-order structure function is almost two orders of magnitude higher than the Kolmogorov length scale. However, scale separation is much lower at the central zone.
In figure 5, the peak values ( $C_2$) of the second-order velocity structure functions are plotted for three channel locations,
 $y^+ = 15$, 50 and at the channel centre (at
 $y^+ = 180$ for
 $Re_b = 5600$ and at
 $y^+ = 115$ for
 $Re_b = 3300$), for a range of solid volume fraction (
 $\phi _{av}$). In figure 5(a–d), the
 $C_2$ is plotted for both the Reynolds numbers and Stokes numbers given in table 1. It is observed that the apparent Kolmogorov constant (
 $C_2$) decreases significantly with an increase in volume loading at the near-wall (
 $y^+ = 15$) and the channel centre for both the Reynolds numbers and Stokes numbers considered here. Also, it is observed that the effect of particle loading to reduce
 $C_2$ is more significant in the channel centre location compared with the near-wall region (
 $y^+ = 15$) of the channel. Interestingly, a cross-over occurs as the volume loading is increased, and the
 $C_2$ value becomes lower at the channel centre than the near-wall region for all the Stokes numbers. The larger decrease of
 $C_2$ at the channel centre is due to the larger decrease in
 $Re_\lambda$ at this position (figure 2c,d) and an associated increase in the anisotropy. The change in
 $C_2$ for the
 $y^+ = 50$ is non-monotonic and remain almost constant.
The peak of second-order velocity structure function (from figure 4) is plotted at different channel locations as a function of solid volume fractions for (a)  $Re_b = 3300$ and
 $St = 52.73$, (b)
 $Re_b = 3300$ and
 $St = 105.47$, (c)
 $Re_b = 3300$ and
 $St = 210.93$, (d)
 $Re_b = 5600$ with
 $St = 105.47$ and 210.93.

Figure 6 presents a consolidated picture of  $C_2$ at different channel locations for all the Stokes, Reynolds numbers, and volume fractions. For
 $y^+ = 50$, shown in figure 6(a), the variation of
 $C_2$ with an increase in volume loading is non-monotonic with an insignificant variation over the range of volume fraction. A linear decrease in
 $C_2$ with volume fractions is observed at
 $y^+ = 15$ and at the channel centre, as shown in figure 6(b). The observations suggest that the apparent Kolmogorov constant is a function of the particle volume fraction (
 $\phi _{av}$) and the wall-normal location for particle-laden turbulent flows at low Reynolds number. The effect of Stokes number on the variation of the apparent Kolmogorov constant seems insignificant for the range reported here. Thus, from the analysis of the second-order structure function, it is observed that the apparent Kolmogorov constant remains unaffected in the initial part of the log-law regime, and a decrease is observed close to the wall and in the channel centre with an increase in particle volume loading. It is interesting to note that the value of
 $Re_\lambda$ and the variation in
 $Re_\lambda$ with an increase in particle loading are almost similar at
 $y^+ = 15$ and 50 for both the Reynolds numbers (figure 2c,d), but there is almost no change in the
 $C_2$ at
 $y^+ = 50$ as shown in figure 6(a). However, a significant decrease in
 $C_2$ is observed at
 $y^+ = 15$. It is worth noting that for unladen flow, the
 $Re_\lambda$ is 25 in the channel centre for
 $Re_b = 5600$, and a similar
 $Re_\lambda$ occurs for the near-wall region for
 $\phi = 1.5\times 10^{-3}$, figure 2(d). However,
 $C_2$ near the wall (for
 $\phi = 1.5\times 10^{-3}$) is 20 % lower than the
 $C_2$ at the centre for unladen flow. Similar observations are followed for other Reynolds numbers and locations as well. All the above observations suggest that
 $C_2$ is not only a function of channel location and
 $Re_\lambda$, but it is also a function of particle volume loading.
The peak of the second-order velocity structure function (from figure 4) is plotted at  $Re_b = 3300$ and 5600 for different volume fraction cases at (a)
 $y^+ = 50$, (b)
 $y^+ = 15$ and channel centre. The symbols with lines are for
 $Re_b = 5600$ and symbols without lines are for
 $Re_b = 3300$. The symbols for
 $Re_b = 5600$ in panel (b) are the same as those in figure 5(d). The black and red dashed lines in panel (b) are the fitting curves for
 $Re_b = 5600$ and
 $Re_b = 3300$, respectively.

The spectral representation of turbulent kinetic energy is given as (Pope Reference Pope2000)
 \begin{equation}
\hat{E}(k) = \tfrac{1}{2} \langle \hat{\boldsymbol{u}}_i'(k) \hat{\boldsymbol{u}}^{\prime*}_i(k)
\rangle,\end{equation}
where  $\hat {\boldsymbol {u}}'_i(k)$ is the Fourier transform of
 $\boldsymbol {u}'_i(\boldsymbol {x},t)$ over the homogenous directions and
 $\hat {\boldsymbol {u}}^{'*}_i(k)$ is the complex conjugate of
 $\hat {\boldsymbol {u}}'_i(k)$. Here,
 $\langle {\cdot } \rangle$ denotes the ensemble averaging. The energy spectrum density,
 $E(k)$, is calculated using (3.6). In figure 7(a), the normalized energy spectrum density (
 $E^+ = E(k)/(u_\tau \nu )$) is compared with earlier studies (Del Álamo & Jiménez Reference Del Álamo and Jiménez2003; Del Álamo et al. Reference Del Álamo, Jiménez, Zandonade and Moser2004; Hoyas & Jiménez Reference Hoyas and Jiménez2006; Trofimova et al. Reference Trofimova, Tejada-Martínez, Jansen and Lahey2009; Andrade et al. Reference Andrade, Martins, Mompean, Thais and Gatski2018) for verification at two channel locations of
 $y^+ = 15$ and 50 which shows a good agreement. The Kolmogorov constant (
 $C$) is also plotted using the compensated spectra,
 $C = E(k)k^{5/3}\epsilon ^{-2/3}$ at
 $y^+ = 15$, 50, and at the centre of the channel (for
 $y^+ = 150$ for
 $Re_b = 5600$ and
 $y^+ = 100$ for
 $Re_b = 3300$) for both the Reynolds numbers and different Stokes numbers, shown in figure 7(b–d). Figures 7(b) and 7(c) show that there is almost no variation in
 $C$ at
 $y^+ = 15$ and 50 for
 $Re_b = 5600$ and at
 $y^+ = 50$ for
 $Re_b = 3300$ for all the Stokes numbers. However, a non-monotonic variation is observed in
 $C$ for
 $Re_b = 3300$ at
 $y^+ = 15$. This is in contrast to the behaviour of the apparent Kolmogorov constant (
 $C_2$) obtained via second-order velocity structure function where a monotonic decrease in
 $C_2$ is observed with an increase in particle volume loading. Figure 7(d) shows that the value of
 $C$ decreases almost linearly from 1.3 to 0.4 for a change in
 $\phi$ from
 $2\times 10^{-4}$ to
 $2.7\times 10^{-3}$ for
 $Re_b = 5600$ and approximately to 0.8 at
 $\phi = 0.0011$ for
 $Re_b = 3300$. The observations from the second-order structure function and compensated spectra are consistent away from the wall (at
 $y^+ = 50$) and the channel centre region for both the Reynolds numbers and all the Stokes numbers reported here.
(a) Energy spectrum density at  $y^+ = 15$ and 50 for
 $Re_b = 5600$ compared with different DNS results for the unladen cases. The apparent Kolmogorov constant (
 $C$) plotted from compensated spectra for
 $Re_b = 3300$ and
 $5600$ at channel locations of (b)
 $y^+ = 15$, (c)
 $y^+ = 50$ and (d)
 $y^+ = 100$ for
 $Re_b = 3300$ and
 $y^+ = 150$ for
 $Re_b = 5600$. In panels (b–d), the symbols with lines are for
 $Re_b = 5600$, the symbols without the lines are for
 $Re_b = 3300$. The black and red dashed lines in panel (d) are the fitting curves for
 $Re_b = 5600$ and
 $Re_b = 3300$, respectively.

The larger decrease in the apparent Kolmogorov constant at the channel centre compared with the near-wall region with an increase in particle loading is associated with a higher decrease of  $Re_\lambda$, figure 2(c,d), and the ratio of the fluctuating velocity to the Kolmogorov velocity at the channel centre. The ratio of kinetic energy to the square of the Kolmogorov velocity scale is plotted as a function of the wall-normal direction in figure 8(a,b) for different particle volume loadings. It is observed that the ratio decreases faster in the channel centre than in the near-wall region with an increase in volume loading. It is worth noting that the maximum turbulence production happens near the wall, and the dissipation due to the particle is maximum at the channel centre (Muramulla et al. Reference Muramulla, Tyagi, Goswami and Kumaran2020). A decrease in the ratio of velocities signifies the reduction in scale separation of the large and the small scales; consequently, it will increase the small-scale anisotropy.
The ratio of fluctuating turbulent kinetic energy ( $k$) and square of Kolmogorov velocity scale (
 $u_k$) plotted across the channel width for different volume fractions. (a)
 $Re_b = 3300$,
 $St = 105.47$ and(b)
 ${Re_b = 5600}$,
 $St = 210.93$.

4. New modelling approach based on modified energetics
From the above analysis of the compensated spectra and second-order velocity structure function, it is observed that there is a non-monotonic decrease in the apparent Kolmogorov constant across the channel in the presence of dispersed particles. However, a significant variation of the apparent Kolmogorov constant, especially in the channel centre, happens constantly with an increase in particle volume loading. This observation can be used to model the effect of particles on the fluid phase without actually adding the discrete solid phase. The use of the Kolmogorov constant appears in the classical Smagorinsky model (Smagorinsky Reference Smagorinsky1963). In the Smagorinsky model (LES approach), the eddy viscosity term models the subgrid-scale dissipation. This eddy viscosity is represented in terms of Smagorinsky coefficient which is calculated from the Kolmogorov constant (Sagaut Reference Sagaut2006). The filtered continuity and momentum equations for LES are written as
 $$\begin{gather} \frac{\partial \tilde{\boldsymbol{u}}_i}{\partial \boldsymbol{x}_i}=0, \end{gather}$$
 $$\begin{gather}
\frac{\partial \tilde{\boldsymbol{u}}_i}{\partial t} + \frac{\partial
\tilde{\boldsymbol{u}}_i\tilde{\boldsymbol{u}}_j}{\partial
\boldsymbol{x}_j} ={-} \frac{1}{\rho_f} \frac{\partial
\tilde{p}}{\partial \boldsymbol{x}_i} + {\nu}
\frac{\partial^2 \tilde{\boldsymbol{u}}_i}{\partial
\boldsymbol{x}_j \partial \boldsymbol{x}_j } +
\frac{\partial (\tilde{\boldsymbol{u}}_i \tilde{\boldsymbol{u}}_j - \widetilde{\boldsymbol{u}_i \boldsymbol{u}_j})}{\partial \boldsymbol{x}_j}.
\end{gather}$$
Here,  $\tilde {p}$ is the filtered pressure,
 $\tilde {\boldsymbol {u}}_i$ is the filtered velocity,
 $\nu$ is the kinematic viscosity and
 $\rho _f$ is the fluid density. The subgrid scale (SGS) stress term, (
 $\tilde{\boldsymbol {u}}_i \tilde {\boldsymbol {u}}_j - \widetilde {\boldsymbol {u}_i \boldsymbol {u}_j}$), in the Smagorinksy model is expressed as
 $$\begin{gather} -\boldsymbol{\tau}_{ij} = \tilde{\boldsymbol{u}}_i \tilde{\boldsymbol{u}}_j - \widetilde{\boldsymbol{u}_i \boldsymbol{u}_j} = 2 \nu_t \tilde{\boldsymbol{S}}_{ij}, \end{gather}$$
 $$\begin{gather}\tilde{\boldsymbol{S}}_{ij} = \frac{1}{2} \left[ \frac{\partial \tilde{\boldsymbol{u}}_i }{ \partial \boldsymbol{x}_j} + \frac{\partial \tilde{\boldsymbol{u}}_j }{ \partial \boldsymbol{x}_i} \right], \end{gather}$$
where  $\nu _t$ is the eddy viscosity and
 $\tilde {\boldsymbol {S}}_{ij}$ is the filtered strain rate tensor. The eddy viscosity is written as
 $$\begin{gather} \nu_t = (C_s \tilde{\triangle})^2 |\tilde{S}| , \end{gather}$$
 $$\begin{gather}|\tilde{S}| = \sqrt{2 \tilde{\boldsymbol{S}}_{ij} \tilde{\boldsymbol{S}}_{ij}}. \end{gather}$$
In (4.5),  $C_s$ is the Smagorinsky coefficient,
 $|\tilde {S}|$ is the magnitude of the strain rate and
 $\tilde {\triangle } = (\tilde {\triangle }_1 \tilde {\triangle }_2 \tilde {\triangle }_3 )^{1/3}$ is the cube-root volume of the grid size. Here,
 $\tilde {\triangle }_1$,
 $\tilde {\triangle }_2$ and
 $\tilde {\triangle }_3$ are the grid spacing in the
 $x$,
 $y$ and
 $z$ directions, respectively. The relation between the Kolmogorov constant and the Smagorinsky coefficient is given as (Sagaut Reference Sagaut2006)
 \begin{equation} C_s = \frac{0.23}{C^{3/4}}.\end{equation}
Therefore, the variation of the Kolmogorov constant ( $C$) causes a modification in the Smagorinsky coefficient
 $C_s$. The apparent Kolmogorov constant decreases with an increase in the particle volume loading, which results in an increased
 $C_s$. Thus, the simulations are performed for single-phase flow with higher
 $C_s$ values for the Smagorinsky model without adding the particles. In this context, it is worth noting the earlier work of Yeo et al. (Reference Yeo, Dong, Climent and Maxey2010) who performed the fully resolved simulation for bubbles, neutrally buoyant and inertial particles in homogenous turbulence, and commented on the possibility of representing the particle feedback effect with an additional effective viscosity.
The present exercise aims to capture the effect of particles using a single-phase simulation by varying the Smagorinsky coefficient without adding the particles to the system. Although we have observed that the variation of the apparent Kolmogorov constant is a function of wall-normal location, as a first approximation, we consider a single Kolmogorov constant approximation across the channel as a function of particle concentration. Use of a uniform concentration across the channel would be a good assumption for the range of Stokes number used here, which is also evident from the DNS results, shown later. It should be noted that the particles increase the anisotropy across the fluid fluctuations and an anisotropic inhomogeneous modelling approach should be taken to model the fluid phase accurately, which is left as a future scope. However, the present method of modelling the dynamics of the fluid phase in a two-phase flow using a single-phase simulation is computationally less expensive. It provides insights into the mechanism of turbulence modulation. Simulations are performed with the Smagorinksy model which has been used in our earlier work (Rohilla et al. Reference Rohilla, Muramulla and Goswami2022). The number of grids used is  $128\times 65\times 64$ and
 $64\times 65\times 32$ in the streamwise (
 $x$), wall-normal (
 $y$) and spanwise (
 $z$) directions for bulk Reynolds numbers of 5600 and 3300. Here,
 $C_s = 0.125$ is used in the unladen flow simulations and the Van Driest damping is implemented to avoid high dissipation in the near-wall region (Rohilla et al. Reference Rohilla, Muramulla and Goswami2022).
First, we have increased the value of  $C_s$ in LES to determine the effect of
 $C_s$ on the fluid phase fluctuations. Then, we have presented the variation of second moments of fluctuation simultaneously as a function of
 $C_s$ and particle volume loading (
 $\phi _{av}$). In figure 9, the temporal evolution of the normalized sum of the fluid fluctuations is plotted for
 $Re_b = 5600$ with different
 $C_s$ values. The simulation with a lower
 $C_s$ value reaches a stationary state quickly. For high
 $C_s$ such as 0.30, the sum decreases initially and reaches the stationary state after a long time. For
 $C_s = 0.35$ and higher values, the sum of fluid fluctuations continuously decreases, representing a decay of the intensity of fluid turbulence. In figure 10, the profiles of fluid fluctuations are plotted along the wall-normal direction for a range of
 $C_s$. It is observed that the streamwise fluid fluctuations initially increase with an increase in
 $C_s$, and a sudden decrease happens at
 $C_s = 0.35$. However, a continuous decrease is observed for Reynolds stress, wall-normal and spanwise fluid velocity fluctuations, and a complete collapse of turbulence is observed at
 $C_s = 0.35$. As the transverse fluctuations are decreased, there is a decrease in momentum flux. The non-monotonic behaviour in the streamwise fluid fluctuations has also been reported by Zhou et al. (Reference Zhou, Zhao, Huang and Xu2020) where the authors performed the DNS of particle-laden channel flow. An increase in the streamwise fluctuations was observed at a solid volume fraction of
 $1.8\times 10^{-4}$, and a decrease was observed with a further increase in volume fraction. The authors mentioned two competitive phenomena. First, the near-wall vortices become weaker, leading to the larger spacing between the streaks. This effect causes a decrease in streamwise fluctuations. However, in the second case, the streaks become more organized and aligned in the streamwise direction. This phenomenon increases the streamwise fluctuations. A continuous decrease in the wall-normal and spanwise fluctuations was observed by Zhou et al. (Reference Zhou, Zhao, Huang and Xu2020). In the present study, an increase in
 $C_s$ leads to an initial increase in the streamwise fluid fluctuations. Then, a sudden turbulence collapse is observed at a higher
 $C_s = 0.35$. It is to be noted that we have used a constant value of
 $C_s$ across the channel. A further analysis using inhomogeneous
 $C_s$ is expected to provide more quantitative modulation of fluid turbulence. The present simulation shows a monotonic decrease in the Reynolds stress, wall-normal and spanwise fluid fluctuations (figure 10b–d), as reported by DNS studies (Li et al. Reference Li, McLaughlin, Kontomaris and Portela2001; Vreman Reference Vreman2015; Muramulla et al. Reference Muramulla, Tyagi, Goswami and Kumaran2020; Zhou et al. Reference Zhou, Zhao, Huang and Xu2020).
The average of fluid fluctuations (normalized with the  $t^* = 200$ value) across the channel evolved over the time for a range of
 $C_s$. The
 $t^*$ is normalized with channel width and fluid bulk velocity.

The profiles of fluid fluctuations in the wall-normal direction. The simulations are performed with Smagorinksy model with increasing Smagorinsky coefficient ( $C_s$) for
 $Re_b = 5600$. (a) Streamwise fluctuations, (b) wall-normal fluctuations, (c) Reynolds stress and (d) spanwise fluctuations. The symbols in panels (b–d) are the same as those in panel (a).

Figure 10 shows that the Reynolds stress and other components of fluctuations are a strong function of wall-normal distance. Therefore, we define the channel-averaged second moments of velocity fluctuations (4.8) and present the effect of variation of  $C_s$:
 \begin{equation} \langle \star \rangle_s = \frac{1}{\delta} \int_{0}^{\delta} {{\rm d} y} \langle \star \rangle.\end{equation}
Here,  $\langle \star \rangle _s$ is the averaged quantity over half-channel width (
 $\delta$). The average fluid fluctuations across the channel as a function of
 $C_s$ are plotted in figure 11(b,d) for both the Reynolds numbers. For DNS, the average fluid fluctuations as a function of
 $\phi _{av}$ for both the Reynolds numbers are shown in figure 11(a,c). The Stokes numbers considered are 105.47 and 210.93 for
 $Re_b = 3300$ and 5600, respectively, for DNS. The average fluid fluctuations decreases with an increase in particle volume fraction, and a complete turbulence collapse is observed at
 $\phi _{av} = 10^{-3}$ and
 $2.8\times 10^{-3}$ for
 $Re_b = 3300$ and 5600, respectively, shown in figure 11(a,c). It is observed that the fluid fluctuations, except the streamwise fluctuations, decrease with an increase in
 $C_s$ value, and a drastic collapse of more than one order of magnitude is observed at
 $C_s = 0.20$ for
 $Re_b = 3300$ and at
 $C_s = 0.35$ for
 $Re_b = 5600$, shown in figure 11(b,d). The decrease in Reynolds stress, wall-normal and spanwise fluctuations (figure 11b,d) with an increase in
 $C_s$ is similar to the decrease observed for DNS (figure 11a,c). The complete turbulence collapse observed in fluid fluctuations is similar to the collapse observed for particle-laden cases by Mito & Hanratty (Reference Mito and Hanratty2006), Shringarpure et al. (Reference Shringarpure, Cantero and Balachandar2012), Capecelatro et al. (Reference Capecelatro, Desjardins and Fox2018), Kumaran et al. (Reference Kumaran, Muramulla, Tyagi and Goswami2020), Duque-Daza et al. (Reference Duque-Daza, Ramirez-Pastran and Lain2021), Muramulla et al. (Reference Muramulla, Tyagi, Goswami and Kumaran2020) and Rohilla et al. (Reference Rohilla, Muramulla and Goswami2022). However, once turbulence is collapsed, the fluid fluctuations do not remain constant or increase as happens in the case of particle-laden cases due to particle-induced fluctuations (Capecelatro et al. Reference Capecelatro, Desjardins and Fox2018; Kumaran et al. Reference Kumaran, Muramulla, Tyagi and Goswami2020; Yu et al. Reference Yu, Xia, Guo and Lin2021). The volume fractions (
 $\phi _{eq}$) which correspond to different
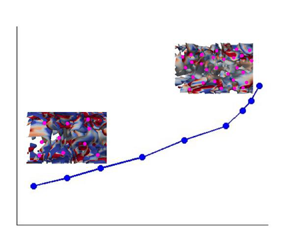
 $C_s$ values are plotted in figure 12, where fluid fluctuations (shown in figure 11) predicted by Smagorinksy model are compared with DNS. The Kolmogorov constant, computed using the second-order velocity structure function and compensated spectra, is found to decrease linearly in the channel centre location, shown in figures 6(b) and 7(d). The equivalence between the
 $C_s$ (used as the Smagorinsky coefficient) and the particle volume loading has been derived as follows. From the value of
 $C_s$ (0.125) used for the unladen flow,
 $C$ is calculated using (4.7). It is assumed that the variation of
 $C$ as a function of
 $\phi _{av}$ follows the same functional form as that of
 $C_2$ versus
 $\phi _{av}$, shown in figure 6(b). Therefore, we can estimate
 $C$ and
 $C_2$ for a range of particle volume loading (
 $\phi _{av}$). The equivalent volume fraction (
 $\phi _{eq}$) which corresponds to
 $C_s$ is plotted in figure 12 along with the average volume fraction (
 $\phi _{av}$). For
 $Re_b = 3300$ and 5600, the turbulence collapse was observed at
 $\phi _{av} = 10^{-3}$ and
 $2.8\times 10^{-3}$ , respectively, for particle-laden DNS (Muramulla et al. Reference Muramulla, Tyagi, Goswami and Kumaran2020). However, the turbulence collapse for the present simulations is observed at
 $\phi _{eq} = 1.4\times 10^{-3}$ and
 $3.2\times 10^{-3}$ for
 $Re_b = 3300$ and 5600, which is very close the critical loading predicted by DNS.
The average fluid fluctuations normalized with fluid bulk velocity ( $\bar {u}$) in (a,b)
 $Re_b = 3300$ and (c,d)
 $Re_b = 5600$. (a,c) The average fluid fluctuations are shown for particle-laden DNS (Muramulla et al. Reference Muramulla, Tyagi, Goswami and Kumaran2020). (b,d) The average fluid fluctuations are shown for the Smagorinksy model over a range of Smagorinsky coefficient (
 $C_s$). The dashed lines with closed symbols are for the Smagorinksy model and the dashed lines with open symbols are for the DNS. The legend is as follows: black line, streamwise; red line, Reynolds stress; blue line: wall-normal; and magenta line, spanwise fluctuations.

The average fluid fluctuations (shown in figure 11) for the Smagorinsky model and DNS are compared in (a,b)  $Re_b = 3300$ and (c,d)
 $Re_b = 5600$. Here,
 $C_s$ is represented in terms of equivalent volume fraction (
 $\phi _{eq}$). (a,c) Streamwise fluid fluctuations and (b,d): cross-stream, wall-normal and spanwise fluid fluctuations. The dashed lines with closed symbols are for the Smagorinksy model and the dashed lines with open symbols are for the DNS. The legend is as follows: black line, streamwise; red line, Reynolds stress; blue line, wall-normal; and magenta line, spanwise fluctuations.

In the present study, an attempt is made to capture the effect of change in particle volume loading in a two-phase flow by a fluid phase only simulation with a modified Smagorinsky coefficient. Therefore, it is expected that the total dissipation caused by the viscous term and modified eddy viscosity term in the present simulation should be similar to the total dissipation by the mean viscous term and dissipation due to feedback force exerted by the particles. Therefore, we have compared the total dissipation predicted in these two cases. The kinetic energy balance equation of the mean fluid flow in the stationary state for the particle-laden flow can be described as
 \begin{align} &- {U}_x \frac{1}{\rho } \frac{\partial {P}}{\partial x} - \frac{\partial (\overline{{u_x^{'}} {u_y^{'}}} {U}_x)}{\partial y} + \overline{{u_x^{'}} {u_y^{'}}} \frac{\partial {U}_x}{\partial y} \nonumber\\ &\quad +\nu \frac{\partial}{\partial y} \left({U}_x \frac{\partial {U_x}}{\partial y}\right) - \nu \frac{\partial {U}_x}{\partial y} \frac{\partial {U}_x}{\partial y} - {U}_x \overline{ \frac{\rho_p f \phi_c}{ \rho_f \tau_p} ({u}_x - {v}_x) } = 0. \end{align}
Here,  ${P}$ is the mean pressure,
 ${u_i}$ is the instantaneous velocity,
 ${U}_x$ is the mean velocity and
 ${u'_i}$ is the fluctuating velocity. Additionally,
 $\rho _f \overline {{u^{'}_i} {u^{'}_j}}$ is the Reynold stress,
 $\tau _p$ is the particle relaxation time,
 $\phi _c$ is the volume fraction in the respective grid,
 $f$ is the drag coefficient,
 $\rho _p$ is the material density of the particle and
 $\rho _f$ is the fluid density. In (4.9), the first term is the energy due to pressure work, the second term is the divergence of energy fluxes due to Reynolds stress, the third term is the energy used for the turbulence production, the fourth term is the divergence of energy flux due to fluid viscous stress, the fifth term is the viscous dissipation (
 $\epsilon _m$) due to mean shear and the sixth term is the loss of energy due to the particle drag (
 $F_p$). The filtered mean kinetic energy equation for unladen fluid flow is written as
 \begin{align}
&- \tilde{U}_x \frac{1}{\rho } \frac{\partial
\tilde{P}}{\partial x} - \frac{\partial
(\overline{\widetilde{u_x^{'}} \widetilde{u_y^{'}}}
\tilde{U}_x)}{\partial y} + \overline{\widetilde{u_x^{'}}
\widetilde{u_y^{'}}} \frac{\partial (
\tilde{U}_x)}{\partial y}\nonumber\\
&\quad +(\nu +\nu_t)
\frac{\partial}{\partial y}\left(\tilde{U}_x \frac{\partial
\widetilde{U_x}}{\partial y}\right) - (\nu +\nu_t)
\frac{\partial \tilde{U}_x}{\partial y} \frac{\partial
\tilde{U}_x}{\partial y} =
0.\end{align}
Here,  $\tilde {P}$ is the mean filtered pressure,
 $\tilde {u}_i$ is the instantaneous filtered velocity,
 $\tilde {U}_x$ is the mean filtered velocity,
 $\widetilde {u'_i}$ is the filtered fluctuating velocity and
 $\rho _f \overline {\widetilde {u^{'}_i} \widetilde {u^{'}_j}}$ is the filtered Reynold stress. The terms in (4.10) are similar to those in (4.9) with filtered quantities. The dissipation in the mean kinetic energy equation (4.9) is caused by the last two terms, mean viscous dissipation and particle-induced dissipation. However, the dissipation in (4.10) is due to the last term which is due to molecular (
 $\epsilon _m$) and eddy viscosity (
 $\epsilon _{eddy}$). Thus, these two dissipation terms should be comparable to predict fluid phase dynamics accurately when a single-phase simulation supplants the two-phase simulation.
Figures 13(a) and 13(c) show the terms due to mean viscous dissipation, dissipation due to particle drag and input energy due to pressure work for particle-laden DNS cases (Rohilla et al. Reference Rohilla, Muramulla and Goswami2022). In figure 13(b,d), the Smagorinsky coefficient ( $C_s$) is varied, and input energy due to pressure work, the dissipation due to mean viscous and eddy viscosity are plotted using the Smagorinsky model for the unladen flow. It is observed that with an increase in
 $C_s$, the mean viscous dissipation decreases. However, the dissipation due to eddy viscosity increases. The dissipation due to particle feedback in figure 13(a,c) is comparable and shows a similar trend with the dissipation by the modified eddy viscous term in figure 13(b,d). Also, the total dissipation in the present unladen simulations is comparable to the total dissipation caused by the particle-laden DNS. It is to be noted that the total dissipation (mean viscous and particle induced dissipation) is almost constant in all the cases, which has also been reported previously (Rohilla et al. Reference Rohilla, Muramulla and Goswami2022). In the case of homogenous isotropic turbulence, it was observed by Squires & Eaton (Reference Squires and Eaton1990) that the total dissipation was constant for all the cases. For the mass loading of one, the decrease in the viscous dissipation was nearly
 $50\,\%$, and another
 $50\,\%$ dissipation was caused by the particles. A decrease in the input energy is observed for the particle-laden DNS, figure 13(a,c), and in the case of single-phase Smagorinsky simulations, figure 13(b). In figure 13(d), a decrease in the input energy is observed at a low value of
 $C_s$, and a non-monotonic variation is observed before the turbulence collapse. The difference between input energy and the total dissipation, which is used in the turbulence production, is plotted in figure 14, and is compared with DNS (Rohilla et al. Reference Rohilla, Muramulla and Goswami2022). Here,
 $C_s$ is represented in terms of equivalent volume fraction (
 $\phi _{eq}$). A decrease in the difference (
 $diff$) is observed with an increase in
 $\phi _{eq}$ for the low Reynolds number (
 $Re_b = 3300$). However, it is not monotonic at moderate Reynolds number (
 $Re_b = 5600$). A sudden collapse occurs at
 $\phi _{eq} = 0.0014$ and 0.0032 for
 $Re_b = 3300$ and 5600, respectively. The turbulence collapse happens at
 $\phi = 0.001$ and 0.0028 for DNS at
 $Re_b = 3300$ and 5600, respectively. The critical volume fraction predicted by the Smagorinsky model closely matches with DNS at both Reynolds numbers.
The terms from the mean kinetic energy equation are presented in (a)  $Re_b = 3300$,
 $St = 105.47$, (b)
 $Re_b = 3300$, (c)
 $Re_b = 5600$,
 $St$ = 210.93 and (d)
 $Re_b = 5600$. Panels (a,c) are particle-laden DNS cases where
 $\epsilon _m$ is the mean viscous dissipation,
 $F_{p,DNS}$ is the dissipation due to particles and
 $sum$ is the addition of feedback and mean viscous dissipation. Panels (b,d) are single-phase simulations where the Smagorinsky coefficient is varied,
 $\epsilon _m$ is the viscous dissipation at mean flow,
 $\epsilon _{eddy}$ is the dissipation due to eddy viscosity and
 $sum$ is the addition of eddy and viscous dissipation. Here,
 $IE$ is the input energy from pressure work.

Difference of input energy ( $IE$) and total dissipation (
 $sum$), which are plotted in figure 13,
 $diff = IE - sum$. (a)
 $Re_b = 3300$ and (b)
 $Re_b = 5600$. The subscripts are as S, Smagorinsky model and DNS, direct numerical simulation.

The feedback term from particle-laden DNS and eddy viscosity-based dissipation due to modified  $C_s$ from the Smagorinksy model is compared in figure 15. Here, the dissipation due to eddy viscosity for the unladen simulation (
 $\nu _t ({\rm d}\tilde {U}/{{\rm d} y})^2$ for the
 $C_s = 0.125$ case) is subtracted from the
 $F_{p}$ to depict the equivalent particle dissipation only. The feedback term in DNS is taken for
 $St = 105.47$ and 210.93 for
 $Re_b = 3300$ and 5600, respectively. The feedback term as a function of volume fraction (
 $\phi _{av}$) from particle-laden DNS and as a function of equivalent volume fraction (
 $\phi _{eq}$) is plotted from the Smagorinsky model. As the turbulence collapse happens at different
 $\phi _{av}$ and
 $\phi _{eq}$ values for particle-laden DNS and Smagorinsky coefficient (figure 12), the
 $\phi _{av}$ and
 $\phi _{eq}$ are divided by the
 $\phi _{av,cr}$ and
 $\phi _{eq,cr}$, which are the critical loadings for DNS and the Smagorinsky model, respectively, where turbulence collapse is observed. The Smagorinsky model predicts the feedback term and the trend with reasonable accuracy for both Reynolds numbers. For
 $Re_b = 3300$ in figure 15(a), the Smagorinsky model accurately predict the dissipation at low
 $\phi _{eq}$, but underpredicts particle dissipation near the
 $\phi _{eq,cr}$. In the case of moderate Reynolds number (
 $Re_b = 5600$), the prediction by the Smagorinksy model matches with DNS, figure 15(b). In the case of the Smagorinsky model, it is to be noted that particles act as a source/sink in particle-laden cases depending on the local relative velocity. However, in the case of modified average
 $C_s$, it will be a dissipative effect only. Therefore, further analysis is required so that
 $C_s$ can be expressed as a function of Reynolds number, Stokes number and wall-normal distance to capture the effect of particles more accurately. This will be an interesting future scope.
The dissipation term in DNS due to particles and an equivalent dissipation in the Smagorinksy model due to modified  $C_s$ are compared. Here,
 $C_s$ is represented in terms of equivalent volume fraction (
 $\phi _{eq}$). (a)
 $Re_b = 3300$ and (b)
 $Re_b = 5600$. The volume fraction (
 $\phi _{av}$ or
 $\phi _{eq}$) is normalized with a critical volume fraction at which turbulence collapse is observed in individual cases.

The mean velocity, the gradient of mean velocity and the pressure gradient across the channel are plotted in figure 16. The plots are shown for the simulations performed with the Smagorinsky model with varying  $C_s$ for
 $Re_b = 5600$, and the particle-laden DNS for
 $Re_b = 5600$ and
 $St = 210.93$. The mean velocity profiles in figure 16(a,b) show that the mean velocity decreases in the buffer region and increases in the channel centre with an increase in
 $C_s$. However, the extent of decreases predicted by modified
 $C_s$ is more than that predicted by DNS, shown in figure 16(b). In the case of the mean velocity gradient, a significant decrease is observed in the near-wall region for the Smagorinsky model (figure 16c) compared with the DNS case (figure 16d). The Smagorinksy model captures the qualitative behaviour of the pressure gradient, which is observed in particle-laden DNS, figure 16(e). Here,
 $C_s$ is denoted in terms of the equivalent volume fraction (
 $\phi _{eq}$). Thus, the variation of
 $C_s$ in the Smagorinksy model captures the effect of particles qualitatively, and further analysis will lead to new LES models in the future.
The streamwise mean velocity (a) for  $Re_b = 5600$, (b)
 $Re_b = 5600$,
 $St = 210.93$, mean velocity gradient (c) for
 $Re_b = 5600$, (d)
 $Re_b = 5600$,
 $St = 210.93$, and pressure gradient (e) for
 $Re_b = 5600$. The streamwise velocity in panels (a,b) are normalized with unladen frictional velocity (
 $u_\tau$). The mean velocity and pressure gradient in panels (c–e) are normalized with fluid bulk velocity and channel width. In panels (a,c), the simulations are performed with different
 $C_s$ for the Smagorinsky model. Panels (b,d) show the results from particle-laden DNS for
 $St = 210.93$. The pressure gradient for a range of
 $\phi _{av}$ and
 $\phi _{eq}$ is compared in panel (e) where the legend is S, Smagorinsky model and DNS, direct numerical simulation.

The particle statistics are also presented for both the Reynolds numbers, as shown in figures 17 and 18. It is worth noting that the simulations to predict the particle properties are performed as one-way coupling. Modulation of fluid properties due to the presence of particles is embedded in our new modelling technique through the modified eddy viscosity term. The particle mean velocities predicted by LES match well with the DNS results for a range of volume fractions and the velocity profiles are flat across the channel width, as shown in figure 17(a) for  $Re_b = 3300$. The unladen mean fluid velocity for DNS is also plotted. It is observed that the particles lead the fluid in the near-wall region while lag in the channel centre. The particle fluctuations scaled with averaged fluid velocity fluctuation are plotted in figure 17(b,c). The streamwise particle fluctuations are higher near the wall and decrease away from the wall. The wall-normal particle fluctuations are flat across the channel width. The streamwise velocity fluctuation decreases, while wall-normal fluctuations increases as the solid loading is increased. This happens due to increased particle collision frequency and the transfer of momentum from the streamwise direction to the other directions. The relative particle fluctuations predicted by the modified Smagorinsky model (present model) deviate by a maximum of 20 % compared with the DNS results for lower volume fractions. Near the critical loading, the deviation increases as the DNS predicted fluid fluctuation is much lower than that predicted by the LES. The particle concentration scaled with the average value is plotted along the wall-normal direction. The normalized particle concentration profiles are almost flat across the channel width and the profiles predicted by the LES model agree well with the DNS results for a range of volume fractions, as shown in figure 17(d). For
 $Re_b = 5600$, the particle mean velocity profiles are also flat for a range of volume fractions, and the modified-Smagorinsky model predicts the mean velocities with a deviation of less than 3 % compared with the DNS results. For
 $Re_b = 5600$, a similar trend is observed for the particle velocity fluctuations as for
 $Re_b = 3300$ (figure 18). A maximum deviation of
 $20\,\%$ is observed. The scaled particle concentration profiles are almost flat and are in good agreement with DNS. The results for the prediction of second moments of particle velocity fluctuations may be improved if an inhomogeneity and Stokes number dependence are included in the
 $C_s$ prediction.
The particle properties are plotted in the wall-normal direction for  $Re_b = 3300$ and
 $St = 105.47$. The particle mean velocities (
 $\bar {v}_x$) are scaled with fluid bulk velocity (
 $\bar {u}$), the particle fluctuations are scaled by average fluid fluctuations and the wall-normal distance is scaled with channel half-width (
 $\delta$). The
 $\phi _{eq}$ for the Smagorinsky model is represented by
 $\phi$ itself in the legends. (a) Mean velocity, (b) root mean square of streamwise, (c) wall-normal fluctuations and (d) particle concentration. The particle concentration is normalized with an average concentration across the channel width. Unladen DNS in panel (a) shows the unladen fluid mean velocity for DNS. The legend in panel (c) is the same as that in panel (b).

Particle properties plotted in the wall-normal direction for  $Re_b = 5600$ and St = 210.93. The particle mean velocities (
 $\bar {v}_x$) are scaled with fluid bulk velocity (
 $\bar {u}$), the particle fluctuations are scaled by average fluid fluctuations and wall-normal distance is scaled with channel half-width (
 $\delta$). The
 $\phi _{eq}$ for the Smagorinsky model is represented by
 $\phi$ itself in the legends. (a) Mean velocity, (b) root mean square of streamwise,(c) wall-normal fluctuations and (d) particle concentration. The particle concentration is normalized with an average concentration across the channel width. Unladen DNS in panel (a) shows the unladen fluid mean velocity for DNS.

5. Conclusions
Direct numerical simulations are performed for particle-laden turbulent channel flows at two bulk Reynolds numbers and different Stokes numbers over a range of particle volume fractions. It is observed that the local isotropy of small and large scales decreases with an increase in particle volume loading. We report the variation of the apparent Kolmogorov constant with an increase in volume loading at low and moderate Reynolds numbers due to an increase in anisotropy of fluid velocity fluctuations. In the near-wall region ( $y^+ = 15$), a decrease in the apparent Kolmogorov constant is observed when estimated via the second-order velocity structure function, while it remains unaltered if estimated using the compensated energy spectrum. Both analyses show no variation in the apparent Kolmogorov constant at
 $y^+ = 50$. Additionally, an almost linear decrease in the apparent Kolmogorov constant is observed in the channel centre region for the considered Reynolds numbers and Stokes numbers. The Kolmogorov constant increases from the wall to the channel centre for unladen wall-bounded flows. However, the present study reveals that in the case of particle-laden flows, the apparent Kolmogorov constant at the channel centre is lower than that at the near-wall region (
 $y^+ = 15$) for a high volume fraction. Thus, from the present study, it can be concluded that the apparent Kolmogorov constant for turbulent channel flows is not only a function of wall-normal location but also a function of particle volume loading.
The present analysis highlights two important points related to modelling particle-laden turbulent flows. First, the increase in local anisotropy of fluid fluctuations with an increase in particle loading depicts that inhomogenous anisotropic models will be a better choice to capture the dynamics of particle-laden turbulent flows at high particle volume loadings. Second, the variation of the apparent Kolmogorov constant as a function of particle volume fraction is to be considered to predict fluid phase dynamics. In the proposed modelling approach, the variation of the Smagorinsky coefficient is estimated from the variation of the Kolmogorov constant. The simulations are performed to predict the dynamics of the fluid phase without solving the particle phase equations simultaneously. The new method captures the qualitative trend of turbulence attenuation and the sudden collapse of turbulence similar to the behaviour observed for particle-laden turbulent flows. However, the model quantitatively shows some deficiency in capturing the fluid phase fluctuations and equivalent particle feedback dissipation. This happens as the Smagorinsky model is based on isotropic scalar eddy viscosity formulation. Development of an anisotropic eddy viscosity model as a function of particle loading, Stokes number, etc., will be an interesting future scope. It is worth mentioning that the present study is conducted at low and moderate Reynolds numbers. Nevertheless, the demonstrated variations of the apparent Kolmogorov constant in the case of low-Reynolds-number particle-laden turbulent flows will be helpful in developing better turbulence models in LES and the stochastic modelling approach.
Funding
The authors would like to thank the Department of Science and Technology (DST), Government of India for financial support. N.R. would like to thank Industrial Research and Consultancy Centre (IRCC), IIT Bombay, for support through a partial doctoral fellowship.
Declaration of interests
The authors report no conflict of interest.


 Open access

