Introduction
When elite interests in state legislatures blocked policy attempts to address working-class issues around the turn of the twentieth century, progressive reformers pushed direct democracy as an alternative means to achieve their policy goals. States with stronger economic elites were more likely to stifle these political reform efforts, while states with weaker elite interests were more likely to adopt the tools of direct democracy (Hill and Klarner Reference Hill and Klarner2002). In the latter states, progressive reformers believed that the initiative process, in particular, would put pressure on state legislatures to be more responsive to their constituents’ views. In the face of a recalcitrant legislature not acting in the interests of the people, the initiative process would allow “ordinary citizens” an opportunity to bypass the legislature and take pressing policy issues directly to voters.
Although originally adopted to circumvent entrenched elite powers in state legislatures, the initiative process was later viewed as a potential alternative to legislative stalemates. Throughout the latter half of the twentieth century and into the twenty-first, divided government became a more frequent phenomenon in the American states (Fiorina Reference Fiorina1996). Policy gridlock produced by divided government decreased the likelihood that the two major parties could reach compromise on solutions to the state’s problems (Clarke Reference Clarke1998; Kousser Reference Kousser2010). A steady stream of scholarship confirms that divided government and gridlock are key factors behind more frequent initiative use in recent decades (Banducci Reference Banducci, Bowler, Donovan and Tolbert1998; Boehmke Reference Boehmke2005a; Cummins Reference Cummins2018; Damore, Bowler, and Nicholson Reference Damore, Bowler and Nicholson2012; Gerber Reference Gerber1996; Magleby Reference Magleby1984; McGrath Reference McGrath2011). While this suggests that initiatives can help bypass an unresponsive legislature, it does not speak to whether they serve as a successful pathway around the normal legislative process. To function as a successful end-run around the legislature, we should expect initiatives to be relatively successful under periods of divided government, but little research has examined this question.
Moreover, in addition to divided government, party polarization has increasingly been recognized as a major impediment to political compromises (McCarty, Poole, and Rosenthal Reference McCarty, Poole and Rosenthal2008; Shor and McCarty Reference Shor and McCarty2011). For several decades, the two major parties have drifted further and further apart ideologically making it more difficult for either party to pry members of the opposing party to their side when additional votes are necessary to pass legislation. Like divided government, this polarization also contributes to policy gridlock and pushes interest groups toward the initiative process (Boehmke, Osborn, and Schilling Reference Boehmke, Osborn and Schilling2015; Cummins Reference Cummins2018). Again, the assumption here for policy advocates is that using the initiative process as an alternative will lead to the desired results. However, party polarization among policymakers is likely a reflection of a polarized electorate (Jacobson Reference Jacobson2004), so issues that encounter too much resistance in the legislative environment may suffer a similar fate at the ballot box.
This article tests whether state ballot initiatives are less likely to be approved by voters in a divided and polarized setting. Does divided government and party polarization in state legislatures lead to greater voter opposition to initiatives? To answer this question, we analyze data on all California initiatives from 1912 to 2020 to determine whether these measures are more or less likely to be adopted when there is divided government and higher levels of party polarization. We focus our efforts on California’s initiative process because the state is among the most frequent users of the initiative and much of the existing scholarship on initiatives examines California.
This article has important implications for the study of initiatives in state policymaking and challenges one of the key assumptions motivating initiative use. First, several studies suggest that interest groups turn to ballot initiatives when divided government and party polarization incapacitate state legislatures (Banducci Reference Banducci, Bowler, Donovan and Tolbert1998; Boehmke, Osborn, and Schilling Reference Boehmke, Osborn and Schilling2015; Cummins Reference Cummins2018; Damore, Bowler, and Nicholson Reference Damore, Bowler and Nicholson2012; Hicks Reference Hicks2013; but see McGrath Reference McGrath2011). This is a costly alternative, as initiative seekers must devote significant resources to signature gathering and a media campaign to pass the measure. A major assumption underlying this strategy is that a ballot measure has a decent chance of passage, or else advocates would not embark on such a costly endeavor. However, our research suggests that the probability of passage under unfavorable partisan conditions is rather low. In other words, the initiative process does not seem to be a fruitful alternative for policy advocates when their goals have already met resistance in a divided and polarized legislature.
Second, some scholarship suggests the impact of the initiative process does not have to come directly from the passage of an initiative, but that influence can emanate from the mere threat of its use (Boehmke Reference Boehmke2005b; Gerber Reference Gerber1996; Matsusaka and McCarty Reference Matsusaka and McCarty2001). These scholars conclude that this indirect threat compels policymakers to be more responsive to constituent views. Research as to whether this is the case has produced mixed results. Some studies find that policy outcomes more closely align with public opinion on certain issues in initiative states compared with non-initiative states (Arceneaux Reference Arceneaux2002; Gerber Reference Gerber1996; Matsusaka Reference Matsusaka2010). In contrast, more recent research shows that responsiveness to public opinion is not enhanced in initiative states (Caughey and Warshaw Reference Caughey and Warshaw2018; Lascher, Hagen, and Rochlin Reference Lascher, Hagen and Rochlin1996; Lax and Phillips Reference Lax and Phillips2012; Monogan, Gray, and Lowery Reference Monogan, Grary and Lowery2009). The research here partially addresses the discrepancy in these previous findings and supports the latter camp.
Research on initiative voting
There is a vast amount of scholarship on the impact of initiatives on policymaking, especially on fiscal outcomes (Matsusaka Reference Matsusaka2018). Much of it has focused on whether states with initiatives have different outcomes, such as lower spending or taxes, than non-initiative states. In his extensive summary of the literature, Matsusaka (Reference Matsusaka2018) concludes that initiative states have lower spending, taxes, and debt than non-initiative states. Other studies explore its impact on social policies, such as abortion, same-sex marriage, and the death penalty (Arceneaux Reference Arceneaux2002; Boehmke Reference Boehmke2005a; Reference Boehmke2005b; Gerber Reference Gerber1996; Lewis Reference Lewis2011). The general conclusion is that the initiative moves states toward the conservative position on social policy issues (Matsusaka Reference Matsusaka2018). It is important to note that the impact of the initiative on these policy outcomes is not from the passage of one particular measure; rather, the influence arises from the option of using it. “…[T]he initiative and referendum matter simply by being available, even if they are not used” (Matsusaka Reference Matsusaka2018, 118). An assumption that emerges from these findings is that policymakers believe that the likelihood of an initiative passing is relatively high or they would not need to change their voting behavior.
Aside from policy impacts, another body of literature on the initiative explores the factors that drive its use (Banducci Reference Banducci, Bowler, Donovan and Tolbert1998; Boehmke Reference Boehmke2005a; Reference Boehmke2005b; Damore, Bowler, and Nicholson Reference Damore, Bowler and Nicholson2012; Magleby Reference Magleby1984; McGrath Reference McGrath2011). Some of this research points to divided government as a central component behind initiative frequency (Banducci Reference Banducci, Bowler, Donovan and Tolbert1998; Boehmke Reference Boehmke2005a; Reference Boehmke2005b; Damore, Bowler, and Nicholson Reference Damore, Bowler and Nicholson2012; Magleby Reference Magleby1984; McGrath Reference McGrath2011). When divided government is present, the governor and legislature are less likely to agree on policy and budgetary matters (Cummins Reference Cummins2012; Kousser Reference Kousser2010), so advocates turn to the initiative process to secure their policy goals. More recent research adds the ideological makeup of the legislature (Boehmke, Osborn, and Schilling Reference Boehmke, Osborn and Schilling2015) and party polarization (Cummins Reference Cummins2018) to the variables that affect the number of initiatives on the ballot. What is important to take away from this subset of the literature is that policy advocates, often interest groups, employ the initiative process when the political environment in the legislature is hostile to their policy goals.
Still another strand of literature on the initiative analyzes voter support for them. Several studies conclude that partisanship is the most important factor in determining outcomes (Branton Reference Branton2003; Brunner, Ross, and Washington Reference Brunner, Ross and Washington2011; Franko, Tolbert, and Witko Reference Franko, Tolbert and Witko2013; Smith and Tolbert Reference Smith and Tolbert2001). Others have found that poor economic conditions lead to more negative voting (Bowler and Donovan Reference Bowler and Donovan1998), while positive conditions can reduce support for redistributive measures (Brunner, Ross, and Washington Reference Brunner, Ross and Washington2011). The largest subset of this scholarship has found mixed results on whether opposition spending is more effective than money spent by initiative supporters (Banducci Reference Banducci, Bowler, Donovan and Tolbert1998; de Figueiredo, Ji, and Kousser Reference de Figueiredo, Ji and Kousser2011; Lydenberg Reference Lydenberg1979; Magleby Reference Magleby1984; Mastro, Costlow, and Sanchez Reference Mastro, Costlow and Sanchez1980; Schmidt Reference Schmidt1989; Stratmann Reference Stratmann2005; Reference Stratmann2006). Notably missing from this literature on initiative voting behavior is how initiatives fare under the gridlocked conditions that may have helped propel them to the ballot in the first place.
Motivations behind initiative use
One of the main reasons several western states adopted the initiative process was to counteract unresponsive legislatures captured by the interests of the political parties and the dominant industry (Persily Reference Persily1997). In California, for example, the legislature was beholden to the Southern Pacific Railroad (SPR), which controlled public and commercial transportation routes. Although the initiative was advertised as a way for common citizens to partake in state policymaking, organized interests coopted the process from the start. To the present day, interest groups are viewed as the primary users of the process (Banducci Reference Banducci, Bowler, Donovan and Tolbert1998; Boehmke Reference Boehmke2005a; Gerber Reference Gerber1999).
Although divided government was infrequent around the time that states first adopted the initiative, its increasing presence in the latter half of the twentieth century and into the twenty-first became a central factor in initiative use. As bills became logjammed in the legislature from opposing parties controlling the executive and legislative branches, interest groups and policy entrepreneurs, including politicians themselves, viewed the initiative as another way to enact their policy goals. For example, Banducci (Reference Banducci, Bowler, Donovan and Tolbert1998) found that divided government increased initiative use across the states, while Cummins (Reference Cummins2018) suggests that it boosts certain types of fiscal initiatives in California. This previous research supports the notion that many sponsors believe their initiatives may have more success outside the normal legislative process or they would not devote substantial resources to its passage. This does not mean that all initiative sponsors are motivated by this assumption. Other research shows that sponsors may seek to drive up turnout for a party’s base (Childers and Binder Reference Childers and Binder2012) or candidates may seek to draw attention to their campaigns through the use of ballot measures (Nicholson Reference Nicholson2005). But advancing policy goals through successful ballot measure campaigns remains a key motivator behind initiative use.
We argue that the assumption the initiative process is a successful pathway around the legislative process under certain partisan conditions is false. Instead, we suggest that initiatives are less likely to pass in the presence of divided government. First, divided government likely represents competitive balance between the two parties since majorities elected a governor of one party and a legislative chamber or two from the opposite party. This implies that there is not overwhelming support for one party on salient issues. The lack of a clear consensus on which party voters want to govern them may indicate a lack of consensus on certain policy issues as well, which likely translates to issues that are put to voters in the form of initiatives. “To some degree, divided government in the United States probably reflects a lack of popular consensus about important issues…” (Fiorina Reference Fiorina1996, 5). Therefore, sponsors may face a higher level of uncertainty in a state with divided government.
It is important to note that divided government may still occur when voters overwhelmingly support certain policy positions. On some issues, such as the minimum wage or abortion protections, there may be popular consensus on these issues, but voters may support a party that they disagree with on that issue. However, voters may prioritize other issues that lack consensus when determining their party choice. Once these issues are rejected in the legislative process, policy advocates likely turn to the initiative process where that lack of popular consensus emerges once again at the ballot box.
Second, divided government provides signals that an initiative may face tough obstacles on the campaign trail. If initiative backers are seeking to bypass the legislature, then it is likely because there was not enough legislative support in one or both of the chambers, or the governor, of a different party, does not agree with the legislature. If the initiative qualifies, then the governor or legislators from a party opposing the initiative may provide cues to voters to defeat it (Burnett and Parry Reference Burnett and Parry2014; Lewkowicz Reference Lewkowicz2006; Lupia Reference Lupia1994).Footnote 1 The governor and legislators with allied groups and politicians may actively campaign to support or defeat it. “A substantial percentage of voters seem to learn facts about the proposed policies and the endorsements from trustworthy elites; indeed, many seem to use what they know to inform their decisions as well” (Burnett and McCubbins Reference Burnett and McCubbins2014, 27). For example, in California in 2008, Proposition 4 sponsors made another attempt (they did so in 2006 too) to require parental notification for minors seeking abortions. Republican Governor Arnold Schwarzenegger endorsed the measure, while the Democratic Party, which controlled the legislature, opposed it. The measure lost narrowly 52 to 48 percent. Thus, divided government may presage how elites with opposing viewpoints may try to influence the outcome.
Third, if initiative sponsors attempted to pass a bill through the legislature and were unsuccessful, it is also likely that opponents had an effective lobbying strategy that reflects significant resources, which, in turn, may mean formidable fundraising potential to thwart an initiative campaign. Dyck and Pearson-Merkowitz (Reference Dyck and Pearson-Merkowitz2019) suggest that voters have a “built-in” negative bias toward ballot measures that is reinforced when negative campaign ads hit the airwaves. Once they do, there is strong evidence that opposition spending on initiatives has a significant impact on the vote (Banducci Reference Banducci, Bowler, Donovan and Tolbert1998; de Figueiredo, Ji, and Kousser Reference de Figueiredo, Ji and Kousser2011; Stratmann Reference Stratmann2005, Reference Stratmann2006). For the reasons outlined above, we hypothesize that voter opposition to initiatives will increase during periods of divided government.
Research has also shown that polarization has increased substantially in recent decades at both the state and the national level (McCarty, Poole, and Rosenthal Reference McCarty, Poole and Rosenthal2008; Shor and McCarty Reference Shor and McCarty2011), which means that legislators are less likely to cross-over vote. In addition, under a divided setting, a governor of one party and a legislative majority party of another are likely to be further apart on the ideological spectrum with higher levels of party polarization. At the same time that polarization has increased among elected officials, polarization has also increased in the electorate, particularly in California. “Thus, in California, as in the United States more generally, politicians’ increased partisan and ideological polarization is not a sign that these leaders and their activist allies have deserted ordinary voters. Politicians have grown more partisan, but so have the people who elect them” (Jacobson Reference Jacobson2004, 134). Since polarized elected officials have been unable to reach a compromise on a pending issue in the legislative process, it is unlikely that there is a strong consensus in the electorate either. The ideological conflict among state policymakers that led to the initiative attempt may be present in the electorate as well. Based on these reasons, we hypothesize that increases in party polarization, under a divided setting, will further erode support for initiatives.
Data and methodology
To test whether initiatives are less likely to pass under divided government and higher levels of party polarization, we employ data on all initiatives in California from 1912 to 2020 to estimate a base model. We then examine two subsets of the data. One subset, from 1976 to 2020, allows us to control for key variables that might influence support for initiatives. The second subset, 1993 to 2018, allows us to look at the interactive impact of party polarization. These subsets are used because of the limited availability of data for campaign finance (prior to 1976) and party polarization (prior to 1993) variables.
We use California as a case study because much of the previous research on initiatives focuses on California and it is one of the most prolific users of the initiative process, just behind Oregon (Donovan Reference Donovan and Qvortrup2014). The state also has low thresholds for qualifying an initiative for the ballot (5 percent of voters in last gubernatorial election for a statute and 8 percent for a Constitutional amendment), so end-runs around a gridlocked legislature are easier to attempt. “The popular initiative in California thus provides as close to a complete end-run around representative democracy as exists anywhere else in North America” (Donovan Reference Donovan and Qvortrup2014, 131). It also provides plenty of opportunities to determine whether initiative advocates are successful with their attempts.
We explore models that use all initiatives and models that separate out fiscal and non-fiscal initiatives. During much of the time period of our study, 1933 to 2010, a two-thirds majority was required to pass the state budget. This higher threshold may have forced policy advocates to turn to the initiative process more often on fiscal matters.
Dependent variable
The dependent variable is the percentage of voters who voted “no” on a given initiative (Banducci Reference Banducci, Bowler, Donovan and Tolbert1998; Bowler and Donovan Reference Bowler and Donovan1998; Fahey, Weissert, and Uttermark Reference Fahey, Weissert and Uttermark2018). As an alternative, we also used a dummy variable for whether the initiative passed or not (1 = passage). The results are largely the same with the alternative dependent variable and are shown in the Online Appendix.
To identify fiscal initiatives, we categorized all initiatives from 1912 to 2020 to determine whether they fell into four categories: (1) tax increase or decrease; (2) make it easier or harder to adopt taxes; (3) earmarks that set aside funding for a certain program (i.e., K-12 education); and (4) modifications to the budget process (i.e., change vote threshold for adopting a budget). If the initiative did any one of these four things, then it was coded as fiscal. If not, it was coded non-fiscal. The non-fiscal measures dealt with issues related to government and election administration, the regulation of the economy, crime and punishment, and social issues. Specific examples include initiatives on redistricting, term limits, the death penalty, rent control, abortion, and labor relations, among others.
Independent variables
The main independent variable of interest in the models is divided government. Descriptions, sources, and summary statistics for all variables are provided in Table 1. For divided government, we employ the conventional dummy variable where 1 equals divided government if one or both chambers are controlled by a party different than the governor’s. We also explored models where we created separate variables for divided executive-legislative branches and a split legislature to determine whether one type of divided government resulted in more voter opposition to initiatives. The results of these models did not show a strong difference between the two types and are provided in the Online Appendix.Footnote 2
Variable descriptions, sources, and summary statistics

We also examine whether party polarization further exacerbates the effects of divided government through an interaction term. For party polarization, we use the legislator ideology scores developed by Shor and McCarty (Reference Shor and McCarty2011). Specifically, we use the difference in party median scores in the lower chamber, the Assembly.Footnote 3
To further isolate the effects of our main variables of interest in the empirical models, we control for a number of factors that may influence initiative outcomes. First, it has been well documented that ballot order can affect support for initiatives (Banducci Reference Banducci, Bowler, Donovan and Tolbert1998). Those initiatives higher on the ballot stand a better chance of passing than those lower down the list. We expect higher values here to increase the percentage of voters casting no votes. To account for the impact of economic conditions, we include the state unemployment rate in the models. Due to a wealth effect, voters can be more supportive of initiatives when economic conditions are more positive. In this case, higher levels of unemployment should increase the “no” vote.Footnote 4
Another variable in the models captures the percentage change in the population (change from previous even-numbered year). Some have found that initiative use is a reflection of representatives who are out of touch with a changing population (Cummins Reference Cummins2018), so a growing population may be more supportive of initiative efforts. Support or opposition for initiatives may be driven by campaign spending. Although some research suggested that opposition spending was more effective than support spending, de Figueiredo, Ji, and Kousser (Reference de Figueiredo, Ji and Kousser2011) found more recently that the effects are roughly the same. We account for both sides’ spending in the models and, following convention, log oppose and support spending (Banducci Reference Banducci, Bowler, Donovan and Tolbert1998). Since the composition of the electorate is often different in a primary election than in a general, we include a dummy variable for primary election and expect that the more conservative voters that often turn out in primaries will decrease support for initiatives. Lastly, to capture trends in initiative use at certain times (e.g., late 1980s) and the trend toward more policy liberalism, we include a variable for each year an initiative was voted on. This mainly includes even-numbered years, but also accounts for a few special elections.Footnote 5
We use regressions to estimate the “no” vote for initiatives with robust standard errors to correct for any heteroscedasticity in the models. The first set of models in Table 3 shows base models with only the control variables that are available for the entire time period of 1912 to 2020. The second set of models in Table 4 displays regressions that include important control variables for campaign spending and economic conditions that are only available back to 1976. Table 5 shows the results for interactions between divided government and party polarization.
Results and analysis
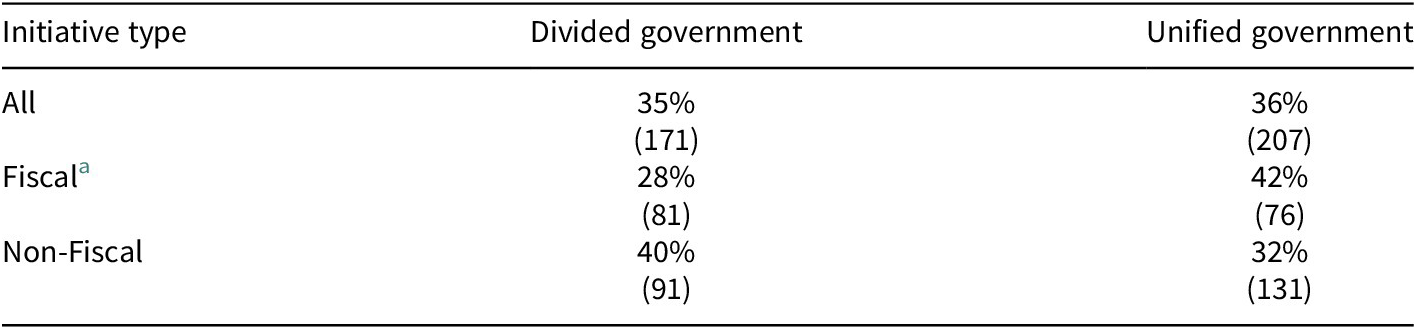
Before we proceed to the regression models, we show difference of means tests for initiative passage rates under unified and divided government for our three categories of measures. This allows us to see how initiatives fare under each configuration of government before accounting for other factors. These test results are shown in Table 2. For the test of All Initiatives, there is no significant difference between the passage rates for unified and divided government. Initiatives on the ballot under unified government passed at a slightly higher rate (36%) than those on the ballot during divided government (35%). However, there is a significant difference for Fiscal Initiatives. Only 28 percent of Fiscal Initiatives pass under periods of divided government, while 42 percent are approved under unified government. For Non-Fiscal Initiatives, there is a higher passage rate (40%) under divided government compared with unified government (32%), although the difference is not significant. These initial results suggest that fiscal initiatives face a more difficult electoral environment under divided government, but non-fiscal initiatives do not. Further analysis with the regression models helps to control for the electoral environment and further isolate the effects of divided government on initiative outcomes.
Initiative approval rates under unified and divided government, 1912–2020

Note: N for each cell is in parentheses.
a Significantly different at 10% level.
In Table 3, three models are shown with results for All Initiatives, Fiscal Initiatives, and Non-Fiscal Initiatives. Our main variable of interest, divided government, is significant and positive in two out of the three models. For All Initiatives, moving from unified government to divided increases the “no” vote by 3.6 percent. For Fiscal Initiatives, the impact is even stronger at nearly 7 percent. This finding means that voter support for initiatives, especially fiscal initiatives, goes down under periods of divided government. This time period includes the entire history of the initiative process in California, but does not allow us to control for key variables that may impact the vote. We turn to those models next. As for the control variables in the base models, ballot order is significant in two of the three models and population is significant in one of the three models. Initiatives further down on the ballot lose voter support, while changes in population growth increase support for fiscal initiatives.
Regression models for percentage voting “no” on initiatives, 1912–2020

Note: The dependent variable is the percentage of voters that voted “no” on the initiative. Robust standard errors are in parentheses.
a p < 0.01.
b p < 0.05 (one-tailed).
Table 4 shows results for more fully specified models that account for key control variables. This allows us to further isolate the effects of divided government and to have more confidence in its impact on initiatives. Divided government is again significant and positive in two out of the three models. The exception again is the model for Non-Fiscal Initiatives. The impact of divided government is similar to what it was in the models in Table 3. For the All Initiatives model, voter support decreases by a little over 2 percent, while it goes down nearly 8 percent for Fiscal Initiatives. These results support our hypothesis that voters would be less likely to support initiatives under divided government. We theorized that the opposing political forces in the legislative process that may have led policy advocates to the initiative process on a given issue may also reflect a lack of consensus among the electorate as well. Governors, legislators, and other political elites may provide voting cues that further sink an initiative. This thinking is reinforced by the results for the campaign spending variables. Five of the six coefficients for support and oppose spending are significant and pointed in the expected direction. Opposition spending is significant in more of the models than support spending and has a slightly larger impact, which aligns with some previous research (Lydenberg Reference Lydenberg1979; Magleby Reference Magleby1984; Mastro, Costlow, and Sanchez Reference Mastro, Costlow and Sanchez1980; Schmidt Reference Schmidt1989). Campaign spending could be viewed as an extension of elite cues since elites, including governors, help raise contributions and lead efforts for and against initiatives.
Regression models for percentage voting “no” on initiatives, 1976–2020

Note: The dependent variable is the percentage of voters that voted “no” on the initiative. Robust standard errors are in parentheses.
a p < 0.10 (one-tailed).
b p < 0.01.
c p < 0.05.
With regard to the remaining control variables, one surprising finding occurred for the economy. Higher unemployment significantly increased support for Fiscal Initiatives. We hypothesized that more positive economic conditions might make voters receptive to initiatives through a wealth effect. Instead, it appears that poor economic conditions may increase voter support for initiatives, but only on budgetary matters. Some of these initiatives may be solutions to budget problems that voters are willing to support.
Finally, we look at whether party polarization can exacerbate the effects of divided government on voter support for initiatives. In Table 5, we find pretty strong evidence that this is the case. These three models include a variable for party polarization in the legislature and an interaction term for divided government and party polarization. The interaction term is significant and positive in all three models. Under divided government, higher party polarization increases the percentage of the “no” vote. Recall that we suggested this would happen because the ideological divide between the executive and legislative branches would represent a divided electorate that cannot reach consensus on issues either.
Regression models for percentage voting “no” on initiatives, 1993–2018

Note: The dependent variable is the percentage of voters that voted “no” on the initiative. Robust standard errors are in parentheses.
a p < 0.10 (one-tailed).
b p < 0.01.
c p < 0.05.
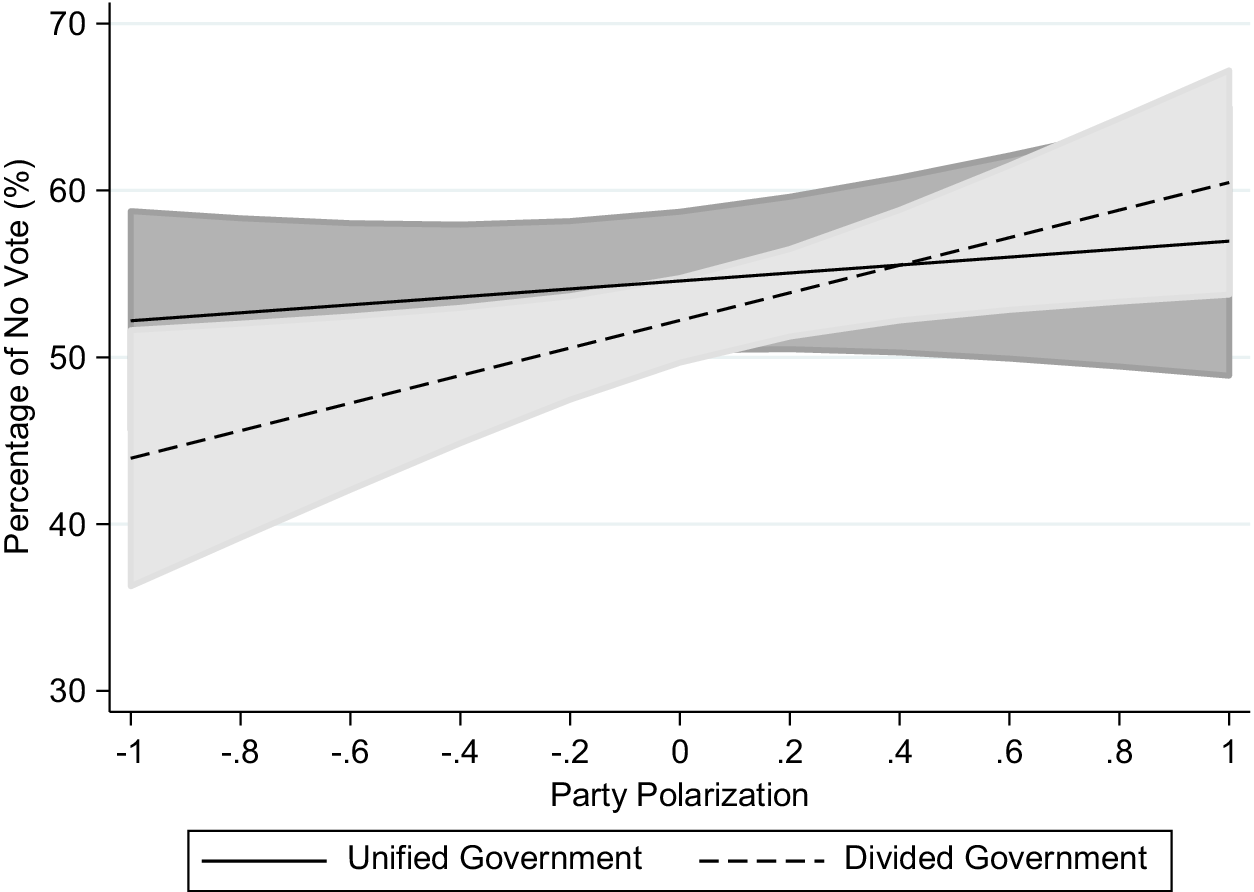
Figure 1 graphically displays the interactive effects of divided government and party polarization moving from one standard deviation below the mean of polarization to one standard deviation above it in the All Initiatives model. In a divided setting, and at low levels of party polarization (1 SD below the mean), the model estimates the percentage of the “no” vote at 44 percent, which is even lower than that under unified government. As polarization rises past its mean, the impact of divided government crosses unified government and results in a more severe decrease in voter support for initiatives. At high levels of polarization (1 SD above the mean) and in the presence of divided government, the model estimates a negative vote of 60 percent, which would defeat any initiative. Across the full range of values of party polarization, that is a total increase of 16 percent in the negative vote.
Marginal effect of polarization on percentage voting “no” under divided government, all initiatives, 1993–2018.
Note: Gray shading represents a 95 percent confidence interval. Range of Party Polarization is one standard deviation below the mean to one above it.

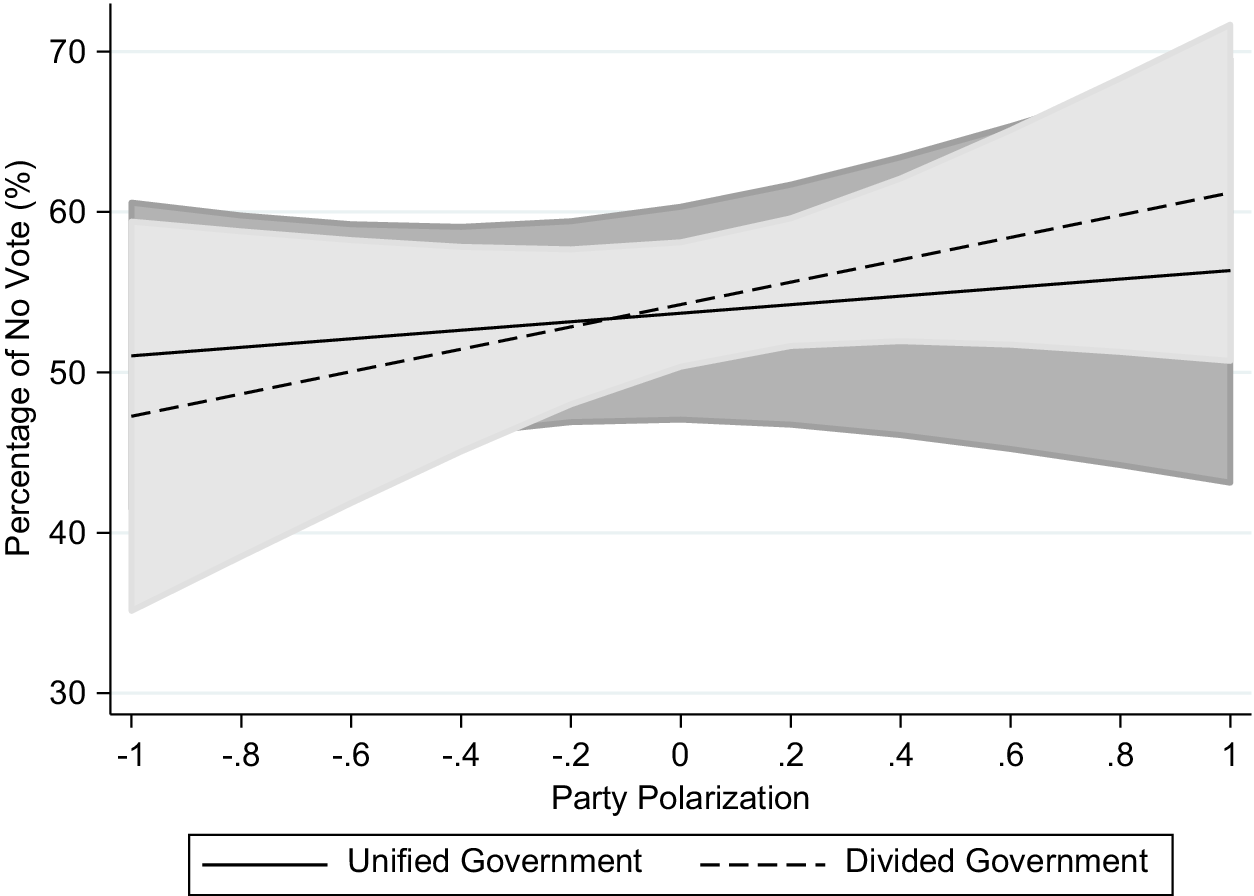
Figure 2 graphically shows the interactive effects of divided government and party polarization for the Fiscal Initiatives model. The impact across the full range of values is not quite as large as in the All Initiatives model, but still represents a sizable drop in voter support. At low levels of party polarization under divided government, the model estimates a 47-percent “no” vote. At high levels of party polarization with divided government, the “no” vote is estimated at 60 percent, which is a decline in voter support of 13 percent across the range of values.
Marginal effect of polarization on percentage voting “no” under divided government, fiscal initiatives, 1993–2018.
Note: Gray shading represents a 95 percent confidence interval. Range of Party Polarization is one standard deviation below the mean to one above it.

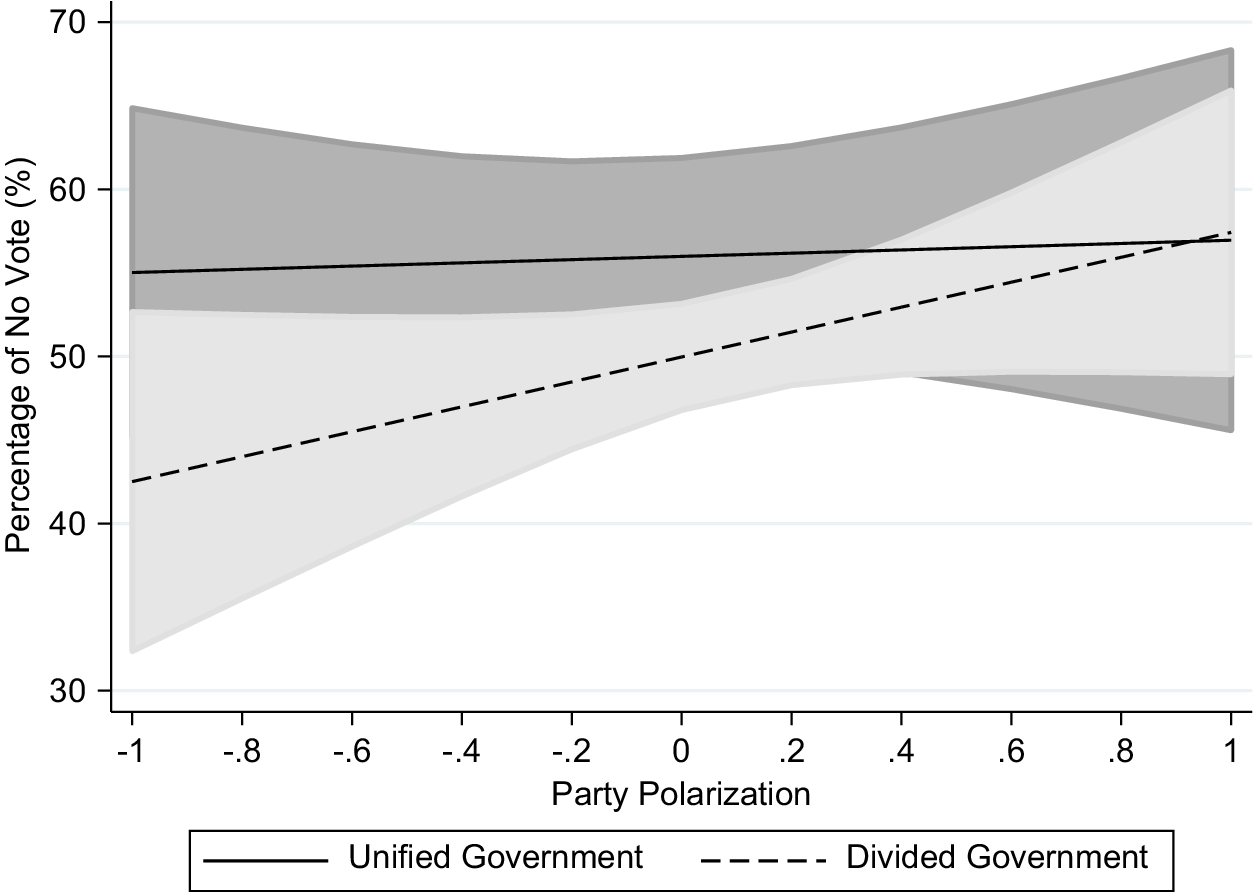
Figure 3 plots the estimates for the interactive effects for the Non-Fiscal Initiatives model. In the divided setting at low levels of party polarization, the model estimates a 43-percent “no” vote. This rises to 57 percent at high levels of party polarization, a 14-percent increase. This suggests that the combination of divided government and party polarization has a slightly smaller impact on the vote for non-fiscal initiatives than it does for fiscal initiatives.
Marginal effect of polarization on percentage voting “no” under divided government, non-fiscal initiatives, 1993–2018.
Note: Gray shading represents a 95 percent confidence interval. Range of Party Polarization is one standard deviation below the mean to one above it.

Robustness check
To assess whether the results hold up using a different dependent variable, we also estimated logistic regression models using a dummy variable for whether the initiative passed or not. These results are shown in the Online Appendix. We used the same models that are shown in Tables 3, 4, and 5. In the base models spanning the time period from 1912 to 2020, divided government is significant and negative in the Fiscal Initiatives model, but not the other two. As anticipated, divided government reduces the likelihood that an initiative passes. In the fully specified models controlling for campaign spending and the economy, divided government is significant and negative in only the Fiscal Initiatives model. Lastly, in the interactive models, the interactive term is significant and negative in both the All Initiatives model and the Non-Fiscal Initiatives model. As expected, under divided government, higher polarization decreases the chances that an initiative passes. Overall, the finding that divided government reduces support for initiatives holds with the alternative dependent variable, although, similar to the negative vote models, the findings are more consistent for the models with fiscal initiatives.
Discussion
A popular belief in political discourse is that policy advocates can turn to the initiative process in the states that have it when they do not get what they want from the legislature. This belief is built on a couple of strong assumptions. One is that the measure will qualify for the ballot. The second is that the measure has a relatively good chance of passing, or at least a better chance than it has in the legislature. However, the same conditions that led policy advocates to side-step the legislature and try their luck with the initiative may likely doom the initiative effort as well. In this article, we examine the second assumption above and test whether initiatives are likely to pass under the conditions that probably spawned the initiative effort in the first place.
Much of the scholarship on policy gridlock highlights how divided government and party polarization can obstruct the legislative process (Binder Reference Binder1999; Kousser Reference Kousser2010; Shor and McCarty Reference Shor and McCarty2011). Policymakers from different parties who rarely shirk the party line have a more difficult time finding compromises and producing legislation (although see Mayhew Reference Mayhew2005). Research on initiative use demonstrates that these are some of the conditions that drive policy advocates, mainly interest groups, to the initiative process (Banducci Reference Banducci, Bowler, Donovan and Tolbert1998; Boehmke, Osborn, and Schilling Reference Boehmke, Osborn and Schilling2015; Cummins Reference Cummins2018). Even the mere threat of an initiative may be enough to force policymakers to fashion legislation more to the liking of these initiative seekers as legislators seem to modify their voting behavior in states with the initiative compared to those without it (Arceneaux Reference Arceneaux2002; Gerber Reference Gerber1996; Reference Gerber1999; Matsusaka Reference Matsusaka2018). However, while there is evidence of the “gun behind the door” strategy, the proverbial gun may shoot more blanks than policy advocates and legislators realize. We find clear and consistent evidence that initiatives in California are less likely to pass under a divided and polarized setting.
The model estimates showed that voter support for initiatives declines under divided government and that this has occurred since the inception of the initiative process in 1912. The type of divided government, whether it is a split legislature or divided executive-legislative branches, did not seem to matter. The decline in voter support remained relatively consistent with a more recent subset of the data (1976–2020) that controlled for campaign spending and the economy, crucial factors that can influence initiative passage. The results seemed stronger for fiscal initiatives, but the models with both fiscal and non-fiscal initiatives displayed support for this relationship. Moreover, higher levels of party polarization further weaken voter support for initiatives under divided government and the evidence for this impact is strong for both fiscal and non-fiscal initiatives.
We theorize that the same conflict and lack of consensus that killed the legislation in the legislative process and that led initiative backers to the ballot box may resurface in the electorate. In other words, legislative conflict over the issue may signal that support among voters for an initiative is weak. The same logic applies in reverse for legislative referendums. They tend to have a much higher passage rate (74 percent according to Donovan (Reference Donovan and Qvortrup2014)), and this likely reflects the legislative consensus necessary to place them on the ballot. In California, for instance, it takes a two-thirds vote in the legislature to place measures on the ballot, so much of the opposition has already been placated before voters see the issue on their ballot. Legislative referendums also tend not to be hot-button issues that strike a chord with some segments of the electorate as an initiative might.
Our results, however, did indicate that divided government has a stronger negative effect on voter support for fiscal initiatives than it did for non-fiscal initiatives. What accounts for this difference? One possibility is that fiscal initiatives are more ideological than non-fiscal initiatives, so elite cues may be more clear to voters (Burnett and McCubbins Reference Burnett and McCubbins2014). For tax or spending measures on the ballot, elites may use simple messages espousing no new taxes or spending or that a tax cut would hurt social programs. Non-fiscal initiatives can be ideological too, such as those dealing with abortion or the death penalty, but may not be as often as fiscal initiatives. As noted above, many of the initiatives in the non-fiscal category concerned election or government administration, which tend to be non-ideological (e.g., term limits or campaign finance).
Moreover, some research suggests that non-fiscal initiatives may be more likely to be adopted under unified government because legislators do not want to alienate voters by supporting an unpopular law (Rugeley, Frendreis, and Tatalovich Reference Rugeley, Frendreis and Tatalovich2021; Schildkraut Reference Schildkraut2001). Rugeley, Frendreis, and Tatalovich (Reference Rugeley, Frendreis and Tatalovich2021) found medical marijuana laws were more likely to be adopted in states with the initiative process and unified Republican government. Despite the popular notion that the initiative process can help bypass divided government, their work and the findings in this study suggest that the initiative process may be a more successful path around the legislature during unified government on some issues.
The research presented here speaks to the debate about whether legislators in initiative states are more responsive to citizen views than their counterparts in non-initiative states (Arceneaux Reference Arceneaux2002; Caughey and Warshaw Reference Caughey and Warshaw2018; Gerber Reference Gerber1996; Lascher, Hagen, and Rochlin Reference Lascher, Hagen and Rochlin1996; Matsusaka Reference Matsusaka2010). We might expect initiative states to be more responsive because a potential initiative represents a strong threat to their policymaking ability, but our findings suggest it is a rather weak threat particularly under gridlocked conditions. In this regard, our contribution fits more in line with those that conclude that initiative states are no more responsive than non-initiative states (Caughey and Warshaw Reference Caughey and Warshaw2018; Lascher, Hagen, and Rochlin Reference Lascher, Hagen and Rochlin1996; Lax and Phillips Reference Lax and Phillips2012; Monogan, Grary, and Lowery Reference Monogan, Grary and Lowery2009).
How can research on the direct and indirect influence of initiatives (Caughey and Warshaw Reference Caughey and Warshaw2018; Gerber Reference Gerber1996; Lascher, Hagen, and Rochlin Reference Lascher, Hagen and Rochlin1996; Matsusaka Reference Matsusaka2010) be reconciled with what we found here? One reason could be that the influence pertains to certain high-profile issues and not necessarily others. The research on the indirect influence of the initiative has mainly been conducted on issues like the death penalty, parental consent for abortion, and Indian gaming, among others (Arceneaux Reference Arceneaux2002; Boehmke Reference Boehmke2005b; Boehmke and Witmer Reference Boehmke and Witmer2004). The citizen initiative may just serve as a corrective for highly salient issues on which the public has strong views. Some of the discrepancy in findings about the responsiveness of initiative states may lie in the methodology. Studies using aggregate measures of citizen opinion and policy outcomes do not tend to find a strong link whereas those that examine individual policy adoptions tend to find a stronger one. On the one hand, it may be possible that passage of a single, high-profile initiative might instill enough fear to move legislators on similar issues. On the other hand, legislators in some states, like California, consider a voluminous number of issues in any given year and initiative threats may only be employed on a very small percentage of issues. In that scenario, the initiative would not enhance responsiveness on most issues legislators face, but it might on a small subset.
Although this study focused on initiative outcomes in California, there are a couple of reasons why the results here should apply to other states with the initiative process. First, studies have shown that divided government increases initiative use in multiple states and not only in California (Banducci Reference Banducci, Bowler, Donovan and Tolbert1998; Damore, Bowler, and Nicholson Reference Damore, Bowler and Nicholson2012). Similar to California, policy advocates in these other states may seek to circumvent divided government and run into the same obstacles in the electorate. Future research can confirm whether this is true. Second, we examined all initiatives in California’s history, so our results are not unique to one policy area. Despite weaker effects on non-fiscal initiatives, we still found more voter opposition to these measures under divided government and higher party polarization. Other initiative states also have high levels of polarization, such as Washington, Colorado, and Ohio, although not quite as high as California (Shor and McCarty Reference Shor and McCarty2011).
This research raises several avenues for future research. One logical extension of this work is to investigate whether the findings here vary across policy areas. We separated initiatives into the broad categories of fiscal and non-fiscal, but they could be broken down further into social policies, morality policies, and criminal justice, among other areas. Conducting a multistate study would yield an adequate sample size for each policy area. Second, we do not know how often policy advocates threaten to use initiatives and on which issues. Future research could tally publicly issued initiative threats from newspaper accounts or survey legislators to see how often they receive them and how they incorporate them into their voting decisions.
Supplementary material
The supplementary material for this article can be found at http://doi.org/10.1017/spq.2023.20.
Data availability statement
Replication materials are available on SPPQ Dataverse at https://doi.org/10.15139/S3/VK1LRD (Cummins Reference Cummins2023).
Funding statement
The authors received no financial support for the research, authorship, and/or publication of this article.
Competing interest
The authors declared no potential conflicts of interest with respect to the research, authorship, and/or publication of this article.
Author Biography
Jeff Cummins is a professor of political science at California State University, Fresno. His research interests include the initiative process, state fiscal policy, and term limits.