1 Introduction
Pattern forming instabilities in macroscopic dissipative systems, driven out of equilibrium by external stresses, are common in nature and have been studied intensely over the last decades (see e.g. Cross & Hohenberg Reference Cross and Hohenberg1993). Prominent examples are found in fluid systems (see e.g. Chandrasekhar Reference Chandrasekhar1961, Swinney & Gollub Reference Swinney and Gollub1985) where the pattern formation is driven either thermally or by shear stresses. The general understanding of pattern forming systems has benefited from numerous experimental and theoretical investigations of the classical, thermally driven Rayleigh–Bénard convection (RBC) in a layer of a simple fluid heated from below (Busse Reference Busse and Peltier1989; Bodenschatz, Pesch & Ahlers Reference Bodenschatz, Pesch and Ahlers2000; Lappa Reference Lappa2009). In the RBC system, the main control parameter is the Rayleigh number,
 $R$
, a dimensionless measure of the applied temperature gradient. At a critical Rayleigh number,
 $R_{c}$
, the quiescent heat conducting basic state develops into the well-known periodic arrays of convection rolls characterized by a critical wavevector
 $\boldsymbol{q}_{c}$
. The stability of the rolls and their evolution towards characteristic 3-D patterns via sequences of bifurcations with increasing
 $R$
have been investigated by Busse and coworkers (see e.g. Cross & Hohenberg Reference Cross and Hohenberg1993; Busse & Clever Reference Busse, Clever and Riahi1996 and references therein). The present paper analyses a variant of RBC, the inclined layer convection (ILC) system, where the fluid layer is inclined at an angle
 ${\it\gamma}$
to the horizontal. Investigations of this system also have a long tradition (see e.g. Gershuni & Zhukhovitzkii Reference Gershuni and Zhukhovitzkii1969; Vest & Arpaci Reference Vest and Arpaci1969; Hart Reference Hart1971; Bergholz Reference Bergholz1977; Ruth, Hollands & Raithby Reference Ruth, Hollands and Raithby1980; Fujimura & Kelly Reference Fujimura and Kelly1992; Daniels, Plapp & Bodenschatz Reference Daniels, Plapp and Bodenschatz2000).
In the ILC system, for
 ${\it\gamma}\neq 0^{\circ }$
gravity
 $\boldsymbol{g}$
has components both perpendicular and parallel to the fluid layer, which leads to an important modification of the basic state compared to RBC. The applied temperature gradient first produces stratified fluid layers with continuously varying temperatures and densities. In addition, the basic state already contains a flow field driven by the in-plane component of
 $\boldsymbol{g}$
: the heavier (colder) fluid will flow down the incline and the lighter (warmer) fluid will flow upwards. Since the resulting flow field creates a velocity gradient perpendicular to the fluid layer, both buoyancy and shear-stress driven instabilities of the basic state compete. Their relative importance is governed by the Prandtl number
 $\mathit{Pr}$
, the ratio of the thermal diffusivity,
 ${\it\kappa}$
, to the kinematic viscosity,
 ${\it\nu}$
, of the fluid. Furthermore, the strength of the shear stress can be continuously increased by increasing
 ${\it\gamma}$
. The orientation of the roll axes at onset of convection allows for directly discriminating between buoyancy and shear driving. The buoyancy driven rolls are aligned parallel to the incline (longitudinal rolls) while the shear driven rolls are aligned perpendicular to the incline (transverse rolls). It should be noted that the latter also bifurcate, when the fluid layer is heated from above and the thermal stress is therefore stabilizing.
Our goal is not a representative parameter study of ILC with respect to
 $R,{\it\gamma},\mathit{Pr}$
, which would go beyond the scope of a single paper. Our theoretical investigations have instead been motivated by recent ILC experiments in pressurized
 $\text{CO}_{2}$
(Bodenschatz et al.
Reference Bodenschatz, Pesch and Ahlers2000; Daniels et al.
Reference Daniels, Plapp and Bodenschatz2000) with a fixed value
 $\mathit{Pr}=1.07$
of the Prandtl number. In this work the
 ${\it\gamma}{-}R$
parameter space has been systematically explored and a variety of fascinating patterns have been described. As in all ILC studies mentioned above, our theoretical analysis is based on the Oberbeck–Boussinesq equations (OBE). In contrast to the extensively studied RBC, earlier results in the literature for the ILC system are mostly limited to the linear regime and characterize the primary bifurcation of the convection rolls from the basic state at
 $R=R_{c}$
(see e.g. Gershuni & Zhukhovitzkii Reference Gershuni and Zhukhovitzkii1969; Vest & Arpaci Reference Vest and Arpaci1969; Hart Reference Hart1971; Ruth et al.
Reference Ruth, Hollands and Raithby1980; Fujimura & Kelly Reference Fujimura and Kelly1992). In the nonlinear regime (
 $R>R_{c}$
) Busse and Clever (Clever & Busse Reference Clever and Busse1977; Busse & Clever Reference Busse and Clever1992) investigated secondary and tertiary instabilities of the convection rolls for some special cases. In contrast, the present work is devoted to a comprehensive theoretical analysis of the patterns in Daniels et al. (Reference Daniels, Plapp and Bodenschatz2000) at
 $\mathit{Pr}=1.07$
.
In the present work we make use of the well-known arsenal of concepts to analyse pattern forming instabilities in fluid systems (see e.g. Cross & Hohenberg Reference Cross and Hohenberg1993). This approach deploys its full power in large aspect ratio systems (lateral extension,
 $L$
, of the fluid layer much larger than its thickness,
 $d$
) which were first realized experimentally in Daniels et al. (Reference Daniels, Plapp and Bodenschatz2000). From a linear instability analysis of the basic state we determine the critical values
 $R_{c},\boldsymbol{q}_{c}$
at the onset of convection. The properties of the rolls in the weakly nonlinear regime,
 $R\gtrsim R_{c}$
, are then analysed in the framework of amplitude equations, which yield approximate roll solutions. Using these as starting solutions allows for the iterative determination of the roll solutions in the nonlinear regime, where
 $R>R_{c}$
. Secondary instabilities of these roll solutions are then determined in a Floquet analysis.
We will demonstrate the agreement between experiments and theory with respect to the onset of convection in the
 ${\it\gamma}$
–
 $R$
plane. For inclination angles
 ${\it\gamma}$
below a codimension 2 angle,
 ${\it\gamma}_{c2}\approx 78^{\circ }$
for
 $\mathit{Pr}=1.07$
the destabilisation of the basic state is driven by longitudinal rolls, while transverse rolls bifurcate for
 ${\it\gamma}>{\it\gamma}_{c2}$
. Both bifurcations are always stationary and continuous (supercritical). The subsequent secondary destabilisation of the 2-D rolls for
 ${\it\gamma}\neq 0^{\circ }$
at increasing
 $R$
is driven by oblique roll solutions, whose axes are not along the longitudinal or transverse roll directions. As a result, spatially periodic 3-D patterns are often observed. These are characterized by the nonlinear interaction of three roll modes with wavevectors
 $\boldsymbol{q}_{1},\boldsymbol{q}_{2}\text{ and }\boldsymbol{q}_{3}$
, that fulfil a wavevector resonance condition
 $\boldsymbol{q}_{1}+\boldsymbol{q}_{2}+\boldsymbol{q}_{3}=0$
.
As common in other large aspect ratio convection experiments, one also finds imperfectly periodic, weakly turbulent patterns. For instance, the 3-D motifs mentioned above appear locally superimposed on the original 2-D roll pattern, where they burst and vanish repeatedly in time (Daniels et al. Reference Daniels, Plapp and Bodenschatz2000; Daniels & Bodenschatz Reference Daniels and Bodenschatz2002; Daniels, Wiener & Bodenschatz Reference Daniels, Wiener and Bodenschatz2003). To test whether such dynamic states are caused by experimental imperfections (e.g. lateral boundaries, spatial variations of the cell thickness, inclination of the cell in two directions), we have performed the first comprehensive numerical simulations of the OBE in ILC for large aspect ratio convection cells. While a conclusive assessment of the underlying mechanism producing bursts remains elusive, the weakly turbulent dynamics of the pattern have been well reproduced in our simulations. Since the shear stresses play an important role in our system, there might be an analogy to the instabilities of the laminar state in purely shear driven fluid systems like Couette or Poiseuille flow, which also often appear in the form of localized events (for recent examples see e.g. Lemoult et al. (Reference Lemoult, Gumowski, Aider and Wesfreid2014), Tuckerman et al. (Reference Tuckerman, Kreilos, Schrobsdorff, Schneider and Gibson2014)). We hope that our investigations will lead to the revelation of deeper commonalities between ILC and such shear driven patterns in the future.
The paper is structured as follows: a brief summary of the governing OBE for the ILC system is given in § 2. We then discuss the onset of convection in terms of
 $\boldsymbol{q}_{c},R_{c}$
for
 $\mathit{Pr}=1.07$
and the resulting periodic roll pattern in § 3. The results of the stability analysis of the rolls in the nonlinear regime and the resulting phase diagram are presented in § 4. In § 5 we show direct simulations of the OBE for different
 $R$
and
 ${\it\gamma}$
, which compare well with the experiments. A short summary of this work together with perspectives for future work can be found in § 6. In three detailed appendices we present first the detailed OBE equations for the ILC system and discuss the numerical method to characterize the roll solutions above onset together with their secondary instabilities (appendix A). Then we address briefly our approach for solving the OBE in general using direct numerical simulations (appendix B). Finally we return to the linear stability analysis of the basic state to give additional information regarding the properties of
 $\boldsymbol{q}_{c},R_{c}$
(appendix C).
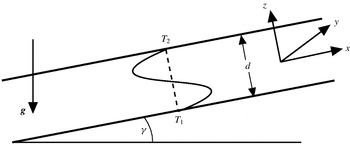
Inclined convection cell of thickness
 $d$
which is heated from below and cooled from above with temperature difference
 ${\rm\Delta}T\equiv T_{1}-T_{2}>0$
for the inclination angle
 $0^{\circ }\leqslant {\it\gamma}\leqslant 90^{\circ }$
. Driven by gravity
 $\boldsymbol{g}$
the cold fluid flows downwards near the top plate and the hot fluid flows upwards near the bottom plate in the form of a cubic velocity profile (2.2). For the range
 $90^{\circ }<{\it\gamma}<180^{\circ }$
, the fluid layer is inverted and is heated from above.

2 Oberbeck–Boussinesq equations for ILC
As shown in figure 1, we consider convection in a fluid layer of thickness
 $d$
, which is inclined at an angle
 ${\it\gamma}$
(
 $0^{\circ }<{\it\gamma}<180^{\circ }$
) with respect to the horizontal. Constant temperatures
 $T_{2}$
,
 $T_{1}$
with difference
 ${\rm\Delta}T=T_{1}-T_{2}>0$
are prescribed at the upper and lower boundaries
 $(z=\pm d/2)$
of the layer. Both cases, heating from below (
 $0^{\circ }<{\it\gamma}\leqslant 90^{\circ }$
) and heating from above (
 $90^{\circ }<{\it\gamma}<180^{\circ }$
), will be considered in this paper.
The resulting ILC system is described by the standard OBE for incompressible fluids. As usual, the OBE are non-dimensionalized using
 $d$
as the length scale and the vertical diffusion time
 $t_{v}=d^{2}/{\it\kappa}$
as the time scale. The velocity
 $\boldsymbol{u}$
is measured in units of
 $d/t_{v}$
and the temperature
 $T$
in units of
 $T_{s}={\it\nu}{\it\kappa}/{\it\alpha}gd^{3}$
with
 ${\it\alpha}$
the thermal expansion coefficient. Using a Cartesian coordinate system aligned with the layer (see figure 1), the OBE read as follows:
 $$\begin{eqnarray}\displaystyle & \displaystyle \left[\partial /\partial t+(\boldsymbol{u}\boldsymbol{\cdot }\boldsymbol{{\rm\nabla}})\right]T={\rm\nabla}^{2}T, & \displaystyle\end{eqnarray}$$
 $$\begin{eqnarray}\displaystyle & \displaystyle \mathit{Pr}^{-1}\left[\partial /\partial t+(\boldsymbol{u}\boldsymbol{\cdot }\boldsymbol{{\rm\nabla}})\right]\boldsymbol{u}={\rm\nabla}^{2}\boldsymbol{u}-\frac{\boldsymbol{g}}{g}T-\boldsymbol{{\rm\nabla}}p, & \displaystyle\end{eqnarray}$$
 $\boldsymbol{{\rm\nabla}}\boldsymbol{\cdot }\boldsymbol{u}=0$
due to incompressibility and
 $\boldsymbol{g}=-g(\cos {\it\gamma}\hat{\boldsymbol{z}}+\sin {\it\gamma}\hat{\boldsymbol{x}})$
describes the effect of gravity with the gravitational constant
 $g$
. All terms which can be expressed as gradients are included in the pressure term
 $\boldsymbol{{\rm\nabla}}p$
. Equations (2.1) are characterized by the angle of inclination
 ${\it\gamma}$
along with two non-dimensional parameters, the Prandtl number
 $\mathit{Pr}={\it\nu}/{\it\kappa}$
and the Rayleigh number
 $R={\rm\Delta}T/T_{s}$
.
In line with previous theoretical investigations of ILC in the literature (see in particular Clever & Busse (Reference Clever and Busse1977), Busse & Clever (Reference Busse and Clever1992)), we idealize the system to be quasi-infinite in the
 $x{-}y$
plane. This is considered to be the appropriate description for large aspect ratio systems. Equations (2.1) then admit primary (basic) solutions (denoted with subscript
 $0$
) of a linear temperature profile
 $T_{0}(z)$
and cubic shear velocity profile
 $\boldsymbol{U}_{0}(z)$
:
 $$\begin{eqnarray}T_{0}(z)=R\left[\frac{T_{1}+T_{2}}{2{\rm\Delta}T}-z\right],\quad \boldsymbol{U}_{0}(z)=\hat{\boldsymbol{x}}\sin {\it\gamma}R\frac{z}{6}\left[z^{2}-\frac{1}{4}\right]\equiv \hat{\boldsymbol{x}}\sin {\it\gamma}RU_{0}^{x}(z).\end{eqnarray}$$
It is convenient to describe the secondary convective state in terms of the modifications
 ${\it\theta}$
and
 $\boldsymbol{v}$
of the basic state as
 $$\begin{eqnarray}T(\boldsymbol{x},z,t)=T_{0}(z)+{\it\theta}(\boldsymbol{x},z,t),\quad \boldsymbol{u}(\boldsymbol{x},z,t)=\boldsymbol{U}_{0}(z)+\boldsymbol{v}(\boldsymbol{x},z,t),\quad \boldsymbol{x}=(x,y),\end{eqnarray}$$
where
 ${\it\theta}$
and
 $\boldsymbol{v}$
fulfil the boundary conditions
 ${\it\theta}(z=\pm 1/2)=\boldsymbol{v}(z=\pm 1/2)=0$
. Furthermore, the solenoidal velocity field
 $\boldsymbol{v}$
is mapped by the well-known poloidal–toroidal decomposition to two scalar velocity functions
 $f,{\it\Phi}(\boldsymbol{x},z,t)$
and a correction
 $\boldsymbol{U}(z,t)$
of
 $\boldsymbol{U}_{0}(z)$
; for details, see appendix A. The resulting coupled set of equations for
 ${\it\theta},f,{\it\Phi},\boldsymbol{U}$
are analysed in the following sections using standard Galerkin methods and direct numerical simulations (DNS).
3 Finite-amplitude roll solutions
Spatially periodic convection roll solutions of the OBE (2.1) with wavevector
 $\boldsymbol{q}$
exist for Rayleigh numbers
 $R>R_{c}$
, where the homogeneous basic state (2.2) is unstable against infinitesimal perturbations which depend on
 $x,y$
. The onset of convection in the ILC system at the critical Rayleigh number
 $R_{c}$
, associated with the critical wavevector
 $\boldsymbol{q}_{c}$
, has been discussed in Gershuni & Zhukhovitzkii (Reference Gershuni and Zhukhovitzkii1969), Hart (Reference Hart1971), Birikh et al. (Reference Birikh, Gershuni, Zhukhovitzkii and Rudakov1972). A very useful overview can be found in Chen & Pearlstein (Reference Chen and Pearlstein1989) and references therein. Some additional general information is given in appendix C.
Since the ILC system is anisotropic, we have to consider the linear stability of the basic state against arbitrarily oriented convection rolls with wavenumbers
 $\boldsymbol{q}=q(\cos {\it\psi},\sin {\it\psi})$
. For that purpose, we have to analyse (2.1) linearized about the basic state (2.2). For details of the standard numerical method, see § A.1. For
 ${\it\gamma}=0$
(horizontal layer with
 $\boldsymbol{U}_{0}\equiv 0$
) the system is isotropic and we have the standard RBC where
 $|\boldsymbol{q}_{c}|=q_{c0}=3.1163$
and
 $R_{c}=R_{c0}=1707.762$
(see e.g. Dominguez-Lerma, Ahlers & Cannell Reference Dominguez-Lerma, Ahlers and Cannell1984) which depend on neither
 ${\it\psi}$
nor
 $\mathit{Pr}$
. This is distinct from finite
 ${\it\gamma}$
, since
 $\boldsymbol{U}_{0}(z)$
defined in (2.2) yields a contribution proportional to
 $\cos {\it\psi}\sin {\it\gamma}/\mathit{Pr}$
in the linear equations (see (A 4b
)).
In the following we concentrate on the special case
 $\mathit{Pr}=1.07$
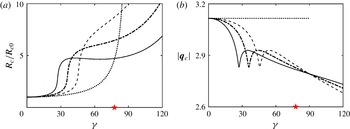
, where the bifurcation of the basic state is always stationary; other Prandtl numbers are briefly discussed in § C.2. Figure 2 displays the rescaled critical Rayleigh number
 $R_{c}/R_{c0}$
and the critical wavenumber
 $q_{c}$
as a function of the inclination angle
 ${\it\gamma}$
and with different
 ${\it\psi}$
. In general, only two particular
 $\boldsymbol{q}$
-orientations turn out to be relevant (see e.g. § C.2). The convection solutions at onset are either buoyancy driven longitudinal rolls with their axes along the incline, i.e.
 $\boldsymbol{q}_{c}=q_{c}\hat{\boldsymbol{y}},~{\it\psi}=90^{\circ }$
or shear driven transverse rolls with their axes perpendicular to the incline where
 $\boldsymbol{q}_{c}=q_{c}\,\hat{\boldsymbol{x}},{\it\psi}=0^{\circ }$
.
Longitudinal rolls (
 ${\it\psi}=90^{\circ }$
) exist only in the range
 $0<{\it\gamma}<90^{\circ }$
(heating from below, see figure 1). Their critical wavenumber is given by
 $q_{c}^{l}=q_{c0}$
for all
 ${\it\gamma}$
and the critical Rayleigh number,
 $R_{c}^{l}({\it\gamma})$
, fulfils the relation
 $R_{c}^{l}({\it\gamma})\cos {\it\gamma}=R_{c0}$
(see § C.2), implying that
 $R_{c}^{l}$
diverges in the limit
 ${\it\gamma}\rightarrow 90^{\circ }$
. In contrast, a bifurcation to transverse rolls exists in the whole interval
 $0<{\it\gamma}<180^{\circ }$
. The critical Rayleigh number for transverse rolls,
 $R_{c}^{t}({\it\gamma})$
, rises continuously as function of
 ${\it\gamma}$
and diverges at
 ${\it\gamma}=180^{\circ }$
(stable horizontal fluid layer, heated from above). In figure 2 the critical data have been shown only for
 ${\it\gamma}$
up to
 $120^{\circ }$
, where
 $R_{c}^{t}\sim 10^{5}$
involves large thermal gradients. Thus, the use of the OBE becomes questionable for
 ${\it\gamma}>120^{\circ }$
, since non-Boussinesq effects due to temperature variation of the various material parameters should be taken into account.
Inspection of figure 2 reveals the existence of a codimension 2 bifurcation point
 ${\it\gamma}_{c2}=77.746^{\circ }$
where
 $R_{c}^{l}=R_{c}^{t}=8046.420$
, such that for
 ${\it\gamma}<{\it\gamma}_{c2}$
longitudinal rolls bifurcate at onset (
 $R_{c}({\it\gamma})=R_{c}^{l}({\it\gamma})<R_{c}^{t}({\it\gamma})$
) while for
 ${\it\gamma}>{\it\gamma}_{c2}$
the transverse rolls prevail. As first demonstrated in Gershuni & Zhukhovitzkii (Reference Gershuni and Zhukhovitzkii1969) and detailed in § C.2, the threshold curves
 $R_{c}^{ob}({\it\gamma},{\it\psi})$
for general oblique rolls (
 ${\it\psi}\neq 90$
) can be constructed by suitable transformations of the critical values
 $R_{c}^{t}({\it\gamma})$
and
 $q_{c}^{t}({\it\gamma})$
of the transverse rolls. In this paper, we will often use the reduced main control parameter
 ${\it\epsilon}$
defined as:
 $$\begin{eqnarray}{\it\epsilon}=(R-R_{c}({\it\gamma}))/R_{c}({\it\gamma})\end{eqnarray}$$
as a measure for the relative distance from threshold
 $R_{c}({\it\gamma})$
at
 ${\it\epsilon}=0$
, instead of
 $R$
.
Critical Rayleigh number
 $R_{c}$
, normalized to the value
 $R_{c0}$
at
 ${\it\gamma}=0$
(a) and critical wavenumber
 $|\boldsymbol{q}_{c}|$
(b) as function of the inclination angle
 ${\it\gamma}$
for
 $\mathit{Pr}=1.07$
for different roll orientations
 ${\it\psi}$
. Line styles for the different roll orientations are:
 $\cdots \,$
for
 ${\it\psi}=90^{\circ }$
(longitudinal rolls,
 $R_{c}^{l}({\it\gamma})$
),
- - - for
 ${\it\psi}=60^{\circ }$
,
-
 $\cdot$
- for
 ${\it\psi}=45^{\circ }$
and — for
 ${\it\psi}=0^{\circ }$
(transverse rolls,
 $R_{c}^{t}({\it\gamma})$
). The codimension 2 point with
 ${\it\gamma}_{c2}=77.746^{\circ }$
is marked by a star.

The standard computational methods to construct finite-amplitude roll solutions with wavevector
 $\boldsymbol{q}_{c}$
for
 $R>R_{c}$
, where exponential growth of the linear modes is balanced by the nonlinear terms in the OBE, are sketched in § A.2. The amplitudes of the roll solutions grow continuously like
 $\sqrt{{\it\epsilon}}$
(see the discussion after (A 8)). Thus, the primary bifurcation to rolls is continuous (forward).
4 Secondary instabilities of roll solutions for
 $\mathit{Pr}=1.07$

In this section we discuss the secondary destabilisation mechanism of rolls with wavevector
 $\boldsymbol{q}_{c}$
, in a ILC system with
 $\mathit{Pr}=1.07$
and inclination angle
 ${\it\gamma}$
, that become unstable when
 ${\it\epsilon}={\it\epsilon}_{inst}({\it\gamma})$
(i.e. when
 $R=R_{inst}({\it\gamma})=(1+{\it\epsilon}_{inst}({\it\gamma}))R_{c}({\it\gamma})$
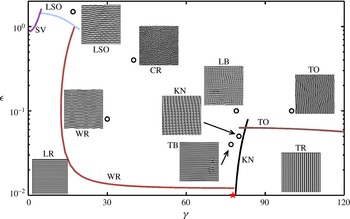
). Based on the methods described in § A.2, the stability diagram presented in figure 3 has been determined in the
 ${\it\gamma}{-}{\it\epsilon}$
plane. The solid lines mark the locations of the various secondary instabilities of the finite-amplitude roll solutions with
 $\boldsymbol{q}=\boldsymbol{q}_{c}({\it\gamma})$
at
 ${\it\epsilon}={\it\epsilon}_{inst}({\it\gamma})$
. Thus to the left of the line at
 ${\it\gamma}\approx 15^{\circ }$
and below it at higher
 ${\it\gamma}$
, stable roll solutions exist. For details of the calculations we refer to § A.3, according to which one has to distinguish between stationary and oscillatory bifurcations, characterized by a frequency
 ${\it\omega}_{inst}$
.
According to figure 3 the type of secondary roll instabilities depends strongly on the inclination angle
 ${\it\gamma}$
. Our main interest in this paper are the various 3-D patterns which develop for
 ${\it\epsilon}>{\it\epsilon}_{inst}$
. For an overview we show in figure 3 cutouts of different 3-D patterns observed in experiments (Daniels et al.
Reference Daniels, Plapp and Bodenschatz2000). Here, we aim to reproduce and interpret such 3-D patterns based on DNS of the OBE; for the numerical details, see appendix B.
Phase diagram of the convective roll patterns in the
 ${\it\gamma},{\it\epsilon}$
plane for
 $\mathit{Pr}=1.07$
. Solid lines (coloured online) indicate the secondary instabilities of the primary roll patterns at
 ${\it\epsilon}={\it\epsilon}_{inst}$
, i.e. at
 $R=(1+{\it\epsilon}_{inst})R_{c}({\it\gamma})$
. The codimension 2 point with
 ${\it\gamma}_{c2}=77.746^{\circ }$
is marked by a star. For
 ${\it\gamma}<{\it\gamma}_{c2}$
, we obtain longitudinal rolls (LR), and for
 ${\it\gamma}>{\it\gamma}_{c2}$
, transverse rolls (TR). Increasing
 ${\it\epsilon}$
in the interval
 $0\leqslant {\it\gamma}<{\it\gamma}_{c2}$
, we obtain the various thresholds for the secondary instabilities of the LR: skewed varicose instability (SV) shown in purple, longitudinal subharmonic oscillations (LSO) shown in light blue and wavy rolls (WR) shown in dark red. Analogously, in the range
 ${\it\gamma}>{\it\gamma}_{c2}$
the thresholds for instability of the TR are shown: the knot instability (KN) in black and the transverse oscillations (TO) in brown. The graph is decorated with representative sections of the corresponding experimental pictures (Daniels et al.
Reference Daniels, Plapp and Bodenschatz2000). In addition crawling rolls (CR), transverse (TB) and the longitudinal bursts (LB) are shown, which cannot be directly associated to the secondary instabilities. Black open circles indicate locations in the
 ${\it\gamma}{-}{\it\epsilon}$
plane, where experiments and numerical simulations are compared in § 5.

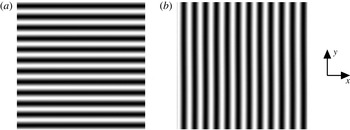
Temperature plots
 $\langle {\it\theta}(\boldsymbol{x})\rangle$
, for
 $\mathit{Pr}=1.07$
from DNS of the OBE (2.1): buoyancy dominated longitudinal rolls (LR) oriented along the incline at
 $\mathit{Pr}=1.07$
,
 ${\it\epsilon}=0.01$
,
 ${\it\gamma}=10^{\circ }$
with
 $\boldsymbol{q}_{c}=(0,3.1163)$
(a); shear dominated transverse rolls (TR) oriented perpendicular to the incline at
 ${\it\epsilon}=0.02$
,
 ${\it\gamma}=85^{\circ }$
with
 $\boldsymbol{q}_{c}=(2.82,0)$
(b). See text for further details of the simulations. In the plane the figures are oriented along the
 $x$
-axis of local coordinate system in figure 1 (reproduced at the right). All temperature plots in the rest of the paper are shown using the same convention.

We first consider small
 ${\it\epsilon}<{\it\epsilon}_{inst}({\it\gamma})$
. Starting from random initial conditions, modes with wavevector
 $\boldsymbol{q}_{c}({\it\gamma})$
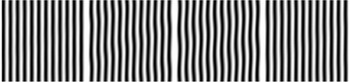
prevail, leading to perfect roll patterns, as shown in figure 4. The DNS are performed on a square with side lengths
 $L_{x}=L_{y}=12{\it\lambda}_{c}$
with
 ${\it\lambda}_{c}=2{\rm\pi}/q_{c}({\it\gamma})$
where we obtain, longitudinal rolls at
 ${\it\gamma}=10^{\circ }$
and transverse rolls at
 ${\it\gamma}=85^{\circ }$
. Here, and in the rest of this paper, we show snapshots of the vertical (
 $z$
) average
 $\langle {\it\theta}(\boldsymbol{x},t)\rangle$
of the temperature field
 ${\it\theta}(\boldsymbol{x},z,t)$
(see (A 5)). Throughout this paper the height of the convection cell increases from left to right, i.e. with increasing
 $x$
with respect to the coordinate system attached to the cell in figure 1. Such pictures, which we refer to as the temperature plots, are typically used in the literature to compare with experimental convection patterns, which are visualized via shadowgraphy (for examples, see Bodenschatz et al.
Reference Bodenschatz, Pesch and Ahlers2000). In gas convection experiments of the type considered in this paper dark and bright regions in figure 4 indicate positive (hot) and negative (cold) variations in the temperature field around the basic linear temperature profile (de Bruyn et al.
Reference de Bruyn, Bodenschatz, Morris, Trainoff, Hu, Cannell and Ahlers1996). We use a 8-bit grey scale to visualize
 $\langle {\it\theta}(\boldsymbol{x})\rangle$
; whose range increases monotonically as a function of
 ${\it\epsilon}$
.
In the following we discuss the secondary instabilities of the primary convection rolls in detail. We examine inclination angles
 ${\it\gamma}$
below
 ${\it\gamma}_{c2}$
and
 ${\it\gamma}\approx {\it\gamma}_{c2}$
in § 4.1 and
 ${\it\gamma}>{\it\gamma}_{c2}$
in § 4.2.
The various secondary instabilities are visualized by direct simulations of the underlying OBE (see § B.1). In general we use a minimal rectangular integration domain in the
 $x{-}y$
plane which is consistent with
 $\boldsymbol{q}_{c}$
and the wavevectors of the dominant destabilizing modes. For visualisation, the domain is periodically extended to a larger domain with
 $L_{x}=12{\it\lambda}_{c}=L_{y}$
.
4.1 Secondary roll instabilities below
${\it\gamma}_{c2}$

In this section we will characterize in detail the secondary instabilities of longitudinal rolls in figure 3.
4.1.1 Skewed varicose (SV) instability
For small inclinations (
 ${\it\gamma}\lesssim 5^{\circ }$
), we recover the well-known skewed varicose (SV) instability for planar RBC with
 ${\it\gamma}=0$
(Busse & Clever Reference Busse and Clever1979). This is a stationary long-wavelength instability where the original longitudinal rolls are slowly modulated along their axes but also with respect to their distance. The SV instability will not be further discussed in this paper.
4.1.2 Longitudinal subharmonic oscillation (LSO)
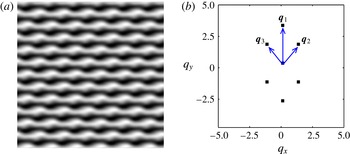
Subharmonic oscillatory instability of LSO for
 $Pr=1.07$
,
 ${\it\gamma}=17^{\circ }$
and
 ${\it\epsilon}=1.3$
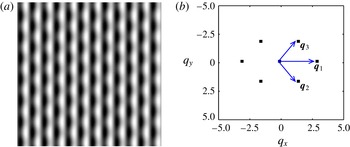
: temperature plot (a) together with the wavevectors
 $\boldsymbol{q}_{1}=\boldsymbol{q}_{c},\boldsymbol{q}_{2},\boldsymbol{q}_{3}$
(wavevector resonance
 $\boldsymbol{q}_{1}=\boldsymbol{q}_{2}+\boldsymbol{q}_{3}$
) of the leading Fourier modes (b).

In the range
 $5^{\circ }<{\it\gamma}\leqslant 21^{\circ }$
, the longitudinal roll pattern with
 $\boldsymbol{q}_{1}=\boldsymbol{q}_{c}=(0,3.1163)$
becomes linearly unstable to oscillatory subharmonic perturbations with wavevectors
 $\boldsymbol{q}_{2,3}=(\pm q_{x},q_{c}/2)$
and a finite frequency
 ${\it\omega}_{inst}$
. For the representative case
 ${\it\gamma}=17^{\circ }$
, where primary rolls become unstable at
 ${\it\epsilon}_{inst}=1.044$
, we have
 $q_{x}=1.279$
and
 ${\it\omega}_{inst}=10.21$
. In figure 5, we show an excerpt from our simulation at
 ${\it\epsilon}=1.3$
, performed on the minimal rectangle with lengths
 $L_{x}=2{\rm\pi}/q_{x}$
and
 $L_{y}=2{\it\lambda}_{c}$
with
 ${\it\lambda}_{c}=2{\rm\pi}/q_{c}$
. The periodically extended picture is six times larger. The pattern is characterized by periodic modulations of the longitudinal rolls, which are in phase on every second roll reflecting the subharmonic nature of the instability. The resulting LSO pattern obeys the wavevector resonance
 $\boldsymbol{q}_{1}-\boldsymbol{q}_{2}-\boldsymbol{q}_{3}=0$
as seen in the Fourier spectrum.
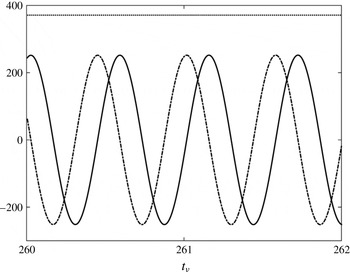
The temporal evolution of the pattern in the
 $x{-}y$
plane takes the form
 $$\begin{eqnarray}f(x,y,t)=A\cos (q_{c}y)+B(t)\cos (q_{x}x+q_{c}y/2)+C(t)\sin (q_{x}x-q_{c}y/2).\end{eqnarray}$$
The coefficient
 $A$
is independent of time while
 $B(t)$
and
 $C(t)$
are periodic with angular frequency
 ${\it\omega}\approx {\it\omega}_{inst}$
. The time evolution of these coefficients (given in units of
 $T_{s}$
as defined in § 2) is shown in figure 6.
The coefficients
 $A$
(horizontal upper dotted line),
 $B(t)$
(dash-dotted) and
 $C(t)$
(solid line) in (4.1) as function of time in units of
 $T_{s}$
;
 $B(t),C(t)$
are multiplied by a factor of four for better visualisation.

The LSO instability has been first described by Busse & Clever (Reference Busse and Clever2000) at the lower Prandtl numbers
 $\mathit{Pr}=0.7$
, by solving (A 7) in the minimal integration domain. In addition, for certain parameter combinations of
 $q_{x},q_{y}$
, an intermittent appearance of bursts has been reported, which we have not reproduced for
 $\mathit{Pr}=1.07$
.
4.1.3 Wavy roll (WR) instabilities
The next instability type, characterized by the appearance of longitudinal rolls undulating like snakes along their axes, was described in Clever & Busse (Reference Clever and Busse1977) where the notion wavy instability has been coined. The resulting bifurcation to WR is observed in a fairly large
 ${\it\gamma}$
-interval between
 $21^{\circ }<{\it\gamma}\leqslant {\it\gamma}_{c2}$
, very close to onset of convection (
 ${\it\epsilon}_{inst}=O(0.01)$
). In the framework of the Galerkin stability analysis in § A.2, this instability is characterized by long-wavelength destabilizing modes with wavevectors
 $\boldsymbol{q}_{max}=(\pm q_{x},q_{c})$
with
 $|q_{x}|\ll |\boldsymbol{q}_{c}|$
.
The WR have been discussed in detail in Daniels et al. (Reference Daniels, Brausch, Pesch and Bodenschatz2008), to which we refer readers for details. Here one finds representative experimental and theoretical pictures (see also figure 13 in § 5 below) as well as a Galerkin stability analysis of the 3-D wavy roll patterns. In fact, for
 ${\it\epsilon}>{\it\epsilon}_{inst}$
stable WR with finite
 $q_{x}$
exist. They are spatially periodic in the plane characterized by the wavevector resonance
 $\boldsymbol{q}_{2}+\boldsymbol{q}_{3}=2\boldsymbol{q}_{c}$
with
 $\boldsymbol{q}_{2,3}=(\pm q_{x},q_{c})$
. In the
 $x,y$
-plane the temperature pattern is described as
 $$\begin{eqnarray}f(x,y)=A\cos (q_{c}y)+B\sin (q_{c}y)\sin (q_{x}x).\end{eqnarray}$$
For
 ${\it\epsilon}=0.1$
and
 $q_{x}=1.28$
, we find for instance
 $A=48.1$
and
 $B=12.8$
in units of
 $T_{s}$
.
4.2 Secondary roll instabilities above
${\it\gamma}_{c2}$

In this section we discuss the secondary instabilities of the transverse rolls bifurcating for inclinations
 ${\it\gamma}>{\it\gamma}_{c2}$
.
4.2.1 Knot (KN) instability
Just above the codimension 2 point, the shear dominated transverse rolls with
 $\boldsymbol{q}_{1}=(q_{c},0)$
and
 $q_{c}\simeq 2.82$
(see figure 4
b) are destabilized by the longitudinal rolls with wavevector
 $\boldsymbol{q}_{2}=(0,q_{y})$
and
 $q_{y}=q_{c0}=3.1163$
. The steeply rising stability line in figure 3, starts at
 ${\it\gamma}={\it\gamma}_{c2}$
with
 ${\it\epsilon}=0$
. In the weakly nonlinear regime, the oblique mode with wavevector
 $\boldsymbol{q}_{3}=(q_{c},q_{y})$
comes into play and the wavevector resonance
 $\boldsymbol{q}_{3}\,=\,\boldsymbol{q}_{1}+\boldsymbol{q}_{2}$
is established. The pattern is well described by:
 $$\begin{eqnarray}f(x,y)=A\cos (q_{c}x)+B\sin (q_{y}y)+C\sin (q_{c}x)\cos (q_{y}y).\end{eqnarray}$$
As a function of
 ${\it\epsilon}$
, the amplitudes
 $B,C$
increase continuously above
 ${\it\epsilon}={\it\epsilon}_{inst}$
.
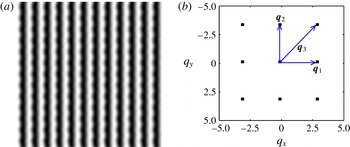
Knot instability of transverse rolls at
 $Pr=1.07$
,
 ${\it\gamma}=81.9^{\circ }$
and
 ${\it\epsilon}=0.055$
: temperature plot (a); wavevectors of the leading Fourier modes
 $\boldsymbol{q}_{1}=\boldsymbol{q}_{c}$
,
 $\boldsymbol{q}_{2}=(0,q_{c0})$
and
 $\boldsymbol{q}_{3}\,=\,\boldsymbol{q}_{1}+\boldsymbol{q}_{2}$
(b).

In figure 7 we illustrate an representative example for
 ${\it\gamma}=81.9^{\circ }$
with
 ${\it\epsilon}_{inst}=0.053$
, where the minimal domain
 $L_{x}={\it\lambda}_{c}$
and
 $L_{y}=2{\rm\pi}/q_{c0}$
is again periodically extended. At
 ${\it\epsilon}=0.055$
, we find
 $A=17.9,B=1.95,C=2.16$
in (4.3). The resulting stationary pattern (see figure 7
a) has some similarity to the knot patterns described in Busse & Clever (Reference Busse and Clever1979) for the isotropic RBC system. However, in our ILC system the wavevector resonance triggered by the oblique mode
 $\boldsymbol{q}_{3}$
plays an important role.
For completeness, it should be mentioned that the knot instability in ILC has been previously investigated in Fujimura & Kelly (Reference Fujimura and Kelly1992) for
 ${\it\gamma}\lesssim 90^{\circ }$
in the framework of two coupled-amplitude equations restricted to the amplitudes
 $A,B$
in (4.3).
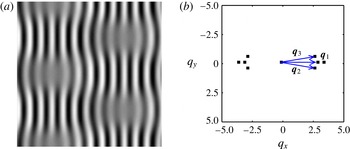
Transverse oscillatory rolls at
 $Pr=1.07$
,
 ${\it\gamma}=84.9^{\circ }$
and
 ${\it\epsilon}=0.07$
: temperature plot (a); wavevectors of the dominant Fourier modes (b). In this case, we use a square grid with
 $q_{y}=q_{c}=3.117$
.

4.2.2 Transverse oscillatory (TO) rolls
For
 ${\it\gamma}>83.2^{\circ }$
the destabilization of the transverse rolls starts to be governed by the transverse oscillatory rolls (TO) along an almost horizontal transition line as function of
 ${\it\gamma}$
in figure 3. Transverse oscillatory (TO) are characterized by destabilizing modes with a Floquet vector
 $\boldsymbol{s}$
of relatively small but finite modulus
 $|\boldsymbol{s}|\sim q_{c}/6$
and by an oscillatory time dependence of period about
 $3.5t_{v}$
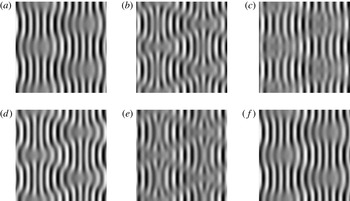
. In an analogy to the stationary SV instability of longitudinal rolls (see § 4.1.1), the rolls are expected to become slowly modulated along their axis and also with respect to the spacing. Without a definitive resonance condition among the dominant destabilizing modes, we do not expect periodic 3-D patterns of the kind discussed in the previous subsections. Thus, we have to solve the OBE on a larger domain in the
 $x{-}y$
plane, including modes with wavevectors
 $|(q_{x},q_{y})|\ll q_{c}$
. An excerpt of representative DNS pattern for
 ${\it\gamma}=84.9^{\circ }$
is shown in figure 8(a) at
 ${\it\epsilon}=0.07$
. This pattern results from a secondary instability of transverse rolls (
 $R_{c}=8282.64$
and
 $q_{c}=2.8023$
) at
 ${\it\epsilon}_{inst}=0.063$
with
 ${\it\omega}_{inst}=1.809$
. One observes the appearance of localized patches with reduced amplitudes on top of the original slowly modulated transverse rolls. Apparently, the pattern arises through a complex beating phenomena, due to a superposition of oscillating modes with slightly different wavevectors. The most prominent ones (
 $\boldsymbol{q}_{2},\boldsymbol{q}_{3}$
) together with
 $\boldsymbol{q}_{1}\equiv \boldsymbol{q}_{c}$
are shown in figure 8(b).
Figure 9 shows the complicated time evolution of the oscillatory pattern during one period given as
 $2{\rm\pi}/{\it\omega}_{inst}$
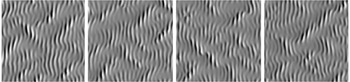
. The localized patches of reduced amplitudes in figure 9(a), evolve first into slanted lines of reduces amplitudes in (b). As documented in figure 9(c–f) with progessing time, the undulations of the rolls become first stronger before they decrease until arriving again at the initial pattern.
According to our phase diagram in figure 3, the instability of the transverse rolls towards the TO pattern remains relevant for larger
 ${\it\gamma}$
and also governs the secondary instability in the case of heating from above. A representative example of a time sequence is shown in figure 10 for
 ${\it\gamma}=100^{\circ }$
, where the TO instability is characterized by
 ${\it\epsilon}_{inst}=0.06$
and
 ${\it\omega}_{inst}=1.48$
. The graph of the most relevant destabilizing modes looks practically identical to the one in figure 8 and is thus not shown. The interaction of the modes leads, however, to a much simpler time evolution, as compared to figure 9 for
 ${\it\gamma}=84.9^{\circ }$
. It is possible that in the latter case the destabilizing modes triggering the knot instability for slightly smaller
 ${\it\gamma}$
in figure 3 come into play as well.
As will be discussed in § 5, the regions of suppressed amplitudes become elongated and are no longer periodically arranged in the plane when increasing the aspect ratio, i.e.
 $L_{x},L_{y}$
in the DNS. As shown in figure 18 below, they compare well with the corresponding experimental patterns in Daniels et al. (Reference Daniels, Plapp and Bodenschatz2000) called switching diamond panes (SDP) there.
A time sequence of TO patterns shown over one time period for the case of heating from below. Consecutive panels are separated by
 $0.44t_{{\it\nu}}$
. System parameters are the same as figure 8 with
 $Pr=1.07$
,
 ${\it\gamma}=84.9^{\circ }$
and
 ${\it\epsilon}=0.07$
.

A time sequence of TO patterns shown over one time period for the case of heating from above. Consecutive panels are separated by
 $0.4t_{{\it\nu}}$
. System parameters are
 $Pr=1.07$
,
 ${\it\gamma}=100^{\circ }$
and
 ${\it\epsilon}=0.08$
.

4.2.3 Vertical convection
The case of a vertical convection cell (
 ${\it\gamma}=90^{\circ }$
) is of special interest since the pattern formation is exclusively driven by the shear stress. So this system has motivated many previous investigations, mainly in the linear regime and often with
 $\mathit{Pr}\gtrsim 12.45$
where an oscillatory bifurcation to transverse rolls takes place. For
 $\mathit{Pr}=1.07$
, however, we observe stationary transverse rolls at onset, and their stability analysis yields always a secondary bifurcation to the TO pattern for all
 ${\it\gamma}$
near
 $90^{\circ }$
(see figure 3 and our discussion in the previous subsection).
This result is noteworthy, since in the previous literature (Clever & Busse Reference Clever and Busse1995) for
 $\mathit{Pr}=0.71$
(air) a stationary secondary instability of the transverse rolls driven by the effective subharmonic roll modes with wavevectors
 $\boldsymbol{q}_{2,3}=(q_{c}/2,\pm p)$
was predicted. This subharmonic varicose instability (SHV) of the transverse rolls has been confirmed by our own calculations. The instability of the transverse rolls with
 $q_{c}=2.8123,R_{c}=5701.2625$
takes place at
 ${\it\epsilon}_{inst}=0.0599$
with
 $p=1.5898$
. These numbers are consistent with those used for direct simulations of the OBE in Clever & Busse (Reference Clever and Busse1995) (
 $R_{c}=5726.9,q_{c}=2.69,p=1.7$
and
 ${\it\epsilon}\gtrsim 0.11$
).
In close analogy to the LSO (§ 4.1.2), the resonance conditions
 $\boldsymbol{q}_{c}=\boldsymbol{q}_{2}+\boldsymbol{q}_{3}$
holds. To confirm the results of stability analysis we have performed DNS of the OBE on the smallest periodicity domain in the plane compatible with instability data above, i.e. with
 $L_{x}=2{\it\lambda}_{c},L_{y}={\it\lambda}_{c}(q_{c}/p)$
(see (B 1)). The resulting stationary temperature plot (periodically extended to
 $L_{x}=L_{y}=12{\it\lambda}_{c}$
) for
 ${\it\epsilon}=0.064>{\it\epsilon}_{inst}$
is shown in figure 11. Keeping the dominant Fourier modes, the pattern is represented as:
 $$\begin{eqnarray}f(x,y)=A\cos (q_{c}x)-B\sin (q_{c}x/2)\cos (py),\end{eqnarray}$$
with
 $A=131.23,B=60.76$
in units of
 $T_{s}$
; the subharmonic instability of the transverse rolls is reflected in the argument of sine in the second term.
A closer look at the
 $\mathit{Pr}$
-dependence of the secondary bifuraction of the transverse rolls in this regime shows in fact that for
 $\mathit{Pr}\gtrsim 0.9$
the secondary SHV bifurcation of the transverse rolls is replaced by the TO bifurcation discussed in § 4.2.2. This is consistent with our stability analysis and experimental observations at
 $\mathit{Pr}=1.07$
.
The subharmonic varicose instability of transverse rolls with
 $\mathit{Pr}=0.71$
,
 ${\it\epsilon}=0.065$
and
 ${\it\gamma}=90^{\circ }$
: temperature plot (a); wavevectors of the leading Fourier amplitudes (b). See text for details.

5 Comparison with experimental results
In the previous section, we have discussed the various characteristic secondary instabilities of the ILC roll patterns with increasing inclination angle
 ${\it\gamma}$
. A number of basic destabilization mechanisms have been identified by considering simulations in small periodic domains in the plane of linear dimension
 $L$
, where
 $L=O(2d)$
with
 $d$
the cell thickness. Our goal in this section is a comparison with the pressurized
 $\text{CO}_{2}$
experiments (Daniels et al.
Reference Daniels, Plapp and Bodenschatz2000; Daniels Reference Daniels2002) at
 $\mathit{Pr}=1.07$
. In these experiments a convection cell with very small layer thickness
 $d=(710\pm 7)~{\rm\mu}\text{m}$
could be realized together with quite large lateral dimensions [(
 $42\times 21$
)
 $d^{2}$
]. Thus, the dimensions of the convection cell are such that the experiments are expected to be well described in simulations by periodic boundary conditions in the plane. Also, these dimensions set the time scale in terms of the vertical diffusion time to
 $t_{v}=d^{2}/{\it\kappa}=3.0~\text{s}$
, which is very convenient for typical experiments. The experimental shadowgraph pictures, shown in figure 3 as small cutouts, will be compared in this section to DNS of the basic equations (2.1) on large horizontal domains with lateral dimensions
 $L=20{\it\lambda}_{c}=O(40d)$
; for the numerical details, see appendix B. We follow the same sequence of parameter combinations as used in the preceding section, where
 ${\it\gamma}$
was systematically increased. From the simulations we obtain the average temperature plots,
 $\langle {\it\theta}(\boldsymbol{x})\rangle$
, discussed in § 4, which are shown side by side with the experimental shadowgraph pictures. We focus on the generic features of the patterns when all transients have died out. A quantitative agreement between theory and experiment is however, not to be expected, as along with the complicated optics involved in shadowgraphy (Trainoff & Canell Reference Trainoff and Canell2002), the experimental pictures are typically digitally remastered to enhance their contrast.
5.1 Convection pattern for
${\it\gamma}<{\it\gamma}_{c2}$

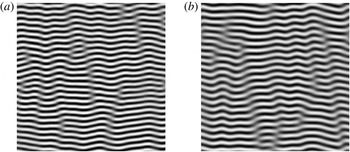
Snapshots of subharmonic oscillatory patterns (LSO) for
 $Pr=1.07$
,
 ${\it\gamma}=17^{\circ }$
and
 ${\it\epsilon}=1.5$
from experiments (a) and from our numerical simulation (b).

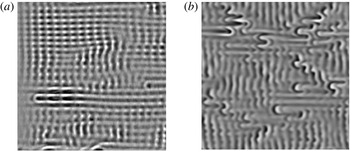
We start with the subharmonic oscillatory patterns (LSO), in figure 5 which bifurcate from longitudinal rolls. As shown in figure 12, experiments and theory match very well. We observe patches of subharmonic oscillations, which were discussed in § 4.1.2 using a stability analysis of the longitudinal rolls and numerical simulations in a minimal domain (containing only one roll pair). In large ILC systems, such patterns typically appear only as localized patches that compete with moderately distorted rolls. Such patches expand and shrink in time and their centres move erratically over the plane. The subharmonic oscillations within the localized patches show an internal dynamics with a time scale of 1 to 3 cycles per
 $t_{v}$
which is of the same order as the period
 $2{\rm\pi}/{\it\omega}_{inst}$
of the oscillatory bifurcation in § 4.1.2.
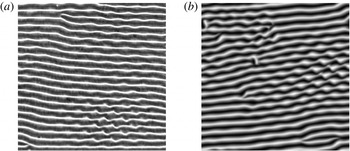
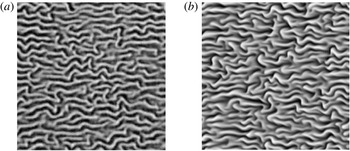
Representative wavy rolls (WR) patterns from experiments (a) in comparison with simulations (b) for
 $Pr=1.07$
,
 ${\it\gamma}=30^{\circ }$
and
 ${\it\epsilon}=0.08$
.

With increasing
 ${\it\gamma}$
, the longitudinal rolls become unstable against undulations even for very small
 ${\it\epsilon}$
; i.e. the instability line in figure 3 bends dramatically down. Typical experimental and theoretical pictures of undulated WRs shown in figure 13 again match very well with each other. However, instead of the stationary undulations as predicted in § 4.1.3, the patterns are characterized by patches of uniform undulated rolls, separated by grain boundaries (Daniels et al.
Reference Daniels, Plapp and Bodenschatz2000; Daniels & Bodenschatz Reference Daniels and Bodenschatz2002). In addition, the rolls are scattered with point defects that move at right angles to the rolls. The wavy patterns have been discussed in detail in Daniels et al. (Reference Daniels, Brausch, Pesch and Bodenschatz2008), where also a weakly chaotic dynamics of the amplitudes
 $A,B$
in (4.2) is analysed in detail.
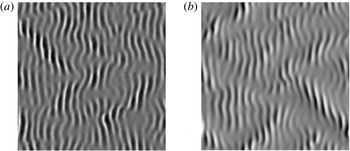
Crawling rolls (CR) from experiments (a) and from simulations (b) at the same parameters as in figure 13 except at a larger
 ${\it\epsilon}=0.4$
.

With increasing
 ${\it\epsilon}$
, the undulations become more and more disordered and the rolls are disrupted. A transition is observed to the dynamic state of the so-called CR Daniels et al. (Reference Daniels, Plapp and Bodenschatz2000) as shown in figure 14. This state is reproduced in our numerical simulations, which indicates that it is not caused by experimental imperfections.
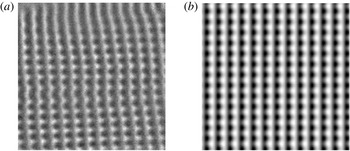
Knot (KN) pattern at
 ${\it\gamma}=80^{\circ }$
and
 ${\it\epsilon}=0.05$
in experiments (a) and in simulations (b).

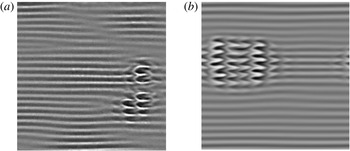
Localized transverse burst (TB) for the parameters
 $Pr=1.07$
,
 ${\it\gamma}=77^{\circ }$
and
 ${\it\epsilon}=0.04$
in experiments (a) and in simulations (b).

5.2 Convection close to codimension 2 point
The vicinity of the codimension 2 point
 ${\it\gamma}_{c2}$
is of particular interest. According to figure 3 the wavy roll instability governs the secondary instability of the longitudinal rolls up to
 ${\it\gamma}={\it\gamma}_{c2}$
. In contrast, for
 ${\it\gamma}\gtrsim {\it\gamma}_{c2}$
the primary transverse rolls are predicted to become unstable against cross rolls leading to the knot (KN) patterns. This instability mechanism is confirmed by the pictures shown in figure 15. It is remarkable that the DNS on a large domain in the plane (
 $L_{x}=L_{y}=20{\it\lambda}_{c}$
) starting from random initial conditions has led to perfect knot patterns. They are indistinguishable from those shown in figure 7 generated on a small domain with
 $L_{x},L_{y}\approx {\it\lambda}_{c}$
. The teeth-like structure on the transverse rolls caused by a resonant interaction of the three roll modes (see figure 7) is born out in the experimental picture. However, the transverse rolls are slightly oblique here and undulated.
We now discuss two types of patterns which do not allow for a direct interpretation by secondary instabilities of the basic rolls. First, we show in figure 16 the transverse bursts (TB) for
 ${\it\gamma}=77^{\circ }\lesssim {\it\gamma}_{c2}$
and at
 ${\it\epsilon}=0.04$
slightly above the secondary wavy bifurcation of the longitudinal rolls. Both in experiments and simulations, we observe a background of slightly undulated rolls with some amplitude modulations. Intermittently, localized transverse structures (bursts) appear, which contract, vanish and reappear at other places. The longitudinal bursts in experiments have been analysed in Daniels et al. (Reference Daniels, Wiener and Bodenschatz2003), to which we refer for more details.
In contrast, for
 ${\it\gamma}>{\it\gamma}_{c2}$
and intermediate
 ${\it\epsilon}$
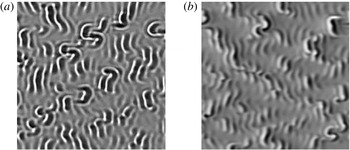
, longitudinal bursts (LB) are observed; representative examples are shown in figure 17. They are characterized by localized loops of longitudinal rolls superimposed on transverse rolls. The experimental picture shows more of the bimodal knot pattern in the background than do the simulations. In the vicinity of
 ${\it\gamma}_{c2}$
, we do not expect simulations to reproduce all details of the experiments at the same parameters, as the system is very sensitive against small changes of
 ${\it\gamma}$
and
 ${\it\epsilon}$
. The material parameters in the experiments certainly have some inaccuracies. In addition, presumably non-Boussinesq effects lead to a slow drift of the experimental pattern. Although the two burst phenomena are clearly reflected in our simulations, additional efforts are necessary in the future to understand their underlying mechanism.
Localized longitudinal bursts (LB) for the parameters
 $Pr=1.07$
,
 ${\it\gamma}=79^{\circ }$
and
 ${\it\epsilon}=0.1$
in experiments (a) and in simulations (b).

SDP for the parameters
 $Pr=1.07$
,
 ${\it\gamma}=100^{\circ }$
and
 ${\it\epsilon}=0.1$
in experiments (a) and in simulations (b).

5.3 Shear-stress dominated instabilities
Finally, we briefly address the heating from above case which is described in § 3, for which the inclination angle is
 ${\it\gamma}>90^{\circ }$
. As discussed before, the destabilization of the basic state is due to the shear stress of the cubic flow profile
 $\boldsymbol{U}_{0}$
(2.2). In § 4.2.2 we have described the destabilisation of the primary transverse rolls to switching diamond pane patterns shown in Daniels & Bodenschatz (Reference Daniels and Bodenschatz2002). According to figure 3 the transition line to the TO is almost horizontal and begins at
 ${\it\gamma}$
slightly above
 ${\it\gamma}_{c2}$
. In figure 18 we show a representative example for
 ${\it\gamma}=100^{\circ }$
, where experiment and simulations agree very well. The time evolution observed in the corresponding time sequence, presented in figure 19, reflects the frequency
 ${\it\omega}_{inst}=1.48$
given in § 4.2.2 and documented in figure 10. Increasing
 ${\it\epsilon}$
further causes the patches with enhanced amplitude to become smaller and to move more erratically as shown in figure 20.
Patterns formed during a typical evolution of switching oscillatory rolls shown in order, for the case of heating from above as in figure 18. Consecutive panels are separated by
 $5t_{{\it\nu}}$
. System parameters are
 $Pr=1.07$
,
 ${\it\gamma}=100^{\circ }$
and
 ${\it\epsilon}=0.1$
.

Chaotic switching rolls at
 ${\it\gamma}=100^{\circ },{\it\epsilon}=0.19$
(experiments (a), simulations (b)).

6 Conclusions
The recent experimental study of ILC for
 $\mathit{Pr}=1.07$
by Daniels et al. (Reference Daniels, Plapp and Bodenschatz2000) has opened a new path to a much better understanding of this dynamically rich system; for a recent overview, see chapter 7 in Lappa (Reference Lappa2009). In the present work, the convection instabilities of the basic state, sketched in figure 1, have been systematically explored as function of the inclination angle
 ${\it\gamma}$
and the Rayleigh number
 $R$
. Furthermore, the resulting patterns are visualized directly and the large variety of new pattern types are shown in the phase diagram in figure 3.
For the theoretical analysis in this paper, the large lateral extent of the convection cell in the experiment has been of particular importance. For large aspect ratio systems the influence of the lateral boundaries of the cell is certainly highly suppressed, making it appropriate to use periodic boundary conditions. A convincing agreement with experiments by Daniels et al. (Reference Daniels, Plapp and Bodenschatz2000) has been obtained. The analysis of the primary bifurcation of rolls at the onset of convection and their secondary bifurcations have revealed the complicated interaction of buoyancy and shear driven destabilization mechanisms. Of particular importance is the spatially resonant interaction between three roll systems with different orientations in the plane (wavevector resonance, as detailed in § 4).
A look at the experimental pictures and the pattern dynamics (see Daniels et al.
Reference Daniels, Plapp and Bodenschatz2000) shows that they are not completely described by perfect periodic patterns either in one or two dimensions in the fluid layer plane. One finds cases where a kind of clear periodicity is expressed only in parts of the cell (figures 12 and 13). One also observes defect lines; in addition the patterns change in time. Further increasing
 $R$
in these cases often leads to turbulent patterns (see figures 14 and 20). In addition, there are other cases where localized patches of a different structure than the underlying, regular background patterns appear intermittently. Two examples are the transverse bursts in figure 16 and the longitudinal bursts in figure 17. The ability to reproduce such weakly turbulent patterns in DNS of the OBE validates their generic character.
To unravel the basic underlying mechanism that produce such weakly turbulent patterns is a difficult task and we have been unable to interpret them in terms of instabilities of the underlying roll patterns. One is sometimes faced with similar problems in standard RBC. A prominent example is the so-called spiral defect chaos (Bodenschatz et al.
Reference Bodenschatz, Pesch and Ahlers2000), which is often observed for medium
 $\mathit{Pr}$
and for Rayleigh numbers
 $R$
slightly larger than
 $R_{c}$
though the rolls are linearly stable in this regime.
Further effort is thus needed to analyse and to quantify the dynamics of the turbulent events in detail as has been done for the bursts in Daniels & Bodenschatz (Reference Daniels and Bodenschatz2002), Daniels et al. (Reference Daniels, Wiener and Bodenschatz2003) or for the wavy patterns in Daniels et al. (Reference Daniels, Brausch, Pesch and Bodenschatz2008). Another issue is the weakly turbulent convection states described by Busse and coworkers in ILC, appearing even for very small systems containing only one roll pair (Busse & Clever Reference Busse and Clever1992, Reference Busse and Clever2000). Their relation to the weakly turbulent events, which here cover considerably larger domains in the plane, requires further investigation.
In this paper, we have restricted ourselves to the special case of
 $\mathit{Pr}=1.07$
. As part of future work, it is planned to apply our methods in particular to fluids with large
 $\mathit{Pr}>12.47$
, where the primary roll bifurcation is oscillatory.
Acknowledgements
The authors are highly indebted to Professor F. Busse for his very useful comments and fruitful discussions on the subject of this paper. T.M.S. was supported by the Swiss National Science Foundation under grant number 200021-160088.
Appendix A. Governing equations and stability of rolls
The poloidal–toroidal decomposition of the solenoidal velocity field
 $\boldsymbol{v}$
(2.3) in § 2 reads as follows:
 $$\begin{eqnarray}\boldsymbol{v}(x,y,z,t)=\boldsymbol{{\rm\nabla}}\times (\boldsymbol{{\rm\nabla}}\times f\hat{\boldsymbol{z}})+\boldsymbol{{\rm\nabla}}\times {\it\Phi}\hat{\boldsymbol{z}}+\boldsymbol{U}(z,t)\equiv {\bf\chi}f+\boldsymbol{{\it\eta}}{\it\Phi}+\boldsymbol{U}(z,t).\end{eqnarray}$$
The explicit equations for
 ${\it\theta},f,{\it\Phi}$
are obtained by inserting (2.3) into (2.1) followed by the application of the operators
 ${\bf\chi},\boldsymbol{{\it\eta}}$
to (2.1b
). The evolution equation for the secondary mean flow
 $\boldsymbol{U}(z,t)$
is obtained by averaging the velocity equation (2.1b
) over the
 $x{-}y$
plane, leading to:
 $$\begin{eqnarray}\frac{1}{\mathit{Pr}}\frac{\partial \boldsymbol{U}(z,t)}{\partial t}=-\frac{1}{\mathit{Pr}}\frac{\partial \overline{(v_{z}\boldsymbol{v})}}{\partial z}+\frac{\partial ^{2}\boldsymbol{U}}{\partial z^{2}}+\sin {\it\gamma}\,\overline{{\it\theta}}-(\partial _{x},\partial _{y},0)(P_{x}x+P_{y}y),\end{eqnarray}$$
where the overbar indicates the horizontal average.
Except for minor changes, the resulting equations for
 ${\it\theta},f,{\it\Phi}$
can already be found in Busse & Clever (Reference Busse and Clever1992), Daniels et al. (Reference Daniels, Brausch, Pesch and Bodenschatz2008). The differences arise firstly from their definition of the Rayleigh number as
 $R={\rm\Delta}T\cos {\it\gamma}/T_{s}$
, whose explicit dependence on
 $\cos {\it\gamma}$
is not convenient for the description of vertical convection cells when
 ${\it\gamma}=90^{\circ }$
. By the transformation
 ${\it\theta}\rightarrow {\it\theta}/\!\cos {\it\gamma}$
and interchanging
 $x$
and
 $y$
we arrive at our formulation. Secondly, our equations for the mean flow
 $\boldsymbol{U}$
(A 2) contain the additional pressure terms
 $P_{x}(t),P_{y}(t)$
. They have been proposed in a different context in Busse & Clever (Reference Busse and Clever2000), to guarantee mass conservation,
 $\int \text{d}z\,\boldsymbol{U}(z)=0$
. Finite
 $P_{x}(t),P_{y}(t)$
appear only in the DNS of complex patterns in § 5.
For the following discussions, a compact symbolic representation of the equations for the fields
 ${\it\theta},f,{\it\Phi}$
is useful:
 $$\begin{eqnarray}\displaystyle \widehat{\unicode[STIX]{x1D63E}}\;\frac{\partial }{\partial t}\widehat{\boldsymbol{V}}(\boldsymbol{x},z,t)=\widehat{\unicode[STIX]{x1D647}}\widehat{\boldsymbol{V}}(\boldsymbol{x},z,t)+\widehat{\boldsymbol{N}}[\widehat{\boldsymbol{V}}+\boldsymbol{U},\widehat{\boldsymbol{V}}], & & \displaystyle\end{eqnarray}$$
with
 $\boldsymbol{x}=(x,y)$
and the symbolic vector
 $\widehat{\boldsymbol{V}}=[{\it\theta},f,{\it\Phi}]^{\text{T}}$
. The symbol
 $\widehat{\boldsymbol{N}}$
stands for the nonlinear terms which consist of quadratic forms in
 ${\it\theta},f,{\it\Phi}$
and
 $\boldsymbol{U}$
.
As an example, we show the explicit expressions for the linear terms of
 ${\it\theta}$
and
 $f$
. This allows us to immediately identify the corresponding components of the linear operators
 $\widehat{\unicode[STIX]{x1D63E}},\widehat{\unicode[STIX]{x1D647}}$
:
 $$\begin{eqnarray}\displaystyle & \displaystyle \frac{\partial }{\partial t}{\it\theta}=-R{\it\Delta}_{2}\,f+{\rm\nabla}^{2}{\it\theta}-R\sin {\it\gamma}(U_{0}^{x}(z)\partial _{x}){\it\theta}, & \displaystyle\end{eqnarray}$$
 $$\begin{eqnarray}\displaystyle & \displaystyle \frac{1}{\mathit{Pr}}\partial _{t}{\rm\nabla}^{2}{\it\Delta}_{2}\,f={\rm\nabla}^{4}{\it\Delta}_{2}\,f-\cos {\it\gamma}\,{\it\Delta}_{2}{\it\theta}+\sin {\it\gamma}\,\partial _{x}\partial _{z}{\it\theta}-\frac{1}{\mathit{Pr}}\sin {\it\gamma}R\,F[U_{0}^{x}]f, & \displaystyle\end{eqnarray}$$
 ${\it\Delta}_{2}=(\partial _{xx}+\partial _{yy})$
. The term
 $F[U_{0}^{x}]\equiv [U_{0}^{x}(z){\rm\nabla}^{2}-\partial _{zz}^{2}U_{0}^{x}(z)]\partial _{x}{\it\Delta}_{2}$
originates from the contribution of the basic mean flow
 $\boldsymbol{U}_{0}$
in (2.2) to the velocity
 $\boldsymbol{u}$
in (2.1b
). Note that
 ${\it\theta},f$
are not coupled to
 ${\it\Phi}$
in (A 4).
In general, equations (A 3) are solved with the boundary conditions
 ${\it\theta}(z=\pm 1/2)=0$
and
 $f=\partial _{z}f={\it\Phi}=\boldsymbol{U}=0$
at
 $z=\pm 1/2$
which derive from the no-slip boundary conditions
 $\boldsymbol{v}(z=\pm 1/2)=0$
. These conditions are automatically satisfied by the use of Galerkin expansions with respect to
 $z$
. As in Busse & Clever (Reference Busse and Clever1992) we use for
 ${\it\theta}$
the ansatz:
 $$\begin{eqnarray}{\it\theta}(\boldsymbol{x},z,t)=\mathop{\sum }_{m=1}^{M}S_{m}(z){\it\vartheta}_{m}(\boldsymbol{x},t);\quad S_{m}(z)=\sin (m{\rm\pi}(z+1/2)),\end{eqnarray}$$
since
 $S_{m}(z=\pm 1/2)=0$
. For
 ${\it\Phi}$
and the secondary mean flow
 $\boldsymbol{U}(z,t)$
in (A 2) also sine functions are used, while
 $f$
is expanded in terms of the Chandrasekhar functions
 $C_{m}(z)$
(Chandrasekhar Reference Chandrasekhar1961) with
 $C_{m}(\pm 1/2)=\partial _{z}C_{m}(z=\pm 1/2)=0$
.
A.1 Linear stability analysis of the basic state
The primary convection instability of the basic state corresponds to exponentially growing solutions in time of (A 3) in the linear regime
 $(\widehat{\boldsymbol{N}}=0)$
. We use the ansatz
 $\widehat{\boldsymbol{V}}(\boldsymbol{x},z,t)=\text{e}^{{\it\sigma}t}\text{e}^{\text{i}\boldsymbol{q}\boldsymbol{\cdot }\boldsymbol{x}}\tilde{\boldsymbol{V}}(\boldsymbol{q},z,R)$
in (A 3) to arrive at the following linear eigenvalue problem for
 ${\it\sigma}$
:
 $$\begin{eqnarray}{\it\sigma}\unicode[STIX]{x1D63E}(\boldsymbol{q},\partial _{z})\tilde{\boldsymbol{V}}(\boldsymbol{q},z;R)=\unicode[STIX]{x1D647}\tilde{\boldsymbol{V}}(\boldsymbol{q},z;R)\equiv [\mathscr{A}(\boldsymbol{q},\partial _{z})+R\mathscr{B}(\boldsymbol{q},\partial _{z})]\tilde{\boldsymbol{V}},\end{eqnarray}$$
where the operators
 $\unicode[STIX]{x1D63E},\unicode[STIX]{x1D647}(\boldsymbol{q},\partial _{z})$
etc. in Fourier space derive from the corresponding ones in position space (see (A 3)) carrying a hat symbol via the transformation
 $\partial _{\boldsymbol{x}}\rightarrow \text{i}\boldsymbol{q}$
. In this paper we make use of Galerkin expansions (see (A 5)) to handle the
 $z$
dependence. Thus, for instance (A 4) is transformed into an algebraic linear eigenvalue problem of dimension
 $2M$
in the Fourier–Galerkin space.
Given that
 ${\it\sigma}_{max}(R,\mathit{Pr},{\it\gamma},\boldsymbol{q})$
is the eigenvalue
 ${\it\sigma}$
with the largest real part in (A 6), rolls become unstable when
 $\text{Re}[{\it\sigma}_{max}(R,\mathit{Pr},{\it\gamma},\boldsymbol{q})]$
crosses zero. It is convenient to determine first the neutral surface
 $R=R_{0}(\mathit{Pr},{\it\gamma};\boldsymbol{q})$
through the condition
 $\text{Re}[{\it\sigma}_{max}(R=R_{0},\mathit{Pr},{\it\gamma},\boldsymbol{q})]=0$
. Subsequently minimizing
 $R_{0}(\boldsymbol{q},{\it\gamma})$
with respect to
 $\boldsymbol{q}$
yields the critical wavevector
 $\boldsymbol{q}_{c}$
, the critical Rayleigh number
 $R_{c}=R_{0}(\boldsymbol{q}_{c})$
and the frequency
 ${\it\omega}_{c}\equiv \text{Im}[{\it\sigma}_{max}(R_{c},\boldsymbol{q}_{c})]$
as functions of
 $\mathit{Pr},{\it\gamma}$
. If
 ${\it\omega}_{c}=0$
, the bifurcation of the basic state is called stationary otherwise oscillatory.
It turns out, that the relevant eigenvalues
 ${\it\sigma}$
with
 $\text{Re}[{\it\sigma}_{max}]\geqslant 0$
are obtained from the eigenvalue problem (A 6) reduced to its
 ${\it\theta},f$
part (A 4), since
 $\text{Re}[{\it\sigma}]<0$
for all eigenvalues of the separated
 ${\it\Phi}-$
equation. Thus, with the use of our Galerkin expansions (A 5) we arrive at an algebraic linear eigenvalue problem with
 $2M\times 2M$
matrices, which is analysed using standard linear algebra codes (LAPACK).
A.2 Secondary of instabilities of roll solutions
For intermediate
 $\mathit{Pr}$
, considered in this paper, the primary bifurcation to rolls with wavevector
 $\boldsymbol{q}_{c}$
at
 $R=R_{c}$
is stationary. To construct the evolving finite-amplitude solution
 $\widehat{\boldsymbol{V}}=\widehat{\boldsymbol{V}}_{r}$
for
 $R>R_{c}$
from (A 3) we use the Fourier ansatz:
 $$\begin{eqnarray}\widehat{\boldsymbol{V}}_{r}(\boldsymbol{x},z)=\mathop{\sum }_{k=-N/2}^{k=N/2}\text{e}^{\text{i}k\boldsymbol{q}_{c}\boldsymbol{\cdot }\boldsymbol{x}}\boldsymbol{V}_{r}(k\boldsymbol{q}_{c},z).\end{eqnarray}$$
With respect to
 $z$
, we introduce an additional Galerkin expansion (see (A 5)) of the
 $(N+1)$
Fourier coefficients
 $\boldsymbol{V}_{r}(k\boldsymbol{q}_{c},z)$
. Furthermore, the Galerkin expansion of the mean flow
 $\boldsymbol{U}$
(A 2) using sine functions leads to
 $2M$
additional equations. Thus, we arrive at a system of
 $3M(N+1)+2M$
coupled nonlinear algebraic equations for all Galerkin expansion coefficients. This system is solved by Newton–Raphson methods.
The iteration process is started from the weakly nonlinear roll solution of (A 3) characterized in Fourier space by the ansatz
 $\boldsymbol{V}_{wnl}(\boldsymbol{q}_{c},z)=A(\boldsymbol{q}_{c},R)\bar{\boldsymbol{V}}_{max}(\boldsymbol{q}_{c},z;R)$
;
 $\bar{\boldsymbol{V}}_{max}$
is given by the solution of (A 6) for
 ${\it\sigma}={\it\sigma}_{max}$
at
 $\boldsymbol{q}=\boldsymbol{q}_{c}$
. For
 ${\it\epsilon}\gtrsim 0$
, a systematic expansion with respect to the small parameter
 ${\it\epsilon}$
determines the amplitude
 $A$
of
 $\boldsymbol{V}_{wnl}$
via the solution of the amplitude equation:
 $$\begin{eqnarray}{\it\sigma}_{max}(\boldsymbol{q}_{c},R,\mathit{Pr},{\it\gamma})A-cA|A|^{2}=0,\quad \text{with }\text{Re}[{\it\sigma}_{max}]\propto {\it\epsilon}.\end{eqnarray}$$
For stationary primary ILC bifurcations at intermediate
 $\mathit{Pr}$
the cubic coefficient
 $c$
is always real and positive and the bifurcation is thus forward (supercritical) at onset, i.e.
 $|A|^{2}\propto {\it\epsilon}/c$
increases continuously beyond the threshold
 ${\it\epsilon}=0$
.
To examine the linear stability of the roll solutions
 $\hat{V}_{r}$
(A 7), we linearize (A 3) with respect to an infinitesimal perturbation
 ${\it\delta}\widehat{\boldsymbol{V}}_{r}(\boldsymbol{x},z,t)$
of
 $\widehat{\boldsymbol{V}}_{r}$
. Then one switches to the Fourier–Galerkin space using the standard Floquet ansatz:
 $$\begin{eqnarray}{\it\delta}\widehat{\boldsymbol{V}}_{r}(\boldsymbol{x},z,t)=\text{e}^{{\it\Lambda}\,t}\text{e}^{\text{i}\boldsymbol{s}^{\prime }\boldsymbol{\cdot }\boldsymbol{ x}}\mathop{\sum }_{k=-N/2}^{k=N/2}\,\text{e}^{\text{i}k\boldsymbol{q}_{c}\boldsymbol{\cdot }\boldsymbol{x}}{\it\delta}\boldsymbol{V}_{r}(k\boldsymbol{q}_{c},z),\end{eqnarray}$$
together with a Galerkin expansion of the components of
 ${\it\delta}\boldsymbol{V}_{r}(k\boldsymbol{q}_{c},z)$
with respect to
 $z$
. Thus we arrive at an algebraic eigenvalue problem of dimension
 $3M(2N+1)$
for the set of eigenvalues
 ${\it\Lambda}(\boldsymbol{s}^{\prime },\boldsymbol{q}_{c},R)$
. The eigenvalue
 ${\it\Lambda}_{0}$
with the largest real part defines the growth rate
 ${\it\lambda}_{0}(\boldsymbol{s}^{\prime })\equiv \text{Re}[{\it\Lambda}_{0}(\boldsymbol{s}^{\prime })]$
of the respective perturbation
 ${\it\delta}\widehat{\boldsymbol{V}}_{r}$
. Given that
 ${\it\lambda}_{0}(\boldsymbol{s}^{\prime })$
assumes its maximum
 ${\it\lambda}_{max}(R,\mathit{Pr},{\it\gamma})$
at
 $\boldsymbol{s}^{\prime }=\boldsymbol{s}_{max}^{\prime }$
, we then determine the smallest Rayleigh number
 $R=R_{inst}({\it\gamma})=(1+{\it\epsilon}_{inst}({\it\gamma})R_{c}({\it\gamma}))$
see (3.1) at which
 $\text{Re}[{\it\lambda}_{max}]$
crosses zero. In other words at
 $R=R_{inst}$
the secondary instability of the rolls with wavevector
 $\boldsymbol{q}_{c}$
occurs for given parameters
 $\mathit{Pr},{\it\gamma}$
. When
 ${\it\omega}_{inst}=\text{Im}[{\it\Lambda}_{0}(\boldsymbol{s}^{\prime },R_{inst})]\neq 0$
the secondary bifurcation is called oscillatory, otherwise stationary. This general method works well in the ranges
 ${\it\gamma}\lesssim 12^{\circ }$
and
 ${\it\gamma}\gtrsim 17^{\circ }$
in figure 3, where the rolls are stable for
 $R<R_{inst}({\it\gamma})$
. Between
 $12^{\circ }<{\it\gamma}<17^{\circ }$
, where
 $R_{0}(\boldsymbol{q},{\it\gamma})$
is not unique, we analyse
 ${\it\sigma}_{max}(R,\mathit{Pr},{\it\gamma},\boldsymbol{q})=0$
using scans of
 ${\it\gamma},\boldsymbol{q}$
at fixed
 $R$
to determine the upward-bent threshold of the wavy roll instability, which limits the stability of the longitudinal rolls. For an appropriate interpretation of the instability, we have to determine for a given
 $\boldsymbol{s}_{max}^{\prime }$
the index
 $k_{max}$
corresponding to the largest modulus
 $|{\it\delta}\boldsymbol{V}_{r}(k_{max}\boldsymbol{q}_{c},z)|$
of the expansion coefficients in (A 9). This yields then the wavevector(s)
 $\boldsymbol{q}_{inst}$
of the dominant destabilizing mode(s) as
 $\boldsymbol{q}_{inst}=k_{max}\boldsymbol{q}+\boldsymbol{s}_{max}^{\prime }$
. It turns out that
 $k_{max}$
is always governed by the temperature component of
 ${\it\delta}\boldsymbol{V}_{r}$
and that
 $|k_{max}|\leqslant 1$
holds.
The stability of roll patterns along the method described above has been intensively employed for the investigation of the standard isotropic RBC (
 ${\it\gamma}=0$
) by Busse and coworkers also for
 $\boldsymbol{q}\neq \boldsymbol{q}_{c}$
in (A 7)–(A 9). They have thus constructed the Busse balloon (Busse & Clever Reference Busse and Clever1979, Reference Busse, Clever and Riahi1996), which is the stability diagram of rolls in the
 $|\boldsymbol{q}|,R-$
space with varying
 $\mathit{Pr}$
. We have refrained from the very time consuming calculation of the full Busse balloon in our anisotropic system by concentrating on
 $\boldsymbol{q}=\boldsymbol{q}_{c}$
, where only finite
 $\boldsymbol{s}^{\prime }$
perturbations have been found to be relevant. This has been discussed in detail in § 4. In particular in several cases the same maximal value of
 $|{\it\delta}\boldsymbol{V}(k\boldsymbol{q}_{c},z))|$
is assumed at two different integers
 $k_{2},k_{3}$
and thus two different dominant destabilizing modes
 $\boldsymbol{q}_{inst}=\boldsymbol{q}_{2},\boldsymbol{q}_{3}$
exist. The resulting 3-D patterns for
 $R>R_{inst}(\boldsymbol{q}_{c},{\it\gamma})$
are in addition often characterized in Fourier space by wavevector resonances of the form
 $\boldsymbol{q}_{1}+\boldsymbol{q}_{2}+\boldsymbol{q}_{3}=0$
between the wavevector
 $\boldsymbol{q}_{1}=\boldsymbol{q}_{c}$
of the basic roll pattern and the
 $\boldsymbol{q}_{2},\boldsymbol{q}_{3}$
. The stability analysis yields also the relative phases of the three Fourier amplitudes. Because of translational invariance of the system in the
 $x$
- and the
 $y$
-directions two phases can be chosen to be zero without loss of generality; the third one is then determined by the ratio of the components of
 ${\it\delta}\boldsymbol{V}_{r}(k_{2}\boldsymbol{q}_{c},z)$
and
 ${\it\delta}\boldsymbol{V}_{r}(k_{3}\boldsymbol{q}_{c},z)$
with the largest moduli.
A.3 Accuracy of the stability limits
The accuracy of all results presented in this paper depend on the choice of the truncation parameter
 $M$
of the Galerkin expansion with respect to
 $z$
(see (A 5)) and the truncation parameter
 $N$
in Fourier space (see (A 7), (A 9)). In this work we have always chosen
 $M=8$
and
 $N=5$
. By systematically increasing these parameters (see below) we have tested that this choice is sufficient to guarantee that the relative errors of our results are below
 $0.1\,\%$
. Even reducing the values to
 $M=6$
and
 $N=3$
does not change the curves shown in figure 3.
In table 1 we give representative examples for linear threshold values
 $R_{c}$
and
 $q_{c}$
and their dependence upon increasing values for the Galerkin truncation parameter
 $M$
. In addition, the determination of the codimension 2 point varies as
 ${\it\gamma}_{c2}=77.7857^{\circ }$
,
 $77.7462^{\circ }$
,
 $77.7544^{\circ }$
and
 $77.7560^{\circ }$
when varying
 $M$
as
 $M=6,8,10,12$
respectively.
Dependence of threshold values
 $q_{c}$
and
 $R_{c}$
for
 $\mathit{Pr}=1.07$
of longitudinal rolls at
 ${\it\gamma}=0^{\circ }$
(horizontal cell), transverse rolls at
 ${\it\gamma}=90^{\circ }$
(vertical cell) and at
 ${\it\gamma}=100^{\circ }$
(heating from above) upon different Galerkin truncation parameters
 $M$
.

Analogous convergence checks have been performed for the secondary instabilities of the convection rolls on the basis of (A 9). In general the data are more sensitive against changes of
 $M$
than of
 $N$
. We did all calculations with
 $M=8$
, which guarantees the same accuracy of the data as in the linear regime above. To guarantee an relative accuracy of better than
 $0.1\,\%$
 $N=3$
is sufficient at small
 ${\it\epsilon}$
; for
 ${\it\epsilon}=O(1)$
one needs
 $N\geqslant 4$
. This conclusion is supported by the following representative data. The secondary instability towards wavy rolls in figure 3 at
 ${\it\epsilon}_{inst}=0.8$
occurs at
 ${\it\gamma}=16.50^{\circ }$
for
 $N=5$
and at
 ${\it\gamma}=16.5288^{\circ }$
, for
 $N=4$
. For
 $N=8$
the LSO instability at
 ${\it\gamma}=17^{\circ }$
is characterized by
 ${\it\epsilon}_{inst}=1.04423$
with the oscillation frequency
 ${\it\omega}_{inst}=10.20808$
and Floquet vector
 $\boldsymbol{s}$
with components
 $s_{x}=1.27929$
and
 $s_{y}=q_{c0}/2$
. At
 $N=4$
we find only small changes with
 ${\it\epsilon}_{inst}=1.0436,{\it\omega}_{inst}=10.2038$
and
 $s_{x}=1.278990,s_{y}=q_{c0}/2$
. Finally we mention the knot instability of transverse rolls at
 ${\it\gamma}=83^{\circ }$
. For
 $N=5$
we find
 ${\it\epsilon}_{inst}=0.07134$
with
 $s_{y}=3.1179$
, which remain unchanged for
 $N=4$
.
Appendix B. Direct simulations of the OBE in ILC
Direct simulations of the OBE in (2.1) are in general confined to a rectangle in the
 $x{-}y$
plane with the lateral extensions
 $L_{x},L_{y}$
using periodic boundary condition
 $\widehat{\boldsymbol{V}}(x,y,z)=\widehat{\boldsymbol{V}}(x+L_{x},y+L_{y},z)$
. Thus, we transform to Fourier space by introducing a discrete 2-D Fourier transformation of
 $\widehat{\boldsymbol{V}}$
on a
 $N_{f}\times N_{f}$
grid with mesh sizes
 ${\rm\Delta}q_{x}=2{\rm\pi}/L_{x},{\rm\Delta}q_{y}=2{\rm\pi}/L_{y}$
in the
 $x$
- and
 $y$
-directions:
 $$\begin{eqnarray}\widehat{\boldsymbol{V}}(\boldsymbol{x},z,t)=\mathop{\sum }_{\boldsymbol{q}}\text{e}^{\text{i}\boldsymbol{q}\boldsymbol{\cdot }\boldsymbol{x}}\boldsymbol{V}(\boldsymbol{q},z,t)\quad \text{where }\boldsymbol{q}=\{(k{\rm\Delta}q_{x},l{\rm\Delta}q_{y})\}\text{with }-N_{f}/2\leqslant (k,l)\leqslant \,N_{f}/2.\end{eqnarray}$$
Reality of
 $\widehat{\boldsymbol{V}}(\boldsymbol{x},z,t)$
implies the condition
 $\boldsymbol{V}(\boldsymbol{q})=\boldsymbol{V}(-\boldsymbol{q})^{\ast }$
. With respect to
 $z$
, we use Galerkin expansions with the truncation parameter
 $M$
as before. The quadratic nonlinearities
 $\widehat{N}$
in (A 3) are treated by standard pseudospectral methods (see e.g. Boyd Reference Boyd2001). Substituting the Fourier ansatz (B 1) into (A 3) and projecting on the respective Galerkin modes one arrives at a system of
 $3M\times N_{f}^{2}$
coupled ordinary differential equations for the evolution of all the combined Fourier–Galerkin expansion coefficients. In addition, (A 2) is mapped into a system of
 $2M$
equations for the Galerkin coefficients of the secondary mean flow
 $\boldsymbol{U}$
. Semi-implicit time stepping methods, as sketched in the following subsection, are used to compute the time evolution of all our fields.
For all DNS shown in section § 5, we have used
 $L_{x}=L_{y}=n_{L}{\it\lambda}_{c}$
with the critical wavelength
 ${\it\lambda}_{c}=2{\rm\pi}/q_{c}$
and the truncation parameters
 $N_{f}=256,M=8$
and
 $n_{L}=20$
. Note that the number of roll pairs (black and white stripes) of the underlying 2-D roll patterns directly reflects
 $n_{L}$
.
As also evident from the previous section our Fourier coefficients decay quickly with increasing
 $|\boldsymbol{q}|$
. The truncation parameter
 $N_{f}=256$
in (B 1) corresponds to
 $N=(124/20)>5$
, as used for the stability analysis of rolls in § A.2. Thus it is not surprising that the results of the Floquet stability analysis (A 9) are reproduced in the DNS. Increasing
 $N_{f}$
and/or decreasing
 $n_{L}$
corresponds to keeping Fourier modes with larger
 $|\boldsymbol{q}|$
. We have checked that all the typical scenarios discussed in § 5 are recovered.
The goal of most simulations in § 4 was to validate the secondary instabilities of rolls originally obtained on the basis of § A.2, which lead to strictly periodic 3-D patterns. Thus, we have performed the DNS on minimal domains in the plane, where one side length was given as
 ${\it\lambda}_{c}$
while the other was determined by the wavevectors of the dominant destabilizing modes
 $\boldsymbol{q}_{2},\boldsymbol{q}_{3}$
introduced in § A.2. The data have then been mapped to a larger square domain in the
 $x{-}y$
plane by periodically extending the minimal domains for visualization.
B.1 Exponential time differencing method
Our starting point is (A 3), where the components of
 $\boldsymbol{V}(\boldsymbol{q},z,t)$
in (B 1) are expanded into the appropriate Galerkin modes like in (A 5). In the resulting Fourier–Galerkin representation (A 3) can be written as:
 $$\begin{eqnarray}\frac{\text{d}}{\text{d}t}\boldsymbol{V}(t)=\unicode[STIX]{x1D63C}\boldsymbol{V}(t)-\tilde{\boldsymbol{N}}\quad \text{with }\tilde{\boldsymbol{N}}=\unicode[STIX]{x1D63E}^{-1}\boldsymbol{N},\,\unicode[STIX]{x1D63C}=\unicode[STIX]{x1D63E}^{-1}\unicode[STIX]{x1D647},\end{eqnarray}$$
since the matrix
 $\unicode[STIX]{x1D63E}$
is not singular. Equation (B 2) allows for the formal solution:
 $$\begin{eqnarray}\boldsymbol{V}(t+\text{d}t)=\text{e}^{\unicode[STIX]{x1D63C}\text{d}t}\boldsymbol{V}(t)-\text{e}^{\unicode[STIX]{x1D63C}(t+\text{d}t)}\int _{t}^{t+\text{d}t}\text{e}^{-\unicode[STIX]{x1D63C}t^{\prime }}\tilde{\boldsymbol{N}}(t^{\prime })\,\text{d}t^{\prime }.\end{eqnarray}$$
Approximating
 $\tilde{\boldsymbol{N}}(t^{\prime })$
by the leading terms of the Taylor expansion about the lower limit
 $t$
of the integral in (B 3), followed by the variable transformations
 $t^{\prime }\rightarrow {\it\tau}^{\prime }+t$
and subsequently
 ${\it\tau}^{\prime }={\it\tau}\,\text{d}t$
, one arrives at:
 $$\begin{eqnarray}\boldsymbol{V}(t+\text{d}t)=\text{e}^{\unicode[STIX]{x1D63C}\text{d}t}\boldsymbol{V}(t)-\text{d}t\int _{0}^{1}\text{e}^{(1-{\it\tau})\unicode[STIX]{x1D63C}\,\text{d}t}\,\left[\tilde{\boldsymbol{N}}(t)+{\it\tau}\,\text{d}t\,\frac{\tilde{\boldsymbol{N}}(t)-\tilde{\boldsymbol{N}}(t-\text{d}t)}{\text{d}t}\right]\text{d}{\it\tau}.\end{eqnarray}$$
In Koikari (Reference Koikari2009) one finds for an arbitrary matrix
 $\unicode[STIX]{x1D648}$
, the following definition of the matrix functions
 ${\it\phi}_{k}(\unicode[STIX]{x1D648})$
:
 $$\begin{eqnarray}{\it\phi}_{0}(\unicode[STIX]{x1D648})=\text{e}^{\unicode[STIX]{x1D648}},\quad {\it\phi}_{k}(\unicode[STIX]{x1D648})=\frac{1}{(k-1)!}\int _{0}^{1}\text{e}^{(1-{\it\tau})\unicode[STIX]{x1D648}}\;{\it\tau}^{k-1}\,\text{d}{\it\tau};\quad k=1,2\ldots .\end{eqnarray}$$
Thus, (B 4) can be rewritten as:
 $$\begin{eqnarray}\boldsymbol{V}(t+\text{d}t)={\it\phi}_{0}(\unicode[STIX]{x1D63C}\,\text{d}t)\,\boldsymbol{V}(t)-\,\text{d}t\,{\it\phi}_{1}(\unicode[STIX]{x1D63C}\,\text{d}t)\,\tilde{\boldsymbol{N}}(t)-\text{d}t^{2}\,{\it\phi}_{2}(\unicode[STIX]{x1D63C}\,\text{d}t)\,\left(\frac{\tilde{\boldsymbol{N}}(t)-\tilde{\boldsymbol{N}}(t-\text{d}t)}{\text{d}t}\right).\end{eqnarray}$$
Both
 $\boldsymbol{V}$
and the secondary mean flow
 $\boldsymbol{U}$
(see (A 2)) are calculated using the time exponential method.
The time stepping scheme described in (B 6) incorporates the convergence to stationary solutions
 $\boldsymbol{V}_{s}$
of (B 2) which have to fulfil
 $\unicode[STIX]{x1D63C}\boldsymbol{V}_{s}-\tilde{\boldsymbol{N}}_{s}=0$
. This can be proven using the recurrence identities of the matrix operators
 ${\it\phi}_{k}(\unicode[STIX]{x1D648})$
as
 $$\begin{eqnarray}{\it\phi}_{k}(\unicode[STIX]{x1D648})=\unicode[STIX]{x1D648}^{-1}[{\it\phi}_{k-1}(\unicode[STIX]{x1D648})-I].\end{eqnarray}$$
It should be remarked that the matrix exponentials could be also treated by using a spectral representation of
 $\unicode[STIX]{x1D63C}$
(B 2) in terms of its direct and adjoint eigenfunctions, which then becomes equivalent to the method used in Pesch (Reference Pesch1996). While this procedure has been successfully applied in a series of papers on complex patterns in standard RBC (Bodenschatz et al.
Reference Bodenschatz, Pesch and Ahlers2000; Egolf et al.
Reference Egolf, Melnikov, Pesch and Ecke2000), its application to ILC requires particular care and is less robust since the spectral properties of the operator
 $\unicode[STIX]{x1D63C}$
are complicated (Rudakov Reference Rudakov1967; Chen & Pearlstein Reference Chen and Pearlstein1989).
Appendix C. Additional remarks on the linear stability calculations
In § 3, the linear instability of the basic state, against rolls with wavevector
 $\boldsymbol{q}=q(\cos {\it\psi},\sin {\it\psi})$
was discussed. As already indicated in § A.1 only the
 ${\it\theta},f$
part of the eigenvalue problem (A 6) obtained from (A 4) in Fourier space needs to be considered. Since (A 4) are invariant against the transformations
 $(x,z)\rightarrow -(x,z)$
and separately
 $(y\rightarrow -y)$
, it is sufficient to restrict
 ${\it\psi}$
to the interval
 $(0\leqslant {\it\psi}<90^{\circ })$
. As already mentioned in § 3, and documented in figure 2 for
 $\mathit{Pr}=1.07$
, it is sufficient to investigate only the special cases either
 ${\it\psi}=90^{\circ }$
(longitudinal rolls) or
 ${\it\psi}=0^{\circ }$
(transverse rolls). A proof can be found in Gershuni & Zhukhovitzkii (Reference Gershuni and Zhukhovitzkii1969). In § C.2, we will present our own very short version.
C.1 Linear stability results for small and large
$\mathit{Pr}$

We have reproduced some of the earlier results in the literature as validation of our numerical methods. In general, the codimension 2 point
 ${\it\gamma}={\it\gamma}_{c2}$
, where the critical Rayleigh numbers
 $R_{c}^{l}({\it\gamma})$
of the longitudinal rolls and
 $R_{c}^{t}({\it\gamma})$
of the transverse ones are equal, moves continuously towards
 ${\it\gamma}=0$
for decreasing
 $\mathit{Pr}$
. Below
 $\mathit{Pr}<0.264$
(more precisely calculated in Fujimura & Kelly (Reference Fujimura and Kelly1992)), the primary bifurcation leads to transverse rolls for all
 ${\it\gamma}>0$
. On the other hand, for
 $\mathit{Pr}>1.07$
, the codimension 2 point moves continuously towards
 ${\it\gamma}=90^{\circ }$
and eventually the primary bifurcation to transverse rolls restricted to the range
 $90^{\circ }\lesssim {\it\gamma}<180^{\circ }$
. In addition, this bifurcation becomes oscillatory at large
 $\mathit{Pr}$
. For the vertical case (
 ${\it\gamma}=90^{\circ }$
) this happens at
 $\mathit{Pr}\gtrsim 12.45$
, in agreement with Fujimura & Kelly (Reference Fujimura and Kelly1992). At a slightly larger
 $\mathit{Pr}=12.7$
again at
 ${\it\gamma}=90^{\circ }$
, we find
 $R_{c}=88\,220$
,
 ${\it\omega}_{c}=504.6$
which is in excellent agreement with Bergholz (Reference Bergholz1977).
C.2 Bifurcation of oblique rolls
It is useful to exploit a certain form invariance of the linear equations (A 4a,b
) in Fourier space using the transformation
 $f\rightarrow f/R$
. It turns out that the Rayleigh number
 $R$
, the inclination angle
 ${\it\gamma}$
and the oblique roll angle
 ${\it\psi}$
appear first in the combination
 $R\sin {\it\gamma}\cos {\it\psi}$
due to the contributions of
 $\boldsymbol{U}_{0}$
(see (2.2)) and furthermore in (A 4b
) as
 $R\cos {\it\gamma}$
. In addition, these equations depend only on
 $|\boldsymbol{q}|$
. Thus, the critical Rayleigh number
 $R_{c}^{l}({\it\gamma})$
of the longitudinal rolls (
 ${\it\psi}=90^{\circ }$
) is determined by
 $R_{c}^{l}({\it\gamma})\cos {\it\gamma}=R_{c}^{l}({\it\gamma}=0)=1707.824$
. At the codimension 2 point
 ${\it\gamma}_{c2}$
, we have
 $R_{c}^{l}({\it\gamma}_{c2})=R_{c}^{t}({\it\gamma}_{c2})$
, where
 $R^{t}({\it\gamma})$
denotes the critical Rayleigh number of the transverse rolls. Consequently,
 ${\it\gamma}_{c2}$
is determined by the transcendental equation
 $R_{c}^{t}({\it\gamma}_{c2})\cos ({\it\gamma}_{c2})=R_{c0}$
which always has a unique solution
 $0<{\it\gamma}_{c2}<90^{\circ }$
for
 $0.246<\mathit{Pr}<12.45$
.
The form invariance of the
 ${\it\theta},f$
equations implies a direct relation between the transverse eigensolutions (
 ${\it\psi}=0$
) of (A 6) for given values of
 ${\it\gamma}\neq 90^{\circ },|\boldsymbol{q}|,{\it\sigma},\mathit{Pr}$
and an associated set of oblique eigensolutions (
 ${\it\psi}\neq 90^{\circ }$
) for the same values of
 $|\boldsymbol{q}|,{\it\sigma},\mathit{Pr}$
but at a different inclination angle
 ${\it\Gamma}\neq {\it\gamma}$
and a different Rayleigh number
 $R=R^{t}({\it\Gamma})\neq R^{ob}$
. In detail, we have:
 $$\begin{eqnarray}R^{ob}\sin {\it\gamma}\cos {\it\psi}=R^{t}({\it\Gamma})\sin {\it\Gamma},\quad R^{ob}\cos {\it\gamma}=R^{t}\cos {\it\Gamma}\Longrightarrow \tan ({\it\gamma})\cos ({\it\psi})=\tan ({\it\Gamma}).\end{eqnarray}$$
In the special case
 ${\it\Gamma}={\it\gamma}=90^{\circ }$
equation (C 1) simplifies to
 $R^{ob}\cos {\it\psi}=R^{t}$
. In Gershuni & Zhukhovitzkii (Reference Gershuni and Zhukhovitzkii1969) the authors have arrived at analogous relations. As a general consequence an explicit analysis of linear oblique rolls is not necessary, since they can be determined from the transverse rolls on the basis of (C 1).
At medium
 $\mathit{Pr}$
, equations (C 1) are useful to characterize the stationary bifurcations (
 ${\it\sigma}=0$
) to oblique rolls at the critical Rayleigh number
 $R=R_{c}^{ob}({\it\gamma},{\it\psi})$
. This curve crosses the longitudinal threshold curve
 $R_{c}^{l}({\it\gamma})$
at the codimension 2 point
 ${\it\gamma}_{c2}^{ob}({\it\psi})<90^{\circ }$
, which is thus determined by the relation
 $R_{c}^{ob}({\it\gamma}_{c2}^{ob},{\it\psi})=R_{c0}/\!\cos ({\it\gamma}_{c2}^{ob})$
. Thus, there exists according to (C 1) a certain angle
 ${\it\Gamma}^{\prime }$
which allows for expression of
 $R_{c}^{ob}({\it\gamma}_{c2}^{obl},{\it\psi})$
by
 $R_{c}^{t}({\it\Gamma}^{\prime })$
as follows:
 $$\begin{eqnarray}R_{c}^{ob}({\it\gamma}_{c2}^{ob},{\it\psi})\cos ({\it\gamma}_{c2}^{ob})=R_{c}^{t}({\it\Gamma}^{\prime })\cos ({\it\Gamma}^{\prime })=R_{c0};\quad \tan ({\it\gamma}_{c2}^{ob})\cos ({\it\psi})=\tan ({\it\Gamma}^{\prime }).\end{eqnarray}$$
From (C.2a
), we conclude
 ${\it\Gamma}^{\prime }={\it\gamma}_{c2}$
and from the second one
 ${\it\gamma}_{c2}^{ob}>{\it\gamma}_{c2}$
for (
 $0<{\it\psi}<90^{\circ }$
), such that for
 ${\it\gamma}>{\it\gamma}_{c2}$
pure transverse rolls prevail at onset. From (C.2) it is also obvious that the dip in the
 $q_{c}({\it\gamma})$
-curve in the transverse case
 $({\it\psi}=0)$
is mapped to corresponding ones for
 ${\it\psi}\neq 0$
with the same
 $|\boldsymbol{q}_{c}|$
; this immediately explains their equal heights in figure 4.
Though not relevant for the onset of convection, the sudden, strong increase of
 $R_{c}^{t}({\it\gamma})$
curve at
 ${\it\gamma}\approx 26.5^{\circ }$
in figure 2 is interesting. For
 $\mathit{Pr}>1.75$
even discontinuous jumps in
 $R_{c}^{t}$
and
 $q_{c}^{t}$
at
 ${\it\gamma}\approx 30^{\circ }$
develop. These are associated with the phenomenon of two disconnected neutral curves as seen in figure 6 in Chen & Pearlstein (Reference Chen and Pearlstein1989).