The subject of this article is the evolution of racial inequality in the United States from the end of the Civil War to the present. This is a massive topic that needs to be circumscribed to be manageable. I focus on per capita income and various causal factors, such as education and race per se.
The subject can be motivated in different ways. Mine is visual. I ask readers to recall two sets of images. The first is from early September 2005. These are images from Hurricane Katrina, the massively destructive storm that took the lives of more than 1,800 people and obliterated more than 100 billion (2005) dollars of property. The specific images are of poor African-Americans from the Lower 12th Ward of New Orleans—in harm's way and desperate to be rescued by boat or helicopter—and from around the Superdome—hungry, despondent, and dead-tired. Millions of Americans and untold numbers around the world saw these images on television. I could summon other depressing images of contemporary Black poverty from Detroit, Baltimore, Chicago, Cleveland, or Ferguson, Missouri.
The second set is from early November 2008. The setting is Grant Park, Chicago, on the evening of Barack Obama's election to his first term as President. To call this “historic” is an understatement. We are a little more than a half-century after the March on Washington. Would any of the leaders of the Civil Rights Movement at the time—Martin Luther King, John Lewis, or others—have predicted an African-American president just 50 fifty years later? I doubt it.
At any juncture in modern American history other than the Obama presidency we could readily find photographs of poor Whites and contrast these with the smiling White face in the White House. But that contrast would not bring immediately to mind the subtext of race and its lengthy historical baggage. I have chosen the Obama inauguration because the visual image is so arresting, but it would be easy to summon many other examples, mundane and otherwise, of highly successful African-Americans, in virtually any walk of economic life.
My goals are, first, to review and revise the economic history of racial differences in per capita income from 1870 to the present; and second, to interpret the history analytically. Specifically, I shall be revising pre-WWII benchmark estimates of Black/White income ratios originally prepared by Robert Higgs. The Higgs benchmarks suggest that the Black/White income ratio increased from 1870 to 1900, but the trend was flat from 1900 to 1940. Compared with the Higgs benchmarks, mine show less convergence before 1900 but more between 1900 and 1940. While I believe my benchmarks are an improvement, there is more work to be done. I welcome scrutiny and further research.
When my new benchmarks are combined with standard post-WWII census data they reveal that the underlying rate of Black/White income convergence has generally been positive but quite slow absolutely, with the notable exceptions of the 1940s and the period of the modern Civil Rights Movement. I explore the interpretation of these long-run features of the time series with a model of intergenerational transmission of inequality. Income convergence has been slow in the long run because racial differences in causal factors that determine income eroded slowly across generations and because initial racial inequality after the Civil War was so glaring.
My findings rationalize the imagery that I opened with. Because there has been long-run convergence we can find numerous examples today of economic success in the Black community. Because convergence has been far from complete we can, unfortunately, find even more examples of Black poverty. Post-Civil Rights, there is relatively more Black economic success than pre-Civil Rights but this reflects, in part, the cumulated accomplishments of prior generations.
BLACK-WHITE PER CAPITA INCOMES, 1870 TO THE PRESENT: A REVISION
“To be a poor man is hard, but to be a poor race in a land of dollars is the very bottom of hardships.”
—W. E. B. Du Bois, The Souls of Black Folk
Labor economists studying the historical evolution of racial economic differences often focus on earnings, typically those of males (Smith and Welch Reference Smith and Welch1989; Donohue and Heckman Reference Donohue and James J.1991; Bound and Freeman Reference Bound and B. Freeman1992). I focus instead on the broader measure of per capita income, which includes non-labor income and also the labor earnings of women.Footnote 1
Before proceeding I wish to emphasize several caveats. There are severe gaps in the historical record and strong assumptions and many judgment calls must be made to make quantitative progress (see Appendix B). There is nothing special about this as long as the analysis is transparent, as I hope mine is. I am after the big picture, not minute brush strokes.
In focusing on racial differences in per capita income I am effectively assuming that all income generated by Blacks (Whites) is consumed within the Black (White) community. While not literally true, historically the bias is small because there has been so little racial intermarriage, a point I return to later in the article.
Focusing on per capita income necessarily obscures changes in inequality within group populations. While it is quite plausible that income inequality within the Black population has changed in the long run it is impossible to document this with sufficient accuracy. Because my interest is mainly in the long run I stick with per capita income.
My analysis pertains to the civilian, non-institutionalized population. The institutionalized population includes those in prison and, in recent decades, Black incarceration has increased absolutely and relative to White incarceration (Neal and Rick Reference Neal and Rick2014; Bayer and Charles Reference Bayer and Charles2015). It is far from obvious how to compute the “income” of prisoners but excluding them likely biases the post-1980 trend in the Black/White income ratio, possibly upward.Footnote 2
Higgs Benchmarks
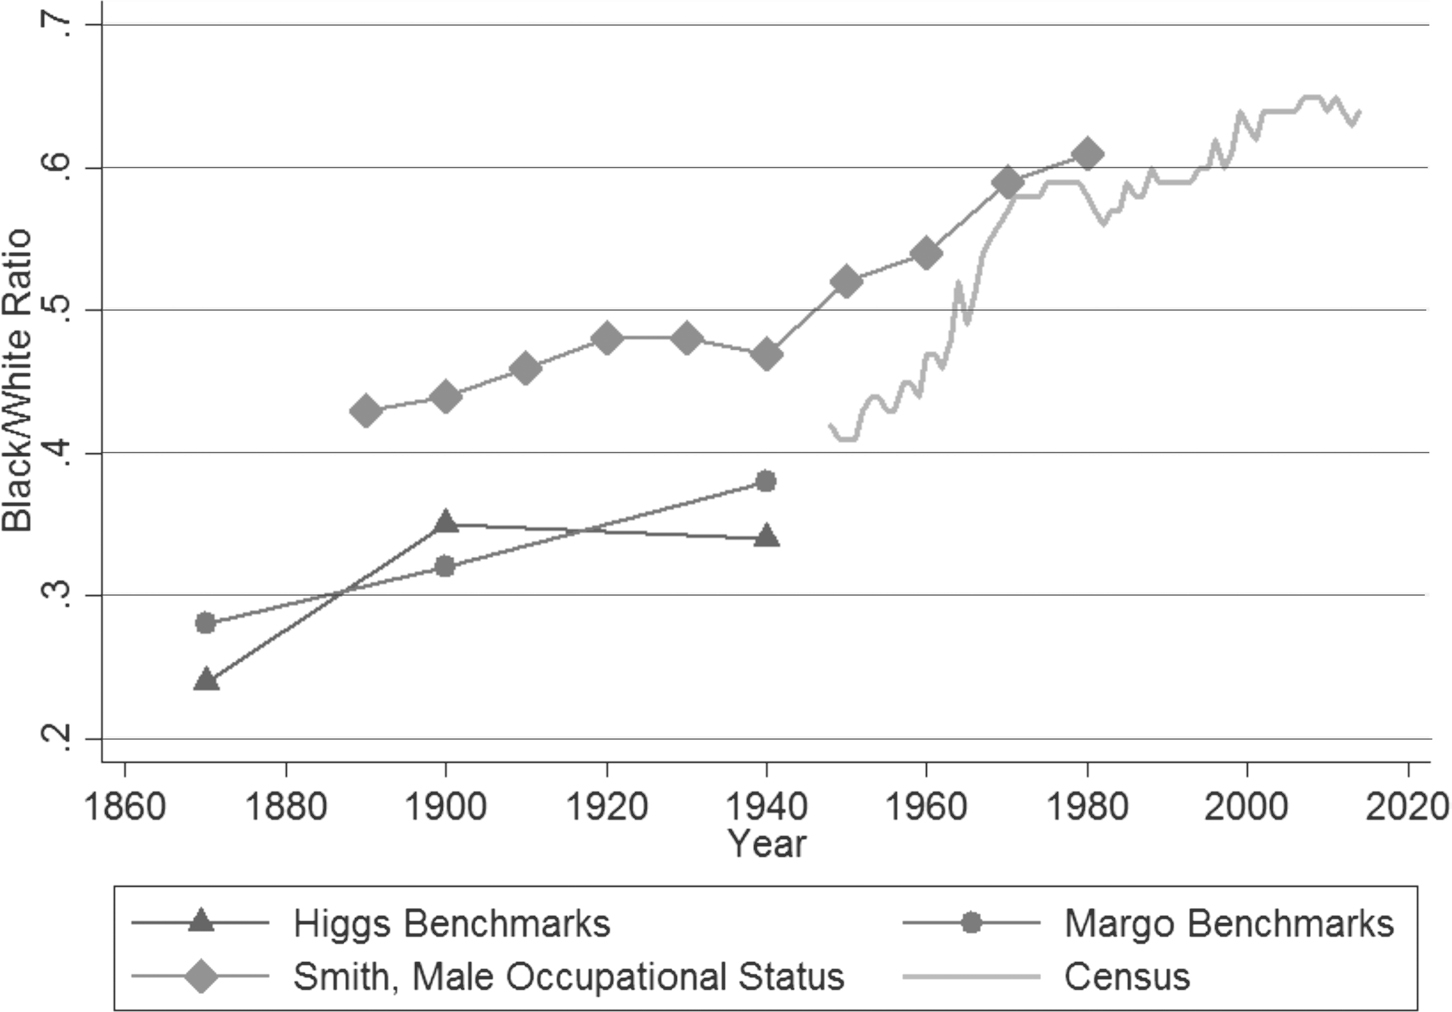
With these caveats in mind I begin with Figure 1, which displays four time series. The one labeled “Census” is derived from post-WWII data. From 1967 to the present (2014), this series is the ratio of the Census Bureau's annual estimates of Black and White per capita income. For 1948 to 1966 the ratio is estimated by multiplying the Black-White ratio of adult earnings by a scaling factor.Footnote 3 Prior to 1948 there are no annual data to construct a counterpart to the Census Bureau series. Instead, I show the three benchmark estimates for ca. 1870, 1900, and 1940 made by Robert Higgs (Reference Higgs1977, Reference Higgs, Shulman and Darity1989); my revisions to the Higgs benchmarks; and a series pertaining to adult men prepared by James Smith (Reference Smith1984) for the census years 1890 to 1980.Footnote 4
BLACK/WHITE INCOME RATIOS, 1870–2014

I begin by focusing on the Higgs benchmarks and the post-WWII census data treating the two as if they were joined at the hip—the Higgs-cum-census series. In the immediate aftermath of the Civil War, Black income per capita was far lower than White—according to the Higgs benchmark, just shy of a quarter (0.24) ca. 1870.Footnote 5 That is, for every dollar of income received by Whites in the immediate aftermath of the Civil War, Blacks received 24 cents.
My focus in this article is on what happened next but it is also natural to compare the Higgs ca. 1870 benchmark with an ante-bellum counterpart. On the one hand, per capita income declined sharply in the South after the Civil War, absolutely and relative to income elsewhere in the nation (Engerman Reference Engerman1966; Goldin Reference Goldin1979). If the decline were shared proportionately by race, Blacks would have borne the greater brunt nationally, because relatively more were Southern, compared with Whites. On the other hand, the vast majority of Blacks before the Civil War were enslaved, and slaves were exploited in the neoclassical (economic) sense—they received “income” (primarily food, clothing, and shelter) less than the value of their marginal product at any point in time and over the life-cycle. Appendix A briefly discusses a range of (highly) provisional estimates of Black/White ratios for 1860; these are constructed in the same general manner as the 1870 and 1900 benchmarks (Higgs and mine).Footnote 6 The range of Black/White ratios is 0.22 to 0.31, with 0.26 as a plausible point estimate. This encompasses both the Higgs ca. 1870 benchmark and mine for 1870. The Civil War ended American slavery as it was known, but it does not seem to have led to an immediate increase in the relative per capita income of African-Americans.
Moving forward in time, between 1870 and 1900 Blacks managed to increase their average income relative to Whites by 11 percentage points, or from 0.24 to 0.35, according to the Higgs benchmarks. The relative progress was, however, short-lived. From 1900 to 1940 convergence in per capita income stalled completely—the Higgs benchmark for 1940 is 0.34, slightly lower than in 1900 (0.35).
After 1940 the series takes a decidedly upward turn. Between 1940 and 1960 the ratio grows at a steady pace, which then accelerates in the 1960s. But in the late 1970s the upward trend loses steam, and the pace of convergence after 1980 was much slower than during the proceeding four decades. In 2010, the most recent Census year, the ratio is 0.64—for every dollar of income accruing to a White person the average Black received 64 cents.Footnote 7
Over the 140 years between 1870 and 1910, therefore, the Black-White income ratio increased by 40 percentage points according to the Higgs-cum-census series. The increase is not uniformly continuous but occurs in a step-function or “episodic” manner in which periods of relatively strong, steady convergence are followed by periods of stasis (1900–1940) or slower convergence (1980–present). Although the post-WWII annual data display many ups and downs, there are no lengthy periods of “regression to the mean” during which the ratio returns to a previous level—that is, the gains experienced during the convergence episode are sustained. The convergence episodes are of moderate duration, approximately one human generation (1870–1900) or somewhat longer (1940–1980).
A consensus narrative has emerged to accompany the Higgs-cum-census series. That some racial convergence took place between 1870 and 1900 is very plausible. The vast majority of Blacks lived in the South before 1900, and events in that region dominate movements in the numerator of the income ratio. Post-Emancipation, former slaves were able to migrate on their own accord in search of better economic opportunities (Higgs Reference Higgs1977). Migration within the South was substantial, even if a large-scale flow to the North was still in the future (Boustan Reference Boustan2015). Adult Black illiteracy declined between 1870 and 1900, absolutely and relative to White; literates had higher incomes on average than illiterates, regardless of race (Collins and Margo Reference Collins, Robert A., Hanushek and Welch2006). In the six Southern states that kept records after the Civil War, Blacks accumulated taxable wealth more rapidly than Whites from 1870 to 1900 (Higgs Reference Higgs1982; Margo Reference Margo1984). Consistent with this, census data show Blacks moving up the agricultural ladder, especially in owner-operator status that increased from hardly any in 1870 to around a quarter in 1900 (Higgs Reference Higgs1977; Collins and Margo Reference Collins and Robert A.2011).
But a backlash followed. Black voting rights established for men under the 15th Amendment were drastically curtailed in the South in the late nineteenth century, and de jure segregation expanded its reach (Woodward Reference Woodward1955; Kousser Reference Kousser1974; Valelly Reference Valelly2004). When law alone proved inadequate to enforce White supremacy, Blacks were kept “in their place” through terror and violence. Working in the opposite direction to narrow the income gap, Black migration to the North increased when migrants got a “foot in the door” during and after WWI (Whatley Reference Whatley1990; Collins Reference Collins1997). The economic gains to migrants were substantial but evidently insufficient in the aggregate to further narrow the racial gap at the national level prior to WWII (Collins and Wanamaker Reference Collins and Marianne H.2014; Boustan Reference Boustan2015).
Convergence resumed in the 1940s. During the War the United States experienced a “Great Compression” in incomes. All incomes rose in real terms but especially those at the bottom, including Black incomes (Goldin and Margo Reference Goldin and A. Margo1992; Maloney Reference Maloney1994; Margo Reference Margo1995). Black migration from the rural South picked up substantially during the War, and there were special gains for those who found employment in the defense industry. Early attempts at federal anti-discrimination intervention into the labor market, such as Roosevelt's 1943 executive order also played a role in fostering racial convergence (Collins Reference Collins2001). Absolutely and relative to White women, Black women substantially increased their incomes and upgraded their occupational status after 1940 (Bailey and Collins Reference Bailey and William J.2006).
The gains of the 1940s were sustained in the 1950s, and then further enhanced during the Civil Rights Movement of the 1960s. In a famous article, John Donohue and James Heckman (Reference Donohue and James J.1991; see also Wright Reference Wright2013) identified 1963 to 1975 as the key period of “episodic change.” The locus was the South. By this time Black-White ratios outside the South were already relatively high, and significant convergence in the aggregate ratio required a reduction in the racial gap in the South. This gap did decline, and Donohue and Heckman argue that it did so largely in response to anti-discrimination pressure from the federal government.
Between 1940 and 1970 the Black-White income ratio rose by about 7.7 percentage points per decade. If this pace of convergence had continued for the next 40 years, the Black-White ratio in 2010 would have been 0.88, instead of its actual value of 0.64. As Figure 1 shows, convergence slowed markedly around 1979. There is a vast and ever growing literature in modern labor economics examining post-1980 racial differences, and no shortage of explanations for the convergence slowdown. A partial list would include de-industrialization, skill-bias technical change, and other forces leading to widening of wage inequality; the emergence of “bad ghettos” in the 1970s and related aspects of central city (economic) decline, some associated with the 1960s riots; a slowdown in racial convergence in educational attainment; mass incarceration and its attendant effects on employment and earnings; rising immigration; a slowdown in government employment, particularly at the federal level; a reversal of some of the political and regulatory gains of the Civil Rights era; and continued racial prejudice, less public than in the past but burrowed deeply into the nation's institutional framework and White consciousness.Footnote 8 It is far easier to list plausible causes of the post-1980 convergence slowdown than to convincingly quantify their relative importance, and I shall not attempt to do so here.
Revising Higgs: New Estimates of Black-White Income Ratios in 1870 and 1940
From my recounting it is clear that the Higgs benchmarks are an important part of the consensus narrative. I shall be revising these benchmarks but readers should keep in mind that the main point that Higgs (Reference Higgs1977, Reference Higgs, Shulman and Darity1989) wished to establish was that some convergence occurred before WWII, including during the post-bellum era. Not only do I reach the same conclusion, cumulatively the absolute amount of convergence in percentage points between 1870 and 1940—10 percentage points—is the same as Higgs. The difference is in how I allocate pre-WWII convergence before 1900 versus after.
My specifics of my revisions to the Higgs benchmarks and their rationale are described in detail in Appendix B. In brief, I contend that Higgs over-estimated Black per capita income in 1900 relative to white but underestimated it in 1870 and 1940.
The over-estimation of Black per capita income in 1900 occurs in part because Higgs over-adjusted for non-wage perquisites received by farm laborers and also overestimated their annual incomes; in addition, I argue that Higgs overestimated the average annual income of Black farmers. In 1870 and 1900 Higgs estimated Black per capita income first, and then computed White per capita income as a residual from the identity linking national per capita income to its race-specific components. Thus, if Black income is over-estimated, White income is too low, and the Black-White income ratio is overstated. I contend this happens in 1900. The Higgs 1900 benchmark is 0.35; mine is 0.32.
For 1870 my benchmark (0.28) is higher than Higgs (0.24) for two reasons.Footnote 9 First, I estimate a somewhat higher figure for Black agricultural income. Second, my estimate pertains to 1870 proper, whereas the Higgs benchmark pertains to 1867–1868 (and thus is c. 1870). Agricultural labor markets in the South were severely disrupted in the immediate aftermath of the Civil War, and it is plausible this temporarily depressed Black incomes.
For 1940 Higgs used a different procedure to estimate his benchmark, working directly with an equation for the Black/White ratio. As described in Appendix B, I argue that Higgs underestimated Black non-wage and salary income. Adjusting for this raises the Black/White ratio and thus my 1940 benchmark (0.38) is higher than the Higgs benchmark (0.34).
As shown in Figure 1, my new benchmarks alter the time path of Black-White convergence before WWII. Instead of convergence occurring entirely before 1900, with a flat trend from 1900 to 1940, the new benchmarks suggest that convergence was more or less continuous from 1870 to 1940. Here, an important caveat is that there are five census years between 1870 and 1940 for which there are, as yet, no benchmarks. It is possible that, with additional benchmarks, there would be less apparent continuity in convergence. For now, however, I take the implication that convergence was smooth at face value, and leave the estimation of additional benchmarks as an important topic for future research.
Robustness Check: Margo vs. Smith
Aside from the qualitative differences with Higgs in the timing of pre-1940 convergence, my new benchmarks show greater quantitative change between 1900 and 1940 than suggested by Smith (Reference Smith1984). However, a prima facie case can be made that that Smith understates the extent of pre-1940 racial convergence in male worker incomes. To understand why it is useful to review first how Smith originally made his estimates.
Although Smith labels his estimates as “income” ratios they are not. Rather, they are occupation-status ratios. Smith estimates national average, race-specific income-occupation weights for 1970 based on the federal census and he uses these (same) weights to value the race-specific occupation distributions for the census years 1890 to 1980. His Black/White ratios change only if Black men shift into higher income occupations (as measured in 1970) relative to White men.Footnote 10 Pointedly, they do not change when the wage distribution shifts.
Claudia Goldin and Lawrence F. Katz (Reference Goldin and F. Katz2008) show there was a secular decline in the returns to schooling from 1890 to 1940. During the post-WWII period, there is a significant negative correlation (time series or cross-section) between relative Black incomes and the returns to schooling—that is, when returns to schooling decrease Black-White income differences narrow, and vice versa (Maloney Reference Maloney1994; Margo Reference Margo1995; Juhn, Murphy, and Pierce Reference Juhn, Murphy, Pierce and Koster1991; Bayer and Charles Reference Bayer and Charles2015). There is no reason to suppose a different dynamic before WWII. Because Smith's income weights are constant, they cannot, by design, accommodate the plausible impact—positive—of the pre-1940 decline in the returns to schooling on Black-White income convergence.Footnote 11
Second, in the late nineteenth century per capita incomes in the South were far below the national average (Engerman Reference Engerman1966; Goldin Reference Goldin1979). The overwhelmingly majority of the African-American population lived in the South at the time, a far higher percentage than Whites. Economically speaking, Black workers suffered from a substantial income “spatial mismatch” across states, primarily one of region—the South versus the non-South. I shall have more to say about spatial mismatch later. Here, I simply point out that at the national level the Black/White income ratio in the aftermath of the Civil War would have been far below one even if both races received the per capita income of the states in which they resided.
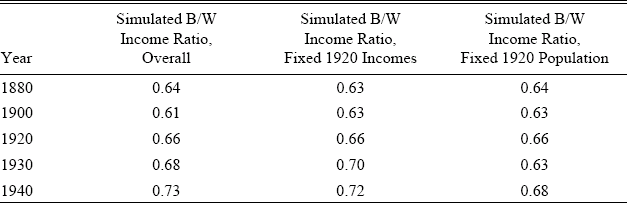
Over time, there was pressure on the Southern economy to converge on the non-South through out-migration, capital inflows, and factor price equalization. Table 1 presents three simulated Black-White income ratios. These are measures of Black cross-state “spatial mismatch.”Footnote 12 The first computes the Black/White ratio multiplying state per capita incomes by the race-specific population shares for the given year. This captures the overall change in spatial mismatch. The second holds per capita income constant at the 1920 level but allows population shares to change over time; this captures the migration, or population redistribution effect. The third holds population shares constant at 1920 levels but allows per capita income to change. This is the “regression to the mean” effect.
BLACK/WHITE CROSS-STATE SPATIAL MISMATCH, 1880–1940

Notes:
The columns in this table are produced by multiplying state per capita income by race-specific population shares by state, summing across states, and dividing the Black total by the White total. In column 1, per capita income and population shares are for the given year (e.g., 1880). In column 2, income per capita is held fixed and population shares vary across years. In column 3, income per capita varies across years and population shares are held fixed at 1920 values. Race-specific population totals are from the Census.
Source:
Per capita income data, Richard Easterlin (Reference Easterlin1960); Population data, United States Department of Commerce (1975).
Overall, Black cross-state spatial mismatch worsened slightly between 1880 and 1900. However, after 1900, mismatch declined. Most of the erosion occurred because of the spatial redistribution of the Black population but some, particularly in the 1930s, happened because of regression to the mean. A portion of the population redistribution effect is captured by Smith because some transitions of Black labor out of agriculture are positively correlated with migration out of the rural South.Footnote 13 None of the regression to the mean effect—4 percentage points in total between 1880 and 1940—is, however, captured by Smith. Overall, it seems plausible that Smith's ratios understate the extent of racial income convergence among adult men prior to WWII and, as such, the overall extent of Black-White convergence in per capita income.
To conclude the first half of the article, I have reviewed the long-run history of Black/White per income differences. In addition, I have revised pre-WWII benchmark estimates of Black/White per capita income ratios. The caveats just noted aside, the revised benchmarks do not change the overall amount of convergence before WWII but do indicate a smoother time path, with one major medium-run transitional deviation that occurred between 1940 and 1980.
INTERPRETING THE TIME SERIES: INTERGENERATIONAL TRANSMISSION
“But what on earth is whiteness that one should so desire it? Then always, somehow, some way, silently but clearly I am given to understand that whiteness is the ownership of the earth forever and ever, Amen!”
—W. E. B. Du Bois, Darkwater
Between 1870 and 2010 the Black/White ratio of per capita income increased from 0.28 to 0.64, or by 36 percentage points. Ten points of the increase, or about 28 percent, occurred before 1940—the midpoint of my long run—with remainder, 26 points (72 percent) occurring after. There is still a large racial divide in income but, relatively speaking, the divide is much smaller than in 1870 or 1940. This has two basic implications, as previously noted. Because we have come fairly far, it is much easier to find examples of economically successful African-Americans today than in the distant (or not-so-distant) past. Because we have far to go it is, regrettably, easy to find numerous contemporary examples of Black poverty.
In this section I focus not on the ups and downs of convergence per se but rather its long run pace. Assuming a human generation to be 25–30 years in length there are roughly 5–6 generations between 1870 and 2010. On average, each generation experienced a 7.7 percentage point increase in the Black-White income ratio. How shall we interpret this number? As a way of approaching this question I propose to think in terms of a model of intergenerational transmission of inequality (Becker and Tomes Reference Becker and Tomes1979; Solon Reference Solon1992, Reference Solon2014, Reference Solon2015).
Race and Intergenerational Transmission: A Model
By “intergenerational transmission” I am referring to the relationship between economic status in generation t and status in the previous generation, t − 1. In economics, interest has mushroomed with the availability of modern household panels, such as the Panel Study of Income Dynamics and the National Longitudinal Survey, which track households across generations (see, for example, Solon Reference Solon1992; Mazumder Reference Mazumder2005; Aaronson and Mazumder Reference Aaronson and Mazumder2008; Black and Devereux Reference Black, Paul J., Ashenfelter and Card2011; Davis and Mazumder Reference Davis and Mazumder2013). The canonical regression is given by equation (1):

Here, yt is income, t is the current generation and t − 1 the previous generation; ε is an i.i.d. random error; and β is the intergenerational elasticity (IGE). In estimating the IGE steps need to be taken to reduce the effects of transitory variation in income over the life-cycle, otherwise, β will be biased towards zero.Footnote 14 When this is done, modern IGE estimates for the United States fall in the range of 0.3 to 0.6, with 0.5 being a focal point (Solon Reference Solon2015). Historical estimates are less common and are almost never truly comparable with modern estimates, because historical estimates typically measure the transmission of occupation or occupational status rather than income per se (Ferrie and Long Reference Ferrie and Long2013; Olivetti and Paserman Reference Olivetti and Paserman2015). This caveat aside, historical estimates also tend to fall into the same numerical range (see, for example, Olivetti and Paserman Reference Olivetti and Paserman2015).
In expectation, equation (1) gives predicted or average mobility across generations—if a child grows up poor, on average the child may or may not be as poor as an adult. The expectation depends on initial conditions—how poor the upbringing—and the magnitude of the IGE. If the IGE is close to zero, there is little or no correlation on average between poverty as a child and as an adult. However, if the IGE is one, there is perfect immobility on average.
In applying this logic to the problem at hand, the idea is that, even if generation t-1 of Blacks has much lower income than Whites in t-1 on average, if β = 0.5 there should be fairly substantial “regression to the mean” evident in generation t, again on average. As an example, suppose the IGE ca. 1870 is 0.5 and the initial Black-White income ratio is 0.28. The predicted Black-White income ratio one generation later, ca. 1900, is 0.53.Footnote 15 This is far higher than my 1900 benchmark, 0.32—that is, equation (1) seems to over-predict the extent of convergence in the late nineteenth century.
Alternatively, we could start with a ratio of 0.32 in 1900 (my benchmark), and predict the ratio in 1930. The predicted ratio is 0.57. There is no benchmark for 1930, but if there were it is inconceivable it would be this high. In 1980, the income ratio is 0.58; with an IGE of 0.5, the predicted ratio in 2010 is 0.76, compared with an actual ratio of 0.64. The general pattern, then, is that an IGE of 0.5 significantly over-predicts racial convergence across adjacent generations. A partial exception is mid-century. If I start with my 1940 (1950) benchmark of 0.38 (0.41), the predicted ratio for 1970 (1980) is 0.62 (0.64), which is not much higher than the actual ratio of 0.57 (0.58).
To solve the over-prediction problem, labor economists propose adding a “group fixed effect” to equation (1) (Becker and Tomes Reference Becker and Tomes1979; Hertz Reference Hertz2007; Bhattacharya and Mazumder Reference Bhattacharya and Mazumder2011; Mazumder Reference Mazumder2014). The group effect is negative, implying less intergenerational mobility for Blacks than for Whites, controlling for income in the previous generation. In an instructive mathematical example, Gary Solon (Reference Solon2015) shows that a group fixed of the correct magnitude will reproduce the pattern of Black-White convergence across generations, and yet maintain an individual-level IGE in the standard range within race.Footnote 16
In thinking about this standard fix, I wish to stress two points. First, equation (1) does not describe a causal mechanism. The underlying “cause” of the Black-White income ratio in the current generation is not the income ratio in the previous generation.Footnote 17 Rather, there are causal factors that determine income in today's generation, along with race and “luck” (the error term). These causal factors are transmitted across generations—along with racial identity itself, because the groups have to be reproduced for the group effect to be economically meaningful.
Second, in quantitatively assessing the factors accounting for the pace of convergence over time, we can only do as well as the data permit. I believe that if we could better measure the factors explaining income in each generation as well as how racial identity affected the ability of each generation to acquire these factors (or not), social scientists could better account for the pace of racial convergence in the long run.
To facilitate this argument I sketch a toy intergenerational model that allows for an endogenous race effect. The model, inspired by Stuhler (Reference Stuhler2014) and Nybom and Stuhler (Reference Stuhler2014), focuses on labor income.Footnote 18 There are three equations:


Here as before, y is income and t indexes the generation. The variable r is racial identity, or “whiteness”—recall the quote from DuBois that opens this section; h is “human capital” and the β's are their market prices; βr > 0 and βh > 0. Racial identity and human capital are transmitted from generation t − 1 to t via the λ parameters and subject to the error terms.
The model is obviously simplified in the extreme. Equation (2a), for example, subsumes any explicit role for labor force participation or gender in the analysis of racial convergence.Footnote 19
Equations (2a) and (2b) are reduced-form shorthand for highly complex processes that are difficult to model formally but which can be described verbally, albeit with limited rigor.Footnote 20 The processes begin very early in life, indeed, in utero. In infancy and early childhood, r and h are produced close to home which may include interactions with siblings and other relatives, including prior generations (e.g., grandparents), friends, and neighbors. Children then venture forth, interacting with their peers and other adults (e.g., teachers) away from home—for example, in school or neighborhood play. The nature and extent of these interactions remains affected by the home environment, to which may be added institutions and social norms, technology, and the government. Finally, children become young adults and leave home with their stocks of r and h, forming households of their own, starting the process anew.
Racial Identity
Importantly, equation (2c) includes a direct role for racial identity to affect human capital development. This occurs primarily because “social capital” matters in human capital production and because racial identity influences access to institutions and social networks complementary to human capital production (Loury Reference Loury, Wallace and LaMond1977, Reference Loury2002; Bowles, Loury, and Sethi Reference Bowles, Loury and Sethi2014; Chay and Munshi Reference Chay and Munshi2015). The presumption is that γ > 0 because of de jure and de facto segregation. De jure segregation matters because, historically, Blacks were legally excluded from or discriminated against access to institutions that would have promoted human capital development, the most obvious example being education. De facto segregation matters because social capital and institutional access continue to be correlated with racial identify even without the force of law.
In Appendix C I derive the formula for the IGE for income in generation t and t-1 in the model. The formula reveals that the IGE can be substantial, causing racial convergence to be slow. This will happen if r and h explain most of the variance in ln y and intergenerational transmission of r and h is strong (the λ's are close to one). When coupled with very large initial gaps in r and h, these conditions create “intergenerational drag” making racial inequality persistent (Margo Reference Margo1990). In what follows I shall focus mostly on intergenerational transmission of r and h—equations (2b) and (2c)—but I will return to the role played by the β parameters at the end of the section.
As I conceive it, racial identity is not readily observable by the econometrician except for one correlate—namely, whether individuals are classified in a census-type survey as Black or White. We might assume a cutoff value, r∗, such that if r < r∗, the individual is classified as Black and if r > r∗, as White.Footnote 21 Although racial identity is not readily measurable in a statistical sense, it can be described. It is, to be sure, complexion, but it is much more than skin color—for example, behavior, dress, speech, and naming patterns.
There can be little doubt that λr has been close to one, right up to the present day. The proximate cause is the extraordinary low rate of formation of racially mixed Black and White households, historically and at present, coupled with high rates of residential and social segregation (Cutler, Glaeser, and Vigdor Reference Cutler, Glaeser and L. Vigdor1999; Fryer Reference Fryer2007). To be sure, racial intermarriage was illegal under state law in many states until the Supreme Court declared such legislation unconstitutional in Loving v. Virginia in 1967. But even in places where marriage between Blacks and Whites was legally permitted prior to Loving, it was still very rare. Until quite recently in American history, the multitude of factors that kept Black women from forming households with White men with greater frequency, or (even more strongly) Black men with White women were extremely rigid and severe. Consequently, the very great majority of Black children had (and have) Black parents—white children, White parents.
The primary gap in racial identity was and is between-race. But within the Black population there is also a long history of social differentiation. The origins of the differentiation can be traced to slavery, in which light-complexioned chattel commanded a higher market price (Bodenhorn Reference Bodenhorn2015). Sexual contact between master and slave was not infrequent, with the consequence sometimes being light-complexioned progeny. Mixed-race individuals—mulattos—account for approximately 20 percent of the Black population in 1910. For the post-Civil War censuses that so enquired there is abundant evidence of positive correlations between mulatto status and socioeconomic outcomes (Bodenhorn Reference Bodenhorn2015).
Beyond complexion there was differentiation with respect to behavior and other characteristics. In her remarkable memoir Negroland, Margo Jefferson (Reference Jefferson2015) writes about her childhood growing up among Chicago's Black elite, a tiny sliver of economic privilege. Jefferson's father was the chief of pediatrics at Provident Hospital; her mother, a “socialite” (p. 8). Jefferson played piano, attended Interlochen arts camp in Michigan in the summer, graduated from the University of Chicago Laboratory School and later Brandeis. Her parents warned her that “few Negroes enjoyed their privilege and plenty” (p. 163). She was taught to have “gloves, handkerchiefs, pocketbooks for each occasion … [g]ood diction … skin care (no ashy knees or elbows); hair cultivation … [m]anners to please grandparents and quell the doubts of any white strangers loitering to observe your behavior in schools, stores and restaurants” (p. 165). To become pregnant and drop out of college was the equivalent of “matricide”; a girl who slipped up “destroyed the good reputation her mother, her grandmothers and her grandmothers’ grandmothers had fought for since slavery” (p. 166). The elite believed that other Blacks should “be emulating us when too many of them (out of envy or ignorance) went on behaving in ways that encouraged racial prejudice” (p. 3). To themselves the elite were “self-designated aristocrats, educated, affluent, accomplished” but to Whites they “were oddities, underdogs, and interlopers” (pp. 90–91).
Perhaps the most extreme historical manifestation of differentiation within the Black population was racial “passing.” Instances of racial passing can be inferred when an individual who was classified as Black in one census shows up as White in another. To pass at all required a person not only to be sufficiently light-skinned but also exhibit sufficient “whiteness” in all other respects to be credible within one's social and residential network, which may explain why passers are found more frequently among migrants settling among dark-complexioned, foreign-born Whites. Recent advances in computing have permitted economic historians to investigate the quantitative extent of racial passing, although it may be some time before a consensus is reached on the magnitudes (Mill and Stein Reference Mill and Stein2012; Nix and Qian Reference Nix and Qian2015). For my argument, what matters is not the exact percentage of the Black population that passed at some point before WWII, but that passing was not extraordinarily uncommon—which appears to be the case.
Changes in racial identity that served to assimilate Blacks into the majority culture would tend to push λr away from one. But working in the opposite direction is the historical development of a distinctive, shared “Blackness” creating pressures against “acting white” (Austen-Smith and Fryer Reference Austen-Smith and Fryer2005; Fryer and Torelli Reference Fryer and Torelli2010; Fryer et al. Reference Fryer, Kahn and Levitt2012). It is sometimes argued that this development was largely a manifestation of the Civil Rights Movement but there is abundant evidence that it long pre-dates the 1960s. An important and recently studied example involves naming patterns. Black parents were giving their offspring distinctively Black names in the early twentieth century, long before the practice become common in recent decades (Fryer and Levitt 2Reference Fryer and Levitt004b; Cook, Logan, and Parman Reference Cook, Logan and Parman2014).Footnote 22
The earlier discussion speaks to the supply-side of racial identity. But there is also a demand side, and this is reflected in the portion of βr that represents pure racial discrimination in the economic sense. Discrimination must reflect prejudicial tastes as in Becker (Reference Becker1957) or imperfect information as in Arrow (Reference Arrow1973), or some of both. But tastes or imperfect information is not deus ex machina. The transmission of racist attitudes across generations plays an important role—as Oscar Hammerstein II put it succinctly in one of the songs from South Pacific, “You've got to be carefully taught.”
There is no doubt that public expressions of racial prejudice in their most extreme forms have diminished over time in the United States. In the early twentieth century popular culture was permeated by racial stereotypes. The expression of racial epithets by public figures was unremarked upon, with little or no consequence to the perpetrator. But gradually attitudes began to change and society no longer tolerated overt expressions of racial prejudice by public figures. Various features of Black culture and racial identity entered the mainstream. This is different, of course, from what people carry in the hearts and minds. Nevertheless, it seems reasonable to argue that βr today in the United States is smaller in absolute value than was the case early in the twentieth century, in part because of local, state, and federal anti-discrimination legislation but also because of the secular decline of overt prejudice (Neal and Johnson Reference Neal and William R.1996; Fryer Reference Fryer, Ashenfelter and Card2011).
Human Capital
The second component of my argument invokes human capital. I am arguing that λh is substantial and, moreover γ, which is the race-specific component of human capital production, has also been large at various historical junctures.
To illustrate the argument, I will focus on schooling and location at some length, but the same general argument applies to other forms of human capital. There are many cognitive and non-cognitive skills that are shaped within households, institutions, and social networks and, as such, are transmitted across generations. Historically, Blacks were at risk of violence from Whites if they violated prevailing social norms of behavior. These norms required Blacks to behave deferentially or face reprisal (Higgs Reference Higgs1977). Although I know of no conclusive, causal analysis it is not a stretch to argue that the sort of deferential behavior that shielded Blacks from personal violence in the Jim Crow era could easily have impeded economic success in the broader economy. Health status is another feature of human capital for which there was a large initial gap (Steckel Reference Steckel1986). While in the long run there has been significant convergence in relative Black health, especially in life expectation at birth, convergence is far from complete (Boustan and Margo Reference Boustan2015).Footnote 23
HUMAN CAPITAL: SCHOOLING
The vast majority of slaves received no education. Antebellum free Blacks in the South were also severely constrained in their schooling opportunities, if somewhat less so than slaves. Black children in non-Southern states could (and did) attend school before the Civil War but were a small fraction of the Black population at the time.
Consequently it is not surprising, if depressing, to find extraordinarily high rates of Black illiteracy in 1870, the first post-bellum census. In 1870, 79.1 percent of the Black population age 20 and older was illiterate, compared with 8.3 percent of the Whites, implying a racial illiteracy gap of 70.8 percentage points. Illiteracy here corresponds to total inability to read or write in any language, implying no schooling whatsoever.
Economic historians and labor economists have stressed that the initial racial illiteracy gap eroded fairly quickly over time (Higgs Reference Higgs1977; Smith Reference Smith1984; Margo Reference Margo1990; Collins and Margo Reference Collins, Robert A., Hanushek and Welch2006). By 1930, 18.6 percent of Blacks ages 20 and older were illiterate compared with 3.4 percent of Whites, a racial gap of 15.4 points. This represents a reduction of 55 percentage points over six decades (1870–1930).
The racial gap in illiteracy could have narrowed through widespread teaching of adult Blacks. This never happened. Instead, the gap eroded as successive generations of Black children attended school. The vast majority of these were public schools established in the ex-Confederate states as a condition for returning to the Union. These schools were de jure segregated about which I will have more to say momentarily but my point here is that the schools were crucial to the erosion of the illiteracy gap. Had they not been established in the first place or had emancipation been delayed, the racial illiteracy gap would have persisted (Collins and Margo Reference Collins, Robert A., Hanushek and Welch2006, p. 119). In 1870 just shy of 10 percent of Black children ages 5–19 attended school at some point during the census year, compared with 53 percent of White children, a racial gap of 43 percentage points. In 1930, the last year the literacy question was asked, the racial gap in school attendance in the same age group had declined to 11 percentage points, a reduction of 32 percentage points again in two generations.
The substantial reduction in Black illiteracy after 1870, therefore, would seem to belie the claim that the initial racial gap in human capital gap eroded slowly across generations. But the reduction in Black illiteracy overstates the erosion of the human capital gap because census literacy could be achieved through a quite limited exposure to formal education—as little as two years (Margo Reference Margo1990). On its own, the racial gap in literacy can explain statistically only a relatively small part of the racial difference in occupational status before WWII, leaving a much larger role for a race dummy in any regression (Collins and Margo Reference Collins, Robert A., Hanushek and Welch2006).
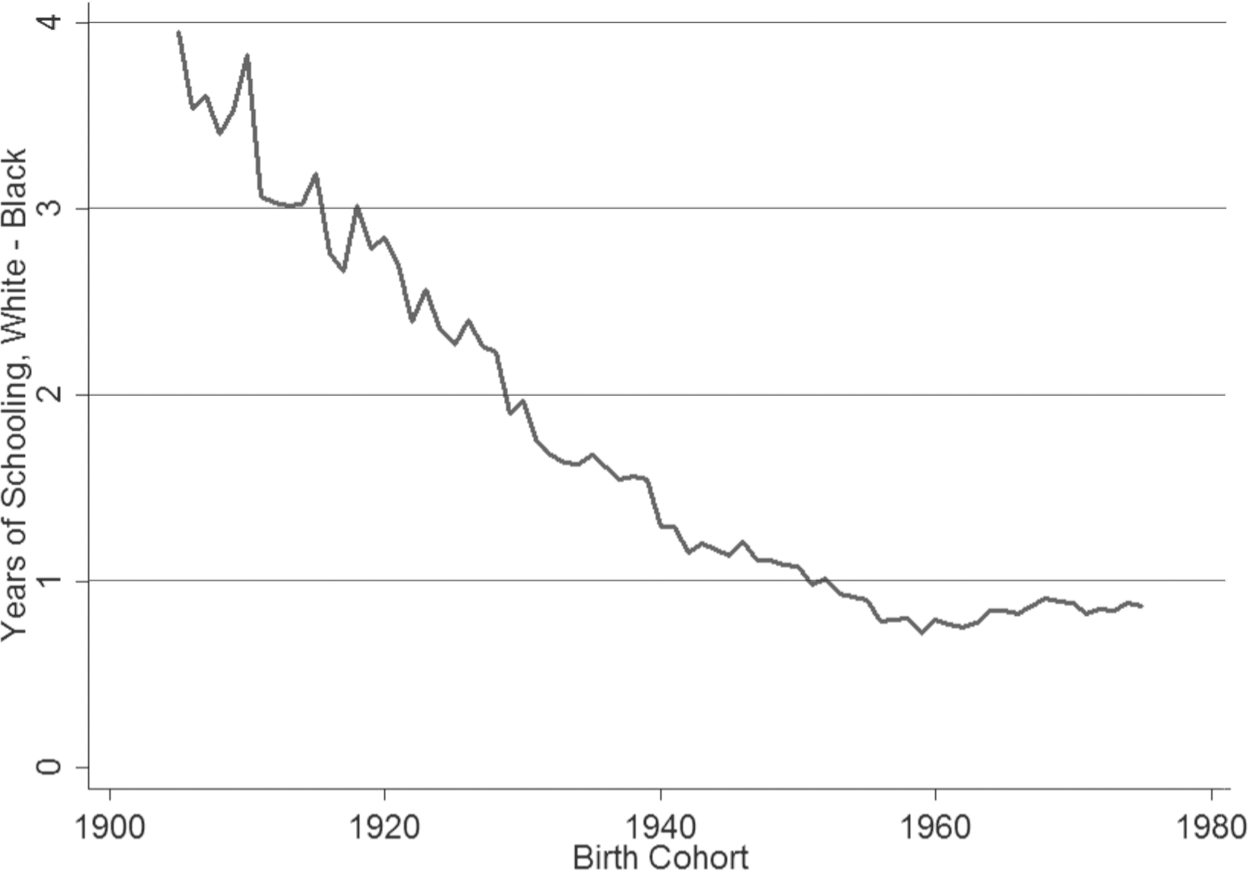
It is possible to go beyond literacy and say something about long-run trends in the racial gap in educational attainment. The 1940 census is the first national survey to ask about years of schooling. The post-1940 censuses and related surveys (for example, the Current Population or American Community Survey) routinely do so. Combining these various sources yields an annual time series of educational attainment by birth cohort. Figure 2, which is from Goldin and Katz (Reference Goldin and F. Katz2008), shows the racial gap (White—Black) in educational attainment by birth cohort, measured at age 35. The series begins with the 1905 cohort, because this is the first to have its educational attainment measured at age 35 contemporaneously—that is, in the 1940 census.
THE RACIAL GAP IN YEARS OF SCHOOLING AT AGE 35

Figure 2 reveals that the racial schooling gap narrowed more or less continuously from the earliest birth cohort represented in the diagram (1905) until cohorts born in the 1960s, at which point convergence ceased. Convergence in years of schooling occurred against a backdrop of rising educational attainment nationally. Blacks caught up with Whites in elementary school graduation rates and, later, in attending high school. Convergence ceased at about the same time educational attainment began stagnating for the overall population—that is, the point at which college graduation became more or less a necessary (if not sufficient) condition for upward mobility and a middle (or upper) class lifestyle. Unfortunately, the absence of any narrowing of the attainment gap in recent decades is one of many reasons why racial convergence in per capita income has stalled since 1980.
What about the pre-1905 cohorts? There is a long tradition of using the 1940 data to back-cast attainment by race for cohorts born in the nineteenth century (Smith Reference Smith1984). However, there are serious pitfalls in doing so that may bias the trend in the racial gap. We may never know the exact course of the racial attainment in schooling for post-bellum cohorts but plausible estimates suggest that the gap did narrow more or less continuously over time (Margo Reference Margo1986a,b)—but, crucially for my argument, more slowly than the erosion of the literacy gap.
Further, Figure 2 significantly understates the racial attainment gap at any point in time because it is not adjusted for racial differences in the quality of schooling. The public schools established for Blacks in the South just after the Civil War were legally separate but, for two decades or so were (mostly) equal, in the sense that expenditures per pupil and other measures of school inputs were similar by race. But, relative to schools elsewhere in the country, the Southern schools were poor in quality. Most Black children received their instruction in such schools until a significant share of the adult Black population had left the South and began having children and sending them to school elsewhere in the country. In the late nineteenth and early twentieth century a gap in school quality between Black and White schools emerged, reaching a peak around WWI (Margo Reference Margo1990). From that point on the gap began to narrow, slowly at first and then more rapidly in the decade or so prior to the Supreme Court's decision in Brown v. Board of Education.Footnote 24 At the time of the decision, Southern schools were probably more “equal” than at any time since Reconstruction, but they were still of lower quality than elsewhere.
Economic historians have attempted many times to gauge the economic impact of racial differences in the quantity and quality of schooling. The most recent study, and in my view the best to date, is by Celeste K. Carruthers and Marianne H. Wanamaker (Reference Carruthers and Marianne H.2016), who match earnings data for Southern-born adult men in 1940 with data on school inputs in the counties where the men grew up. Carruthers and Wanamaker find that 40–51 percent of the racial earnings gap can be explained by racial differences in the quantity and quality schooling, a very substantial proportion. The Carruthers and Wanamaker study pertains to the South. We have no good sense how large racial differences in school quality were outside the South before WWII and their importance in the labor market at the time.
The upshot is that γ was probably large during most of the era of de jure segregation in public education. We know from the important study by Ashenfelter, Collins, and Yoon (Reference Collins, Robert A., Hanushek and Welch2006) that legal dismantling of de jure segregation started by Brown hastened the pace of Black-White convergence across cohorts, suggesting a decline in γ in absolute value. But we also know that desegregation did not happen overnight and that school districts in the United States are still separate and unequal through the influence of de facto segregation, implying that γ is still positive. A small army of labor economists today continues to measure the relative quality of Black educational outcomes, typically focusing on test scores. A racial gap in test scores now emerges very early in school, and it remains stubbornly present in later grades, even after controlling for a long list of family background and school variables (Fryer and Levitt Reference Fryer and Levitt2004a, Reference Fryer and Levitt2006).
Thus, while research on the historical evolution of racial schooling gaps can and should continue, it is almost certainly the case that the gaps as measured at any point in time understate true racial differences. It is also possible that these systematic measurement problems are worse today than in the past when schooling levels were much lower, implying that the extent of long run racial convergence is significantly less than suggested by Figure 2.
HUMAN CAPITAL: LOCATION
As pointed out previously, another important initial gap was spatial mismatch. Following Larry A. Sjaastad (Reference Sjaastad1962), this is a type of human capital in the model. The initial spatial mismatch pertained to region. Like the schooling gap, this gap eroded over time slowly and somewhat irregularly, and much later, morphed into a different character.
The timing and rate of Black outmigration from the South is a perennial topic in American history (Wright Reference Wright1986). The incentive to leave was present immediately after the Civil War. The first generation of ex-slaves did move around within the South but as my calculation shows, this had little effect on aggregate mismatch. Movement from the South received a large boost during World War One, in part due to the decrease in European immigration that continued in the 1920s with the imposition of quotas (Collins Reference Collins1997; Boustan Reference Boustan2015). Prior to this time, the limited Black migration out of the South was positively selected but during the first wave of the “Great Migration,” migration was more general (Margo Reference Margo1990, Collins and Wanamaker 2Reference Collins and Marianne H.015b). Outmigration slowed during the Great Depression but regional mismatch continued to decline because incomes and employment in the South took less of a direct hit during the downturn. The second wave of the Great Migration came during, and shortly after World War Two and continued through the 1950s. In the process the Black population was transformed from overwhelmingly rural to overwhelmingly urban.
As Blacks moved into cities, distinct Black neighborhoods began to form and the level of residential segregation increased (Cutler, Glaeser, and Vigdor Reference Cutler, Glaeser and L. Vigdor1999). There is mixed evidence of the effects of residential segregation on Black economic outcomes, at least before 1970. On the one hand, segregation appears to have slowed the rate of growth of Black homeownership (Collins and Margo Reference Collins and Robert A.2011). On the other, the segregation pertained to race and not income, and thus Black communities in the period were diverse in social class. This diversity may have created positive externalities that promoted human capital investment in lower income households, increasing the pace of racial convergence (Cutler and Glaeser Reference Cutler and Edward L.1997).
After the passage of federal fair housing legislation in the late 1960s and subsequent efforts to enforce it, middle and higher income Black households began to suburbanize, causing Black residential communities in central cities to be less socially and economically diverse. As Cutler and Glaeser (Reference Cutler and Edward L.1997; see also Collins and Margo Reference Collins and Robert A.2003) show this was a factor in the emergence of so-called “bad ghettos.” After 1970 higher levels of residential segregation are associated with a greater incidence of non-employment, out-of-wedlock births, and poverty in general. But even before this, the economies of urban Black neighborhoods came under stress as jobs started to suburbanize in the 1950s, before the Black population could follow. This created another spatial mismatch, one that was not regional as at the turn of the twentieth century but instead was intra-metropolitan (Kain Reference Kain F.1968). This mismatch, too, has diminished over time as residential segregation has lessened but it remains a significant problem to the present day (Boustan and Margo Reference Boustan and Robert A.2009).
Wealth
As specified my theoretical model pertains to labor income. To incorporate wealth properly requires modeling intergenerational transfers and consumption-savings decisions (White Reference White2007). I shall leave the extension for another day but will review here the evolution of racial differences in wealth as far as it is known.
On average, the initial post-slavery generation of African-Americans grew up in households that were extremely deprived in terms of physical and financial wealth. The 1870 census records the ownership and value of real estate wealth of every person, and personal property (excluding clothing) over $100 (1870) dollars. Black/White ratios derived from these data are, in various ways, inconsistent with modern ratios. For example, the 1870 census did not record debt, so the wealth data are gross, not net (worth). The $100 cutoff on personal property is non-trivial; for an (unknown) fraction of the population reporting zero personal property, the true value was greater than zero but less than $100.
Despite these problems, the 1870 census data are clear that, on average, adult Blacks had very little wealth relative to Whites. I have examined an IPUMS sample of adults ages 15 and over; for this sample, the mean Black/White per capita wealth ratio is 0.039, and the median ratio is exactly zero. These figures are not surprising. It would have been difficult for adult slaves to have accumulated wealth of any kind prior to Emancipation (DeCanio Reference DeCanio1979). The 1850 and 1860 censuses, which, like the 1870 census, inquired about wealth, suggest that free Blacks, too, had very little relative to the White population.
The 1870 census was the last in the nineteenth century to ask about the value of real estate and personal wealth. But six states, all in the South, collected information on taxable wealth by race and published the statistics on a regular basis. Like the 1870 census, the tax data indicated that, on average, Blacks had very little wealth relative to Whites. The data unequivocally suggest, however, that Blacks accumulated wealth more rapidly than Whites in the South after the Civil War, at least up to WWI (Higgs Reference Higgs1982; Margo Reference Margo1984).Footnote 25
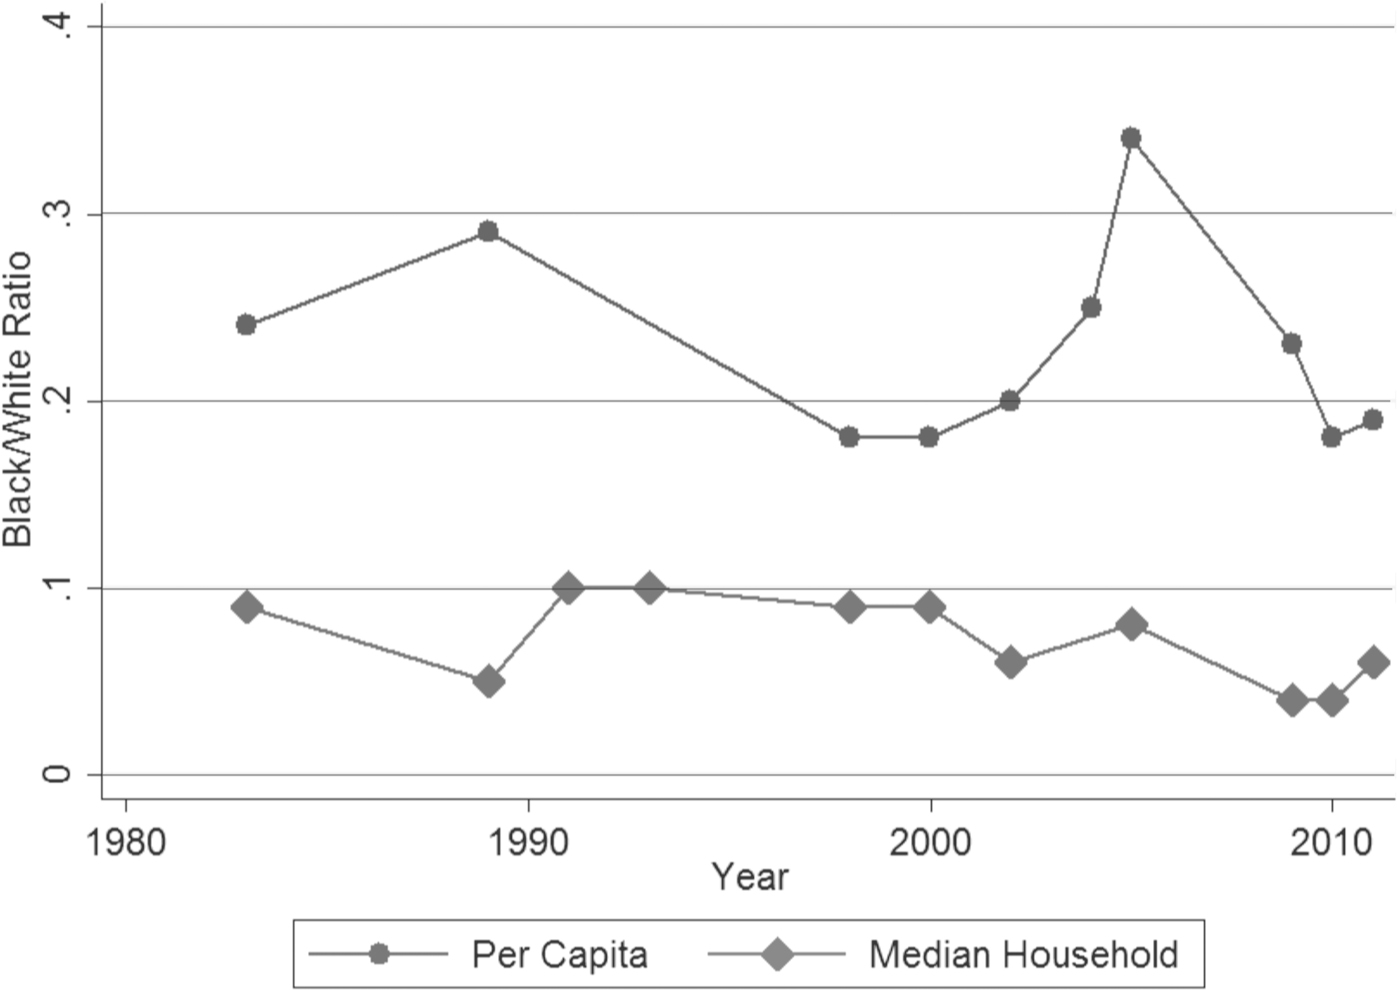
Other than home ownership (Collins and Margo Reference Collins and Robert A.2011) there are no nationally representative race-specific wealth data prior to WWII. After WWII there have been a variety of regular surveys of household wealth that also include information on race. The most widely used today are from the Census Bureau's Survey of Income and Program Participation (SIPP). Figure 3 shows Black/White wealth ratios, median and mean, from 1984 to the present based on the SIPP data. The unit of observation is the household, and the data refer to total net worth.
BLACK-WHITE WEALTH RATIOS, 1983–2012, PER CAPITA AND MEDIAN HOUSEHOLD WEALTH, CENSUS SIPP DATA

The typical Black household today has very limited net worth relative to the typical White household. From the early 1980s until 2005 the median ratio was stable at slightly less than 10 percent. The ratio declined in the Great Recession but shows some recovery very recently. For the years in which the SIPP survey has provided sample means by race, the Black/White ratio of mean wealth is typically twice as high (or higher) than the median ratio, but the mean wealth ratio is still far below the Black-White ratio of per capita income, implying a much larger racial gap in non-labor than in labor incomes.
Labor Market Prices
To summarize, a high degree of intergenerational persistence in the transmission of racial identity, human capital, and wealth, coupled with a belief that, properly measured, these causal factors, largely explain income differences (as opposed to random error) can go a long way in accounting for the slow pace of racial income convergence in the long run. However, as Appendix B shows, the IGE in my theoretical model also depends on the labor market prices (the β's) in equation (2a). I conclude this section with a brief discussion of how changes in these parameters might have affected the pace of racial convergence at different junctures after the Civil War.
Consider first the early twentieth century. The discussion earlier suggests that de jure segregation and racial discrimination, particularly in education, increased at this time. This would have increased the IGE, slowing racial convergence. However, as previously discussed, the returns to schooling decreased before 1940 as did the degree of cross-state spatial mismatch, which would have lowered the IGE, speeding up the convergence process. If my benchmarks are taken at face value, these effects more or less cancelled out, allowing convergence to continue apace in the four decades before WWII.
The pace of convergence between 1940 and 1980 was much quicker than before 1940. Here, the reduction in βh in the 1940s, which was largely sustained until the 1970s, lowered the IGE, as did a reduction in βr due to government anti-discrimination efforts, first in the 1940s and, later to much greater effect, during the Civil Rights movement (Donohue and Heckman Reference Donohue and James J.1991). Increases in the relative quality of Black schooling, some of which began before Brown v. Board of Education, and others that were a consequence of school desegregation, further reduced the IGE (Ashenfelter, Collins, and Yoon Reference Ashenfelter, Collins and Yoon2006). It is thus no accident that the standard intergenerational regression, with an IGE of 0.5, is reasonably good at predicting Black-White convergence in this period. However, during the period from 1980 to the present, there has been a substantial rise in the returns to human capital in the labor market. This serves to increase the IGE, both directly and also indirectly to the extent that there are still race-specific barriers to human capital production (a non-zero value of γ in the model) causing racial convergence to slow relative to the 1940–1980 period.Footnote 26
CONCLUDING REMARKS
“America is not another word for Opportunity to all her sons.”
—W. E. B. Du Bois, The Souls of Black Folk
The Black/White ratio of per capita income rose from slightly more than a quarter in 1870 to about two-thirds in 2010, a span of about five to six human generations. In the not so distant past in the United States, the gap in income between Blacks and Whites was more like a chasm and examples of economically successful African-Americans were uncommon. Today, they are many more examples, absolutely and relative to Whites, but Black poverty is still with us and will likely be for the foreseeable future.
I have argued that to understand racial economic progress in the century and a half since Emancipation, it is useful to think inter-generationally. At any point in time the labor market establishes prices on human capital and racial identity; Blacks earn less than Whites because there are racial gaps in human capital and because of racial discrimination. Labor market prices are affected by technical progress, supply/demand factors, and institutions. Black incomes are also lower because Blacks own much less of the capital stock. The gaps in human and physical capital today reflect the slow erosion across generations of what were extremely large initial differences in the aftermath of the Civil War. Modern labor economists have at their disposal many tools and much evidence to study intergenerational transmission in the United States today and its racial implications. To better understand why racial inequality has eroded so slowly in the United States, economic historians need to devote more attention to historical patterns of intergenerational transmission and how these played out in the ongoing evolution of America's most enduring dilemma.
Appendix A
I begin with Robert William Fogel and Stanley L. Engerman's (1974) estimate of slave per capita income in 1860 as reported in Richard K. Vedder (Reference Vedder1975, p. 455), $43 (in 1860 dollars). Bruce Sacerdote (Reference Sacerdote2005) argues that, within the Black population after the Civil War the intergenerational elasticity (IGE) was approximately 0.5 and that the gap in economic status—positive—between former free Blacks and ex-slaves eroded more or less completely by 1920. I will assume, therefore, that free Black per capita income in 1860 is 20 percent higher than slave per capita income ($52), as this is consistent with Sacerdote's findings.Footnote 27 In 1860 free Blacks were 11 percent of the total Black population, implying a figure of $44 for overall Black per capita income (= 0.89 × 43 + 0.11 × 52). Using Fogel and Engerman's (Reference Fogel and Stanley L.1974, p. 248) estimate of national per capita income in 1860, $128, and a Black population share of 0.14, White per capita income is $142, and the Black/white ratio is 0.31 (= 44/142).
Fogel and Engerman's estimate of slave income has been criticized as too generous or, equivalently, that their estimate of the expropriation rate is too low (David and Temin Reference David and Temin1974; Vedder Reference Vedder1975). If I adopt Vedder's estimate of $30 for slave income (I consider this a plausible lower bound) and perform the same calculation (again assuming a 20 percent income premium for free Blacks), the estimated 1860 Black/White ratio is 0.22 in 1860. If I adopt $35 as a middling estimate (see Vedder Reference Vedder1975, p. 455), the estimated 1860 Black/White ratio is 0.26.Footnote 28 As mentioned in the text, the range of estimates, 0.22 to 0.31, brackets the Higgs ca. 1870 benchmark (0.24) and my revision to it (0.28).
Appendix B
This appendix describes the construction of Figure 1, which includes my new benchmark estimates of Black-White per capita income ratios for 1870, 1900, and 1940, contrasting with previous estimates made by Robert Higgs (Reference Higgs1977, Reference Higgs, Shulman and Darity1989). I begin with the 1900 benchmark rather than 1870 because its estimation is the more elaborate of the two and the estimation of the 1870 benchmark uses some of the same assumptions Higgs made for the 1900 estimation.
1900: Higgs (Reference Higgs1977, p. 145) made benchmark estimates of the Black-White per capita income ratio for 1870 and 1900. The estimation begins with the following identity for per capita income:
Per capita income = (income per rural worker × rural labor force participation rate × rural population share) + (income per capita of the urban population × urban population share)
Higgs estimates the various components in this equation for Blacks, plugs these into the expression, and computes Black per capita income. Using an estimate of national per capita income and the percent Black, he backs out an estimate of White per capita income. His Black/White ratios for ca. 1870 and 1900 are based on these race-specific estimates.
The first step is to estimate income per Black farm laborer. Higgs (Reference Higgs1977, p. 64) uses daily wage rates for harvest and non-harvest labor, assuming 50 days of harvest work and 150 days of non-harvest work. This gives him an annual income estimate, which he then inflates to account for perquisites, including board (Higgs Reference Higgs1977, p. 99). There are two problems with his procedure. The daily wage rates he uses are quoted “without board”; these are higher than wage rates “with board,” the difference being the value of board per day. To impute board to wages quoted without board is double counting. Second, while some farm laborers were certainly hired by the day, most full time workers were hired monthly (or annually). On a per diem basis monthly wages were lower than daily wages because monthly pay included a compensating differential for unemployment risk (Margo Reference Margo2000).
My calculation begins with an estimate of average monthly wages of farm labor with value of board imputed for the South, taken from Margo (Reference Margo2004): $15.00.Footnote 29 I assume eight months of full time equivalent employment for farm laborers (this is slightly higher than Higgs), or $120 per year. This figure does not include perquisites other than board. I assume these to be worth $2.50/month of full time employment, which is 50 percent of the total value per month of perquisites assumed by Higgs (Reference Higgs1977, p. 99). This gives an estimate of $140 of annual income per full-time equivalent (FTE) farm laborer. To estimate the racial distribution of FTE farm laborers in the South in 1900, I use the 1900 IPUMS sample, assuming that FTE means four or fewer months of unemployment; my estimates are that FTE farm laborers were 51 percent Black and 49 percent White. Following Higgs I assume that Black farm laborers earned 10 percent less than Whites (a Black/White ratio of 0.9). My final estimate of income per Black farm laborer is $133.00.
For Black farmers, I divide these into owner-operators and tenants.Footnote 30 I begin with the procedure described by Abramitzky, Boustan, and Eriksson (Reference Abramitzky, Boustan and Eriksson2010, Appendix A, p. 29; see also Olivetti and Paserman Reference Olivetti and Paserman2015), which uses information reported in the Census of Agriculture to estimate owner-operator incomes. There is sufficient information reported in United States Bureau of the Census (1904) to apply the procedure for all farms operated by Black farmers and for Black owner-operators separately. For Black owner-operators the estimate is $300 per owner-operator.Footnote 31 For Black farmers overall, the estimate is $342. In 1900 25.2 percent of Black farmers were owner-operators; therefore, on farms operated by Black tenants, income per farm is estimated to be $356. I shall assume, following Higgs (Reference Higgs1977, p. 79) that half of this income was retained by the tenant, or $178. Thus, income per Black farmer is estimated to be $209 (= 0.252 × $300 + 0.748 × $178). These figures do not include any earnings off the farm; Higgs (Reference Higgs1977, p. 79) assumes these to be 20 percent of average farm income. Adopting this figure, annual income per Black farmer is $251.Footnote 32
Income per Black agricultural worker is a weighted average of income per farm laborer and income per farmer. I estimate the weights from the 1900 IPUMS, restricting the population to Blacks reporting to be in the labor force with no more than four months of unemployment, living in a rural area, and who report an occupation of farmer or farm laborer. The assumption on months of unemployment is an attempt to adjust for full-time equivalent employment. The weight for farm laborers is 0.54 and that for farmers is 0.46. Therefore, income per Black agricultural laborer is $133 × 0.54 + 0.46 × $251 = $187.
Next, I follow Higgs and assume that all rural Black workers earn the same amount as the average Black agricultural worker. I use the 1900 IPUMS to estimate the full-time equivalent labor force participation rate of rural Blacks. The initial estimate is 0.34, but this includes individuals who failed to properly answer the unemployment question in 1900 but who are coded by the IPUMS as a zero. I assume the true figure is 0.3 (slightly higher than Higgs, who assumes 0.25). My final estimate of rural Black per capita income is $56.
For urban Blacks, I adopt Higgs’ (Reference Higgs1977, p. 97) estimate of $100.Footnote 33 Per capita income is a weighted average of rural and urban = 0.77 × $56 + 0.23 × $100 = $66. This compares with $73 for Higgs. The final step is to infer White per capita income using the overall identity for national per capita income. For per capita income ($192) and the black population share (0.12) I use the same figures as Higgs (1977, p. 246). White per capita income is $209, so my estimated Black/White ratio is 0.32 (= $66/$209), compared with the Higgs (1977, p. 246) benchmark of 0.35.
1870: I begin by estimating income per Black farm laborer. Based on Margo (Reference Margo2004) I estimate a monthly average farm wage (with value of board imputed) of $20 per month for the South in 1870.Footnote 34 To this I add $3.00 for perquisites other than board.Footnote 35 I assume that, as in 1900, Black farm laborers earned 90 percent of the average for White farm laborers. I have no way of estimating FTE farm laborers by race in 1870, so I assume the same weights as in 1900, 51 percent Black and 49 percent White. The resulting estimate of the average monthly wage of Black farm labor is $21.80. As in 1900 I assume eight months of FTE employment, so income per Black farm laborer is $174. This compares with Higgs’ (Reference Higgs1977, p. 101) estimate of $150.
To estimate income per Black owner operator, I assume that the ratio of income to farm value in 1870 was the same as in 1900, 0.413. I use the 1870 IPUMS to estimate the average value of Black owner-operated farms (this is the total value of real estate reported to be owned by Black farmers in 1870 divided by the number of Black farmers reporting a positive value, $760).Footnote 36 My estimate of income per Black owner operator is $314. There are no published data comparable with those for 1900 to estimate tenant incomes in 1870; I shall simply assume that tenants earned on average 50 percent more than farm laborers, the same assumption made by Higgs (Reference Higgs1977, p. 101), or $264.
According to the 1870 IPUMS, 15 percent of Blacks who reported having a farm occupation (1950 codes) were farmers (occupation code 100 or 123), 13 percent of whom reported owning real estate; I consider the real estate owners to be owner-operators. My weights for the farm worker income estimate, therefore, are: farm laborer, 0.85; owner operator 0.02 (= 0.13 × 0.15), and tenant, 0.13. Income per farm worker is 174 × 0.85 + 264 × 0.13 + 0.02 × 314 = $189. As in 1900 I assume that rural nonfarm workers earn the same on average as rural farm workers. I use the same rural FTE participation rate as in 1900, 0.3, so rural per capita income is $57. This is virtually identical to my (nominal) estimate for 1900, so I assume that urban Black per capita income is $100, as in 1900. Thirteen percent of the Black population is urban in 1870, so my overall estimate of Black per capita income is $63. To put this into 1900 dollars, I follow Higgs (Reference Higgs1977, p. 101) and multiply by 0.6, or $38; this compares with Higgs’ estimate of $30.
I assume income per head in 1870 of $122 in 1900 dollars (slightly higher than Higgs, whose estimate of $111 pertains to 1867–1868).Footnote 37 For the Black population share I use an average of 1860 and 1880 census figures, 0.136. From the per capita income identity I back out White income, $135. The resulting Black/White ratio is 0.28 (= 38/135), compared with the Higgs benchmark of 0.24.
1940: The Higgs (Reference Higgs, Shulman and Darity1989, p. 26) benchmark for 1940 is based on the equation:

where E = is a weighted average of the “male earnings ratio” (0.45) from Smith (Reference Smith1984) and the female earnings ratio from Gwartney (0.36), with weights of 0.67 for males and 0.33 for females; L = 1.03, the ratio of Black labor force participants per capita to White labor force participants per capita, from the 1940 published census. Higgs sets the parameter β equal to labor's overall share of national income for 1937, 0.79, taken from John W. Kendrick (Reference Kendrick1961).Footnote 38
This calculation has several problems. First and most important, the equation will understate the Black/White ratio unless Blacks literally have zero non-labor income in 1940, which is surely incorrect. Second, the term β should be labor's share of total income among Whites, but as noted above the value actually used in the calculation pertains to labor's share of national income. The value among Whites will be lower than this, because the aggregate is a weighted average of race-specific figures, and labor's share for Blacks will be higher than for Whites (because Blacks derived relatively more of their income from labor; as just noted, Higgs’ calculation assumes that for Blacks, labor's share is one).
To compute my 1940 benchmark I start with a formula for the overall ratio. I use the 1940 IPUMS to estimate race-specific per worker averages of wage and salary income for persons who are in the labor force in 1940 and whose class of worker is wage and salary worker with at least $1 of wage and salary income in 1939, ages 15 and over. Under these assumptions, the Black/White ratio of earnings is 0.42. Such workers are 31.9 percent of the Black population (ages 1 and over) and 31.2 percent of the White population (ages 1 and over) in 1940. We do not know the share of wage and salary income in total income for Whites in 1940. I will assume that it is 0.78, very slightly lower than Kendrick's (Reference Kendrick1961) figure for the overall economy.Footnote 39 We also do not know per capita non-wage income by race in 1940; I shall assume it is 0.23.Footnote 40 According to the 1940 IPUMS, 17.8 percent of White population (ages 1 and over) received non-wage income of $50 or more in 1940 compared with 14.6 percent of the Black population; I assume these are accurate estimates of the shares receiving non-wage income of any amount.Footnote 41 My overall estimate of the Black-White income ratio in 1940 is 0.38 [= 0.78 × (0.42 × (0.319/0.312)) + 0.22 × (0.23 × (0.146/0.178))], compared with 0.34 for Higgs.Footnote 42
1948–2012: The basic source is http://www.census.gov/hhes/www/income/data/historical/people/, Tables P1, P3. For 1967–present the Census produces annual estimates of per capita income by race (Table P1). For 1948–present, the Census Bureau reports average annual earnings for persons age 15 and over, by race and sex (Table P3). I use the reported number of workers by gender to produce race-specific earning series for 1947–1966. Let BWEARN be the Black/White ratio of average annual earnings, BWPINC be the Black/White ratio of per capita income, and Z(t) = BWPINC/BWEARN for year t, t = 1967–2012. I compute the median value of Z(t); call this µ. My estimate of BWPINC(t) for t = 1948-66 is µ × BWEARN (t).
Appendix C
This appendix derives the IGE for the theoretical model in the text. To begin, I lag Equation (2a) by one generation:

I substitute [Eq. 2a] and [Eq. 2b] into [Eq. 2a] for generation t:

Here, ε∗ is a function of the error in y in generation t, lagged errors in the human capital and racial identity equations, and the various parameters.
I shall assume that all errors are uncorrelated with each other across equations within a generation and across generations; and that r and h are uncorrelated with the errors, within and across generations. I shall also assume that the variance-covariance matrix of y, r, and h has unit values on the diagonal. With these assumptions the IGE between generation t and t- 1 is given by equation (3):
![\[
\begin{array}
{\text{IGE}} ({\text{t, t}}-1) = (\upbeta_{{\text{h}}}^2 + \upbeta_{{\text{r}}}\upbeta_{{\text{h}}} \gamma)\lambda_{{\text{h}}} + \upbeta_{{\text{r}}}^2 \lambda_{{\text{r}}} + [\upbeta_{{\text{r}}}\upbeta_{{\text{h}}} (\lambda_{{\text{r}}} + \lambda_{{\text{h}}}) + \upbeta_{{\text{h}}}^2\lambda_{{\text{h}}}\gamma]\sigma_{{\text{rh}}} .
\end{array}
\](https://static.cambridge.org/binary/version/id/urn:cambridge.org:id:binary:20171103115853487-0855:S0022050716000590:S0022050716000590_eqn3.gif?pub-status=live)
As an example, suppose that βr = βh = 0.5, λr = λh = 0.8, γ =0.2, and σrh = 0.7. Then r and h explain 85 percent of the variance of ln y and the IGE is 0.75. Stuhler (Reference Stuhler2014) points out that in models of this type the multi-generational IGE—for example the correlation between generation t and t-2—decays more slowly than exponential. A high level of initial inequality, therefore, can persist across multiple generations.