Implications
Mastitis and somatic cell score economic value have been estimated to be approximately US$80.09 and US$86.17 per cow per year, respectively. Farmers can reduce mastitis incidence and increase dairy farm profitability if these traits are incorporated in a national selection index.
Introduction
Mastitis is an inflammatory disease of the mammary gland generally caused by intramammary infections. Mastitis is the most common and the most costly disease of dairy cattle. In addition to the cost of veterinary treatments, decrease in milk yield and quality, reduced lactation persistency, early culling, increased labor and replacement costs, mastitis causes cows to suffer (Seegers et al., Reference Seegers, Fourichon and Beaudeau2003). Milk from infected or treated cows can cause problems in the milk processing industry, for example, in cheese manufacturing. Subclinical mastitis can only be detected by measuring inflammatory response (leukocytes or white blood cells) and pathogens in the milk. Several methods for the large-scale detection of subclinical mastitis have been suggested (Kitchen, Reference Kitchen1981). The most common is to monitor the somatic cell count (SCC), which is widely recorded in many countries as part of the milk recording routine in dairy herd improvement programs.
As an indicator of both clinical mastitis (CM) and subclinical mastitis, SCC has several desirable attributes. Somatic cells are objectively measured on a continuous scale and become normally distributed following log-transformation. The heritability of SCC is higher than that of CM (Emanuelson et al., Reference Emanuelson, Danell and Philipsson1988), and the genetic correlation between mastitis and SCC has been shown to be reasonably high, 0.6 to 0.8 (Coffey et al., Reference Coffey, Vinson and Pearson1986; Emanuelson et al., Reference Emanuelson, Danell and Philipsson1988). Although the nature of the relationship between SCC and CM needs to be further elucidated, considerable interest has been directed towards the use of SCC for selection purposes due to the advantages mentioned above (Weller et al., Reference Weller, Saran and Zeliger1992). SCCs are typically log-transformed to normalize their distribution before statistical analysis (Ali and Shook, Reference Ali and Shook1980). The log-transformed SCC, or somatic cell scores (SCSs; Raubertas and Shook, Reference Raubertas and Shook1982), has regularly been used for management purposes. Experiences from Scandinavian countries as well as many simulation studies have shown that the inclusion of CM incidence in the aggregate breeding value will increase genetic gain for mastitis resistance (Kadarmideen and Pryce, Reference Kadarmideen and Pryce2001; Heringstad et al., Reference Heringstad, Klemetsdal and Steine2003). SCS also has an economic value in their own right in industries where there are milk price penalties for milk supplied for processing with very high counts (Stott et al., Reference Stott, Coffey and Brotherstone2005; Wolfova et al., Reference Wolfova, Stipkova and Wolf2006; Cole and VanRaden, Reference Cole and VanRaden2010).
In Iran, only one national genetic index is currently available for dairy farmers and breeding organizations to use. This Lifetime Net income Index (LNI) includes milk production traits and longevity as a national selection objective (Sadeghi-Sefidmazgi et al., Reference Sadeghi-Sefidmazgi, Moradi-Shahrbabak, Nejati-Javaremi and Shadparvar2009). No health attributes are directly included because they are too difficult or expensive to collect. Although longevity is correlated to health or disease traits in dairy cattle (Pryce and Brotherstone, Reference Pryce and Brotherstone1999), an extra-economic benefit is expected by including CM and SCS measures directly in the breeding goal.
In Iran, recording of production data for individual cows goes back to the early 1980s. SCC was added to the recording scheme in 2003. But, no data for CM have yet been recorded in the central milk recording database and no detailed evaluation of costs associated with CM and SCS has been conducted. Although farmers consider mastitis as one of the most important problems in their production system, the economic importance of CM and SCS has not previously been studied in Iran.
The objective of this study was to develop methods for calculating economic values of SCS and CM incidence for a situation in which recording of SCC and CM is not common. The methods are shown using data gathered from five Holstein dairy farms in Iran.
Material and methods
Data and model descriptions
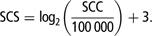
A total of 2 214 325 test-day SCC records were obtained from the Animal Breeding Center of Iran from lactations of Holstein cows that were initiated from April 2003 to November 2009. Editing of SCC records was according to Ødegard et al. (Reference Ødegard, Jensen, Klemetsdal, Madsen and Heringstad2003); SCC records outside the range of 5000 to 6 400 000 cells/ml were discarded (1.44%) resulting in a data set of 2 182 366 test-day observations from 929 herds. SCCs have a lognormal distribution (Schukken et al., Reference Schukken, Leslie, Weersink and Martin1992) and are typically log-transformed to make the trait more normally distributed before statistical analysis. The SCS was calculated from the SCC, which was defined as the average number of somatic cells per milliliter of milk (Ali and Shook, Reference Ali and Shook1980):
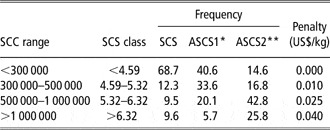
Costs directly associated with the level of SCS results from the penalty applied to the milk price paid to Iranian farmers are based on daily bulk tank SCC levels. The actual payment system provides a discontinuous penalty to the price of milk for four classes of SCC level. Table 1 gives frequencies for each SCS class and the associated price penalties.
Milk price penalties and frequency counts of individual cow SCS and herd test-day average SCS before (ASCS1) and after (ASCS2) a shift in individual cow SCS by 1 unit by SCC ranges

SCS = somatic cell scores; SCC = somatic cell count.
*ASCS1 = ASCS calculated from average somatic cell count (ASCC), which is the average raw SCC across all cows in a single herd on a single test day.
**ASCS2 = ASCS calculated by transforming average SCC2 = 1 00 000 × 2(SCS2–3), where SCS2 = SCS + 1, where SCS1 is the current individual SCS.
Three methods were used to calculate costs of SCS and to derive economic values for SCS: the Meijering method with individual SCS distribution; the Meijering method with average SCS distribution; and a new method (milk collection method) that models the observed incidences of average SCS across milk collections and predicts the financial impact of a change in these incidences.
The Meijering method is a threshold model as described by Meijering (Reference Meijering1986) to derive economic values of dystocia. This method has been applied to SCS assuming price penalties applied to individual cows (Charfeddine, et al., Reference Charfeddine, Alende, Groen and Carabana1996; Wolfova et al., Reference Wolfova, Wolf, Kvapilik and Kica2007); costs of SCS were defined as the sum of the frequency of each SCS class multiplied by its penalty. SCS economic values were defined by determining the effect of an increase in the SCS herd level on the proportion of cows producing milk in each SCS class.
Let pi be the penalty associated with an SCS in class i and ti be the threshold that separates SCS class i from class i + 1. Let μ and σ be the average and s.d. of SCS. Using these definitions and parameters and under the assumption of a normal distribution for SCS, average costs of SCS (C SCS) were calculated as:
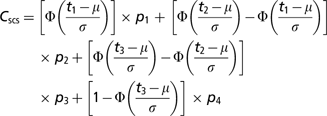
where Φ(z) is the normal cumulative distribution function and shows the probability of the variable (SCS) has a value less than threshold value (zi) and is expressed as:

 is the distance between mean liability and threshold ti in units of the standard normal SCS scale. The penalty of each class of SCS (US$/kg) is denoted pi.
The incidence of categories (proportion of animals in each class) is given by  , which is equal to the area between thresholds ti and ti − 1 under the standard normal density function.
The economic value of SCS can be computed by partial differentiation of the cost function with respect to the population mean for the liability (SCS) scale following Meijering (Reference Meijering1986):
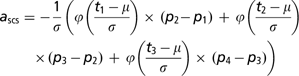
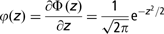
where ϕ(z) is the probability density function of the normal distribution and shows vertical height on the normal distribution and can be expressed as:
The Meijering method with average SCS distribution is similar to the above-mentioned method with the exception that the mean and s.d. of averages of SCS for all cows in a herd on a given test day were used instead of the mean and s.d. for individual cows. Because there was a nonlinear relationship between SCC and SCS, an average SCS was calculated by first calculating average SCC (ASCC) and then using the standard transformation to convert ASCC into average SCS.
In the milk collection method, arithmetic means of raw SCC were calculated and used to determine penalties applied to the farm gate milk price using the average of test-day records to define a base level of genetic merit for SCS. An average of raw SCC across all cows in a single herd on a single test day was calculated, and the price–cost penalty per kg of milk obtained from this collection was based on the average raw SCC for the milk collection relative to SCC price penalty thresholds. The arithmetic mean of price–cost penalties across all milk collections was then used to derive the average price–cost penalty at the base level of genetic merit.
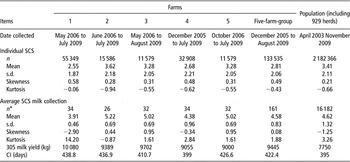
A 1-unit increase in SCS over and above the base level of genetic merit was then simulated by calculating; SCS2 = SCS1 + 1, where SCS1 is the current individual SCS. The raw SCC2 were obtained by back transforming from SCS for individual cows using SCC2 = 100 000 × 2(SCS2–3). The same steps as described above for the base level of genetic merit were then applied to obtain a new price–cost penalty per kg of milk for each milk collection. The difference between arithmetic means of average price–cost penalties at the base level of genetic merit and when SCS for all cows is assumed to increase by 1 unit is then taken as the economic value estimate for SCS. Shifts in average SCS1 frequency to average SCS2 for the whole population are shown in Table 1. Descriptive statistics and characteristics of the data for the five herds individually and whole population of Iranian Holstein are summarized in Table 2.
Descriptive statistics and characteristics of the data for the five herds individually and for the whole population of Iranian Holstein
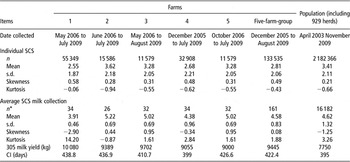
SCS = somatic cell scores; CI = calving interval.
*Number of observation for average SCS.
Calculation of the costs due to CM and the economic value for incidence of CM
A model to calculate mastitis costs and derive an economic value for CM was developed. Calculation of the costs due to CM and the economic value for incidence of CM was as follows:

The loss of revenue for discarded milk during illness of cows ($ per cow per year) was calculated as Discmilk multiplied by the milk price ($/kg).
The amount of discarded milk (Discmilk, kg per cow per year) was estimated as follows:

The average incidence of CM cases (YMI) was defined as:

The cost for drugs and veterinary service ($ per cow per year) was calculated as:
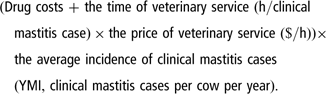
The labor cost for herdsman’s time dealing with CM ($ per cow per year) was estimated as:

Other costs including the depreciation cost for extra milking machines and antibiotic costs for dry cows were calculated as:

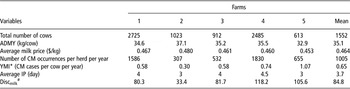
Data sources were used for deriving input parameters gathered from five Holstein dairy farms in 2008. A summary of the data is given in Table 3. The farms were of different sizes, animals were housed differently across the farms and each had their own specific feeding and management policies. All cows have been raised in intensive production systems, free stall barns in farms 1 to 4 and an open shed in farm 5. In all farms, the cows were fed a balanced total mixed ration. Lactating cows were milked three times per day except farm 4 where milking was four times per day. All cows were treated with antibiotics at the time of drying off. No special mastitis control program was applied on the farms. Starting date of CM treatment, ending date of CM, kind of drugs administered and frequency of treatments, lactation number, test-day and 305-day milk production and SCCs were recorded on all farms. On farm 4, number of affected quarters and days in milk were also available for each cow.
Production and economic parameters needed for the calculation of financial losses caused by CM for the five farms and the mean values across the five farms

CM = clinical mastitis; ADMY = average daily milk yield; YMI = average incidence of CM; IP = infection period; Discmilk = average amount of discarded milk.
*YMI = Number of CM occurrence in a herd per year divided by total number of cows.
Discmilk = ADMY × IP in which milk discarded × YMI.
As all cows with CM were treated with antibiotics, milk obtained during the illness of a cow was assumed to be discarded and not fed to calves because of risks of antibiotic residuals and pathogen contamination.
Reductions in milk price due to high SCC, the economic consequences of increased culling rate and occurrence of other diseases, lost income caused by permanently reduced yield following mastitis in the rest of the lactation and in coming lactations (as reported by Schepers and Dijkhuizen, Reference Schepers and Dijkhuizen1991 and Houben et al., Reference Houben, Dijkhuizen, Van Arendonk and Huirne1993) were explicitly excluded from the estimation of mastitis costs (US$ per cow per year), in order to avoid double counting. This is because SCS, productive life and milk production, are already included in the breeding goal as traits in their own right.
The input parameters used for the calculation of financial losses caused by CM are listed in Table 3. The costs for drugs were calculated for three farms based on the average type and number of medications per case of CM and an average value for all farms was used. Price of antibiotics for drying cows, price and time of veterinary service, herdsman’s time and price of herdsman’s time were also calculated for the same three farms that were used to obtain the costs for drugs. The price per dose of all drugs corresponded approximately to the prices of veterinary drugs in Iran in 2008. Parameters that were assumed to be equal for all farms included time of veterinary service (h per CM case), price of veterinary service (US$/h), herdsman’s time (h per CM case), price of herdsman’s time (US$/h), drug costs (US$ per CM case), price of antibiotics for drying cows (US$ per cow), and proportion of cows dried with antibiotics and their values were 0.08, 6.67, 0.67, 3.33, 17.06, 1.09 and 1, respectively. The depreciation cost for extra milking machines was set to zero because in the five farms investigated, cows with CM are milked at the end of the milking period with the same machines as healthy cows and then the machines are disinfected.
The economic value of CM (a YMI) is calculated as the first partial derivative of the mastitis costs with respect to the averaged incidence of CM cases (YMI, CM cases per cow per year):
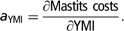
The economic value calculated in this way gives the change in the direct financial losses per cow per year, which is equal to the negative change in profit per cow per year when increasing the average number of CM cases per cow per year by one case.
Sensitivity analysis
To study the effect of altering production and marketing circumstances on the costs and economic values for CM, a sensitivity analysis was carried out. To test the sensitivity of the model, YMI, veterinary costs, ADMY and milk payment were varied by ±20%.
Results
Costs and economic values for SCS
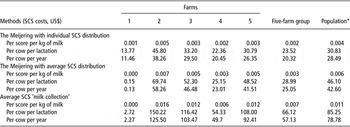
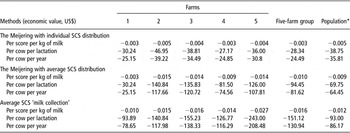
Tables 4 and 5 give estimates of the costs and economic values of SCS for three methods for the five herds individually and for the whole population of Iranian Holsteins, respectively. The costs and economic values for SCS were expressed in three ways. The first was per score per kg of milk yield, the second was per cow per lactation defined as the average 305-day milk yield for the specific herd or for the whole population multiplied by corresponding values expressed per kg of milk yield and the third was per cow per year defined as 365/calving interval multiplied by corresponding values per lactation.
SCS costs using three methods for the five herds individually and for the whole population of milk recorded Iranian Holsteins

SCS=somatic cell score.
*Calculated based on parameters listed in Table 2 for whole population including 929 herds.
SCS economic values using three methods for the five herds individually and for the whole population of milk recorded Iranian Holstein

SCS=somatic cell score.
*Calculated based on parameters listed in Table 2 for whole population that included 929 herds.
The SCS costs obtained using the Meijering method with an individual SCS distribution varied from US$11.46 to US$38.26 across the five farms and for the whole Iranian population based on all SCS milk recording records it was US$28.49 per cow per year. The economic values obtained using the Meijering method with individual SCS distributions varied from US$−39.22 to US$−24.42 in the five investigated farms and the value for the whole population was −35.81 per cow per year.
The respective values of SCS costs obtained using the Meijering method with an average SCS distribution were between US$0.13 and US$58.26 per cow per year in the five investigated farms. For the whole Iranian Holstein population, it was found to be US$42.60 per cow per year. The respective SCS economic values using the Meijering method with an average SCS distribution were between US$−25.15 and US$−117.66 per cow per year in the five investigated farms. For the whole population, economic value were found to be US$−64.45 per cow per year.
Using the milk collection method, SCS costs varied from US$2.27 to US$125.50 across the five farms and for the whole population they were US$78.78 per cow per year. Economic values were calculated to be between US$−78.65 and US$−208.48 per cow per year across the five farms and to be US$−86.17 per cow per year for the whole population.
For the population, estimated economic values using the milk collection method were 1.3 and 2.4 times higher than those using the Meijering method with average and individual SCS, respectively. The Meijering method based on average SCS resulted in economic values that were 1.8 times higher than when a distribution of individual SCS was modelled.
Direct losses due to CM and economic value of CM incidence
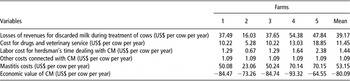
The data used for calculating the individual components of mastitis costs are given in Table 6. Losses of revenues for discarded milk during illness of cows and cost for drugs and veterinary service per cow per year differed among farms. This is because of differences in the frequency of mastitis occurrences and also the average length of illness. The incidence of CM cases per cow per year was 0.65 on average and varied from 0.30 to 1.07. The duration of clinical infection within farms varied from 3 to 4.5 days with an average of 3.7 days.
Cost components applied in the model for the calculation of financial losses due to CM and the economic value of CM per cow per year

CM=clinical mastitis.
Differences among farms in CM incidence, the length of treatment and daily milk yield level resulted in a large variation in revenue losses for discarded milk. Milk losses accounted for 68% to 78% of the total costs. Veterinary expenses were the next most important cost, accounting for 19% to 27% of total costs. Among the individual farms, mastitis costs ranged from $23.06 to 70.15 with a mean of $53.15 per cow per year. The economic values of increasing the average CM incidence by one case per cow per year varied between farms from US$−64.55 to US$−93.32 per cow per year with an average of US$−80.09.
Sensitivity analysis
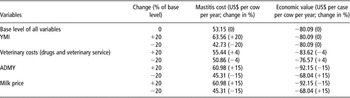
Estimated impacts of changes in the main influencing factors (YMI, veterinary costs, ADMY and milk payment) on the costs and economic values for mastitis are shown in Table 7. Increasing the mastitis incidence by 20% raised the mastitis costs by 20% to US$63.56 while decreasing the base level of CM incidence by 20% caused a decrease in mastitis costs by 20% to US$42.73. However, the economic value of CM incidence remained the same for each assumed level of base CM incidence. Changes in average incidence of CM in the herd have no impact on the economic value because the average incidence term YMI drops out of the economic value calculation once the derivative is taken off the overall cost function. Changing the base level of ADMY and milk price by ±20% caused a change in mastitis costs and the economic value of CM by ±15%, whereas ±20% changes in veterinary costs altered mastitis costs and the economic value of CM by only 4%. Thus, milk production level and price were the factors with the largest impact on the costs and economic value for mastitis.
Sensitivity analysis for costs and economic value (US$ per cow per year) for incidence of CM by ±20% varying in levels of input parameters in the mean values across the five farms

CM=clinical mastitis; YMI=averaged incidence of CM; ADMY=average daily milk yield.
Discussion
General
This study has demonstrated new methods for estimating the economic value of SCS and CM that can be applied in countries and situations where detailed information on herd health management and costs is limited to a small subset of farms. The objective was to establish economic values of CM and SCS so that these health traits can enhance the current Iranian total economic merit index (LNI). It is expected that broadening the breeding goal to encompass as many traits affecting profitability as possible will lead to an increase in profit not by increasing output but by reducing health costs associated with production. Reducing health costs will improve the welfare of the cow and so a broader breeding goal should increase the welfare of the cow as well as farmer profit (Stott et al., Reference Stott, Coffey and Brotherstone2005). The economic values derived here provide useful information to determine breeding strategies in Iran. However, it is not just the economic values in the breeding objective that will determine the rate and direction of genetic change. For material benefits to accrue from this study, recording systems for CM will need to be developed and genetic evaluation procedures for both CM and SCS need to be implemented.
Representativeness of the selected herds
This study was conducted based on samples from five farms for CM incidence and SCS records. An attempt was made to include farms that were typical of the Iranian Holstein farms in the level of milk production, reproduction, culling and productive lifetime of cows. There were 15 426 cows across the five farms representing approximately 2% of the national Holstein population of approximately 700 000 cows. The farms utilized a management, feeding and housing system commonly applied in the majority of dairy herds. Average results should therefore allow inferences for the national dairy cattle population in Iran. Given the substantial differences in CM incidences and costs among the farms, we recommend that similar studies of this kind should obtain records from at least five farms in order to reduce the risk of non-representative information being obtained.
Comparison estimates of economic values for SCS by three methods
In Iran, as in most other countries with centralized milk processing on an industrial scale, milk quality payment is influenced by bulk tank SCC that contains milk mixed from all cows on the farm. Previous studies (Charfeddine, et al., Reference Charfeddine, Alende, Groen and Carabana1996; Wolfova et al., Reference Wolfova, Wolf, Kvapilik and Kica2007) that apply the Meijering method to obtain economic values for SCS implicitly assume that milk is collected and penalized based on SCS counts at the level of individual cows. There is a further assumption that the distribution of SCS takes normal Gaussian form. The results from this study indicate that both of these implicit assumptions can be violated and when they are, the impacts on the magnitude of economic values of SCS are substantial.
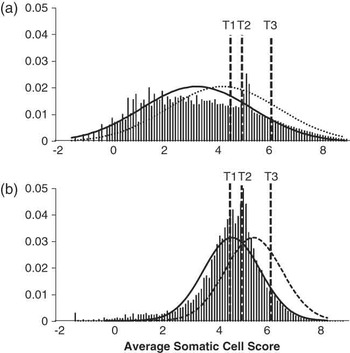
Figure 1 shows the reasons behind these large differences in SCS economic values with the different methods. Figure 1a shows a histogram of individual cows’ SCS observations with two normal curves superimposed on top. The solid normal curve reflects the means and s.d. of the observations shown, while the dotted normal curve indicates the implied shift in the distribution that might occur with a genetic increase in the population mean for SCS. The change in areas under the normal curve between thresholds, which determine milk price penalties, change with genetic improvement and the size of the change is a direct function of the height of the normal density at the point at which it is truncated by each threshold.
Distribution of individual somatic cell score, normal distribution before (solid line) and after (broken line) genetic improvement relative to histogram plots for individual cows (a) and for milk collection averages (b). Ti = threshold i indicating a change in milk price.

Figure 1b shows a histogram of milk collection average SCSs, again with a normal curve superimposed for the current mean and s.d. of milk collection averages (solid line) and a dotted curve implying a genetic shift in the mean. The milk collection average distribution has a much higher and tighter spread of values than the histogram for individual cow observations, at least partly as a consequence of the central limit theorem. Furthermore, the high peak of the distribution of milk collection averages falls close to the thresholds and so the points where the thresholds truncate the normal curve are much higher than the curves plotted for individual cow observations. This in turn results in notably higher economic values as observed in this study when comparing individual cow and milk collection average economic values calculated using the Meijering method.
Further examination of Figure 1b reveals that the milk collection average histogram plot is both skewed and shows positive kurtosis. As a consequence, the normal curve underestimates the height of the observed distribution, particularly at thresholds 1 and 2. This explains the further increase in economic values with the milk collection method as compared with the Meijering method based on milk collection averages.
Thus, the milk collection method is a more robust method to derive economic values for SCS than methods that assume normality. Non-normal distribution causes an error in calculation of trait level frequencies as a result of skewness and kurtosis, which cause deviation in the vertical height on the standard normal distribution (ϕ(z)). When the distribution of data is unknown or difficult to approximate or when a transformation to normality is not straightforward, the milk collection method would be preferable.
The increase in SCS by one could cause a problem with calculating economic values for SCS because of a nonlinear relationship between profit and the trait level of interest if responses due to selection are likely to be much smaller or in the opposite direction. Smaller simulated changes in the SCS distribution run the risk of biases created by frequency spikes near threshold points in observed data. In this study, minimal differences in SCS economic values were found when the milk collection method simulated 0.1 v. 1-unit increases in SCS (results not shown).
Absolute figures on derived economic values depend strongly on price parameters and methodology so that direct comparison of economic values among different countries is very difficult (Groen et al., Reference Groen, Steine, Colleau, Pedersen, Pribyl and Reinsch1997; Wolfova et al., Reference Wolfova, Stipkova and Wolf2006). However, some general statements about economic values can be derived from the literature and from this study.
In the United States, the value of predicted transmitting ability (PTA) SCS per lactation was set at US$−62, which includes a lost premium of $44 + $18 for labor, drugs, discarded milk and milk shipments lost due to antibiotic residue (Cole and VanRaden, Reference Cole and VanRaden2010). For the Iranian Holstein, this value was found to be US$−90/cow per lactation using the preferred milk collection method. This difference is not surprising because of differences in model, trait definition and assumptions about management system. The SCS economic values derived in this study using the Meijering method with individual SCS distribution varied from US$−0.005 to US$−0.003 per score per kg of milk yield in five investigated farms, while the value for the whole population was US$−0.005. In the Spanish population, economic values of SCS estimated to be US$−0.004 per score per kg of milk in a base situation for free market using the Meijering method (Charfeddine, et al., Reference Charfeddine, Alende, Groen and Carabana1996).
Miglior et al., (Reference Miglior, Muir and Van Doormal2005) reported the relative emphasis on traits in selection indices from 15 countries. In most indices (the United States, Great Britain, New Zealand, Germany, France, Australia, Israel, Ireland, Japan, Switzerland, Spain and Italy), SCS, as an indicator trait for mastitis resistance, was the only trait contributing to udder health. The Canadian udder health index was based on SCS (60%), udder depth (−30%), and milking speed (10%). The Dutch udder health index was a combination of SCS, udder depth, fore udder attachment, teat length, and milking speed. The Danish udder health index was based on CM, SCS, udder depth, udder support and dairy form, with a combined emphasis of 14% on the Danish S-Index.
Direct losses due to CM and economic value of CM incidence
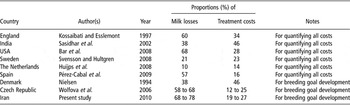
In this study, milk losses constituted from 68% to 78% of the total economic losses caused by CM. Drugs and veterinary service were the second major sources of loss and accounted for 19% to 27% of the total costs. Comparisons of milk losses v. treatment costs as a proportion of total losses per CM case in different countries are summarized in Table 8. In this study and in those of some others, milk revenue losses accounted for a higher proportion of total mastitis costs than veterinary expenses (Kossaibati and Esslemont, Reference Kossaibati and Esslemont1997; Wolfova et al., Reference Wolfova, Stipkova and Wolf2006; Bar et al., Reference Bar, Tauer, Bennett, González, Hertl, Schukken, Schulte, Welcome and Gröhn2008; Pérez-Cabal et al., Reference Pérez-Cabal, de los Campos, Vazquez, Gianola, Rosa, Weigel and Alenda2009). In contrast, veterinary costs made up a higher proportion of mastitis costs than milk losses in Denmark, India, Sweden and The Netherlands dairy herds (Nielsen Reference Nielsen1994; Sasidhar et al., Reference Sasidhar, Reddy and Rao2002; Wolfova et al., Reference Wolfova, Stipkova and Wolf2006; Svensson and Hultgren, Reference Svensson and Hultgren2008; Huijps et al., Reference Huijps, Lam and Hogeveen2008). These differences are because of different production systems, estimation methods and perhaps most importantly, due to different purposes of research, that is, the development of a breeding objective or quantifying all costs.
Comparison of milk losses v. treatment costs as a proportion of total losses per CM case in different countries

CM=clinical mastitis.
The economic losses from CM in the present and previously described studies are not directly comparable to those in analyses that were designed for different purposes. The effect of mastitis on future milk yield of a cow, milk quality (fat and protein content, SCC), reproductive traits and length of productive life have to be added to the direct CM losses, for example, when comparing costs for mastitis control programs with the financial benefits of decreasing CM incidence (Yalcin and Stott, Reference Yalcin and Stott2000; Seegers et al., Reference Seegers, Fourichon and Beaudeau2003). The objective of the present study was to estimate the economic value of mastitis incidence in line with the breeding goal or the aggregate genotype. To avoid double counting of effects, the impact of mastitis on the level of other traits commonly included in the aggregate genotype (milk production traits, reproductive traits, cow survival, SCC) were not considered when calculating financial losses from CM.
The economic values for increasing the average CM incidence by one case per cow per year varied between farms from US$−64.55 to US$−93.32 with an average of US$−80.09 per cow per year. It was found to be US$−91.40 per CM case per cow per year in the Czech Republic (Wolfova et al., Reference Wolfova, Stipkova and Wolf2006). In the United Kingdom, the economic value of mastitis was estimated at US$1.35 per percent incidence, giving an index weight for SCC PTA of US$0.33 (Stott et al., Reference Stott, Coffey and Brotherstone2005). Assuming a genetic s.d. of CM incidence of 0.08, the standardized economic value for CM incidence in this study would be (US$80.09 × 0.08=) US$6.41, which was lower than the appropriate values published by Toivakka et al. (Reference Toivakka, Nousiainen and Maantysaari2005) for Finnish Holsteins (US$−30.30) or by Boettcher et al. (Reference Boettcher, Dekkers and Kolstad1998) for Canadian conditions (US$−23. 46).
Conclusion
Results obtained in this study provide important information about economic values of SCS and CM that can be considered for incorporation in a breeding goal for Holstein dairy cattle in Iran. The suggested model to calculate mastitis costs can be used to estimate CM costs and economic values in other countries where farm production and economic data are generally poor. The model outlined in this study for estimating an economic value for SCS (milk collection method) does not assume that SCS is normally distributed and would be an alternative to calculate economic value for SCS with more accuracy.
Acknowledgements
The first author (A. Sadeghi-Sefidmazgi) is grateful to the farmers for participating in the study and to Marie Wolfova for her helpful comments.