Implications
Health of dairy cows is important for economic and animal welfare reasons. Dairy producers in Canada record data on eight health traits that could be used for genetic selection purposes. Data on disease events of Canadian Holsteins were analysed within a single disease or a group of diseases showing biological similarities. Results indicated that there exists an additive genetic variation for a liability to diseases in this population, although heritabilities of health traits are relatively low. Left displaced abomasums and ketosis, and metritis and retained placenta, are moderately and positively correlated on a genetic level.
Introduction
Health problems generate high costs to dairy producers. A lot of emphasis has been laid on animal health from a management perspective in order to reduce the incidence of diseases on dairy farms. A genetic component exists for most diseases (e.g. Zwald et al., Reference Zwald, Weigel, Chang, Welper and Clay2004a); however, this aspect has not been given much attention in the dairy industry. Apart from the use of somatic cell score as an indicator trait to improve resistance to mastitis (MAST), direct selection for health has been limited to Nordic countries (Osteras et al., Reference Osteras, Solbu, Refsdal, Roalkvam, Filseth and Minsaas2007; Steine et al., Reference Steine, Kristofersson and Guttormsen2008). The reason for the absence of direct selection for health traits is often the result of a lack of information suitable for genetic evaluation. Health data recording is difficult and expensive, as exact diagnoses and follow-ups should be carried out in a large population. Health traits have generally low heritabilities (Mäntysaari et al., Reference Mäntysaari, Gröhn and Quaas1993; Uribe et al., Reference Uribe, Kennedy, Martin and Kelton1995; Zwald et al., Reference Zwald, Weigel, Chang, Welper and Clay2004a; Heringstad et al., Reference Heringstad, Chang, Gianola and Klemetsdal2005; Heringstad, Reference Heringstad2010; Koeck et al., Reference Koeck, Egger-Danner, Fuerst, Obritzhauser and Fuerst-Waltl2010). Information from a relatively large number of cows and herds over several years is therefore required to obtain reliable estimates of breeding values of sires. Given the low heritability, results of selection are not as readily observable as results of improved management practices. Despite these limitations, genetic progress with respect to resistance to diseases is possible (Heringstad et al., Reference Heringstad, Klemetsdal and Ruane2000; Osteras et al., Reference Osteras, Solbu, Refsdal, Roalkvam, Filseth and Minsaas2007).
In Canada, a project was launched in 2005 to collect health data for the dairy cattle population. The first phase of the project was to select the most important diseases from an economic perspective, and to define clear and simple diagnoses for health disorders. The list and diagnostics of eight diseases of main interest were taken from Kelton et al. (Reference Kelton, Lissemore and Martin1998). For the second phase, a national database was set up in 2007 to store producer-recorded health information, and recording started in April of that year. Data recording was carried out by producers or veterinarians (in the province of Quebec); data were transmitted to the dairy herd improvement (DHI) association for the region (CanWestDHI, Guelph, Ontario, for Western Canada and Ontario; Valacta, Sainte-Anne-de-Bellevue, Quebec, for Atlantic Canada and Quebec) and loaded into the national database at the Canadian Dairy Network (CDN), Guelph, Ontario. The third phase of the project was the use of this data in breeding programmes for the dairy industry. One aspect is the preparation of management tools based on the occurrence of diseases. Another aspect is the genetic analysis of health traits, with a goal to provide genetic evaluations of bulls for the health traits.
Health events are recorded as binary data (presence or absence of a disease case). Threshold models (Gianola and Foulley, Reference Gianola and Foulley1983; Harville and Mee, Reference Harville and Mee1984) have been advocated to deal with binary data. Some health data analyses have already applied threshold model methodology (e.g. Uribe et al., Reference Uribe, Kennedy, Martin and Kelton1995; Zwald et al., Reference Zwald, Weigel, Chang, Welper and Clay2004a and Reference Zwald, Weigel, Chang, Welper and Clay2004b; Heringstad, Reference Heringstad2010; Koeck et al., Reference Koeck, Egger-Danner, Fuerst, Obritzhauser and Fuerst-Waltl2010) whereas a linear model approach (although not optimal) is also used.
The most critical time in a cow's life is the peripartum period. During this time, some of the most costly diseases (metritis (MET), milk fever (MF) or retained placenta (RP)) occur. Many diseases are associated with each other and the occurrence of a disease can also have an impact on culling decisions. This refers to two diseases caused by metabolic imbalance: left displaced abomasum (LDA) and ketosis (KET). Often, when one of the diseases is observed and recorded, other diseases, which may be present, are not recorded. Traits correlated to each other should be analysed using a multiple-trait approach. Main advantages of this methodology are the increase in the accuracy of estimation of genetic effects and the reduction in the bias caused by culling on correlated traits.
Animals that stay longer in a herd have more opportunities to contract a disease and not all diseases have the same duration of risk. Some diseases are intimately related to parturition and have a period of occurrence limited to a few weeks (or days), whereas others can occur over the entire lactation period. The effect of the length of the period at risk has been accounted for in previous analyses of health data (e.g. de Haas et al., Reference de Haas, Barkema and Veerkamp2002; Abdel-Azim et al., Reference Abdel-Azim, Freeman, Kehrli, Kelm, Burton, Kuck and Schnell2005).
The objective of this study was to estimate genetic parameters for disease traits recorded in Canadian Holsteins using single-trait or multiple-trait threshold models.
Material and methods
Health data
Data were obtained from the CDN. The dataset contained animal herd book registration, sire and dam, test dates, test-day (TD) milk records, days in milk (DIM) at TD, as well as health events and dates of health events. All health events reported from the beginning of data recording (April 2007) until the end of August 2008 were available. A total of eight diseases were analysed: clinical MAST, lameness (LAME), cystic ovarian disease (COD), LDA, KET, uterine disease/MET, MF and RP. Definitions of these diseases were given by Kelton et al. (Reference Kelton, Lissemore and Martin1998).
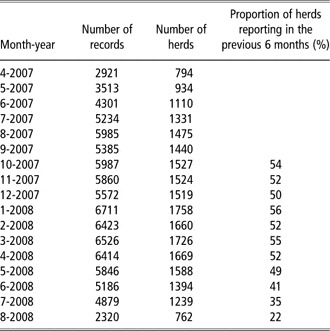
The distribution (by month of recording) of health events reported in the database is given in Table 1. Cases of disease per month increased from less than 3000 during the first month of recording to 6711 in January 2008. The decrease in the number of records during the last 3 months is because of a lag of about 2 months for the transfer of data recorded by veterinarians from the province of Quebec. The number of herds reporting each month was as high as 1758; the total number of herds with at least one event reported over the whole period was 3891. The proportion of herds reporting at least one case of any disease in the month of interest having reported diseases in the previous 6 months can serve as an indication of the proportion of herds recording at least one case per month. Approximately 50% of the herds recorded at least one disease event each month. Of the 3891 herds having recorded data since 2007, only 2979 did so in 2007, and 3309 in 2008. Thus, 912 new herds started recording data in 2008; however, 582 herds that recorded data in 2007 stopped doing so in 2008.
Distributions of data by month of recording

Data were analysed one disease at a time or by considering several diseases simultaneously in the multiple-trait model. Multiple-trait analyses were conducted for traits presenting biological similarities. The diseases occurring immediately after parturition or being a direct consequence of calving formed one group of traits. This included MET, MF and RP. The second group consisted of metabolic diseases associated with the production peak, namely KET and LDA (Stengärde and Pehrson, Reference Stengärde and Pehrson2002). The three other diseases (MAST, LAME and COD) have no obvious relationship with each other or with either of the groups and were, therefore, analysed separately with single-trait models.
Data edits
Dealing with producer-recorded data requires a good sampling system, as the recording accuracy may vary from herd to herd (Zwald et al., Reference Zwald, Weigel, Chang, Welper and Clay2004a). Thus, proper editing of health data for the use in genetic analyses is of utmost importance. The study population needed to be defined in an attempt to remove herds which underreported disease events; moreover, contemporary groups needed to be built for the analyses. Data sampling to ensure correct reporting required a minimum of two events of the same disease (or one of the diseases included for multiple-trait analyses) in a given herd, and the last event recorded in this herd had to be at least 30 days apart from the first one. This was done to remove herds with no recording of a given disease and herds in which diseases had only been recorded once or during a very short period of time. Herds included in the analysis were assumed to record the disease only during the period between the events recorded at the earliest and the latest date. Although this assumption is not totally correct (some herds were likely recording data before the first observation and after the last observation or may not have been recording for some time in-between), the interval gave a rough estimate of the period of recording (POR).
For each disease case, DIM at its occurrence was calculated. Limits in DIM were assigned to each disease. These limits were calculated as the time from parturition until 95% of the disease cases occurred. Health events happening after the DIM limit were removed from the dataset. The limits of DIM were 210 days for MAST and LAME, 180 days for COD, 90 days for MET, 60 days for LDA and KET, 10 days for RP and 5 days for MF. Only the earliest case of a disease was kept in a given lactation for each cow.
Contemporary groups were formed of all cows that had a TD record in a herd kept in the analysis during the POR of this herd. Animals from the contemporary group that were not in the stage of lactation, given by the DIM limits during the POR of the herd, were removed from the dataset.
Description of the edited data
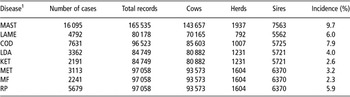
Characteristics of the edited datasets are given in Table 2. Incidence of a disease was calculated as a proportion of lactations with a disease case. Over 160 000 records were included in the MAST analysis. MAST was the disease with the largest number of animals in contemporary groups and the largest number of herds recording (1937). The dataset for LAME included 80 178 records (4792 of them with a case of LAME) in 792 herds. This was the disease with the vaguest diagnosis and recorded in the fewest herds. Despite having a lower incidence than LAME, the dataset for metabolic diseases (LDA–KET) was larger as these diseases were recorded in more herds. Incidences of diseases were all below 10%. They varied from 2.3% (MF) to 9.7% (MAST). Metabolic diseases had relatively low incidences (4.0% for LDA and 2.6% for KET). Estimates of disease incidences were based on many incomplete lactation records. The presence of left-censored cows (the beginning of lactation omitted) would likely underestimate the incidence of diseases for which most cases occur early in lactation (i.e. MAST).
Description of edited dataset

1MAST = clinical mastitis; LAME = lameness; COD = cystic ovarian disease; LDA = left displaced abomasums; KET = ketosis; MET = metritis/uterine disease; MF = milk fever; RP = retained placenta.
Number of cows (sires) in the data varied from 143 657 (7567) for MAST to 80 882 (5721) for LDA and KET. Corresponding records per cow averages varied from 1.15 for MAST to 1.04 for MET, MF and RP. Data included records from multiple lactations. Distributions of records by lactation number were similar across traits. They were 35% to 36% for parity 1, 26% for parity 2, 18% to 19% for parity 3 and 19% to 21% for parity 4 and greater.
Days at risk (DAR)
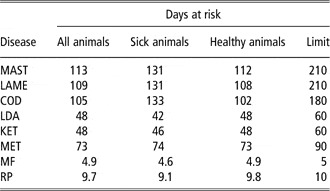
The covariate DAR was calculated for each cow and the disease as the difference between the end date and the starting date of risk (de Haas et al., Reference de Haas, Barkema and Veerkamp2002). The starting date was the latest of the animal's calving date and the beginning of the herd's POR. The end date was the earliest of the date of the cow's last TD record in the herd, the date of the DIM limit for the disease or the end of the herd's POR. Animals with DAR smaller than 1 day were removed from the dataset. Data characteristics with respect to DAR are given in Table 3.
Average days at risk for eight diseasesFootnote 1 according to the status of the animal (sick or healthy) and limit of days in milk for inclusion of diseases
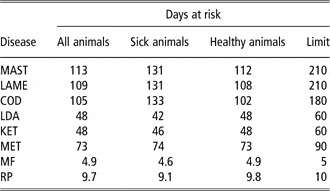
1 MAST = clinical mastitis; LAME = lameness; COD = cystic ovarian disease; LDA = left displaced abomasums; KET = ketosis; MET = metritis/uterine disease; MF = milk fever; RP = retained placenta.
Models
A total of four different models were applied to two multiple-trait and three single-trait analyses. All models were the threshold-binary models (Gianola and Foulley, Reference Gianola and Foulley1983; Harville and Mee, Reference Harville and Mee1984) that account for the categorical nature of the traits. The assumption is that the observable trait (cow is healthy or sick at a given time) is the result of an unobservable, underlying variable, called liability, which is normally distributed. When the liability is below the threshold (set to 0) the observation has a certain phenotype (i.e. healthy, coded as 0) and when it is above the threshold, the observation has another phenotype (i.e. sick, coded as 1).
Equations for models on a liability scale were:
TS (threshold model with sire effect):

TCS (threshold model with cow within a sire and sire effects):

TDS (threshold model with DAR and sire effects):

TDCS (threshold model with DAR, cow within sire and sire effects):

where lijklmn was the liability to a disease, Hi was a fixed herd of calving effect, Mj was a fixed month of calving effect, Lk was a fixed parity effect (with four classes, lactations later than four were included in the fourth lactation effect), dkl were the DAR of the cow, b was the regression coefficient of DAR on the observation, clm was the random cow within sire effect, sm was a random sire of the cow effect and eijklmn was a residual effect for each observation.
The decision to use contemporary group defined as herd instead of herd-year was based on the fact that more than 60% of the herds had less than 12 months of data recording. The other 40% had at the most 17 months of recording. Inclusion of DAR in the model was made to estimate the effect of this variable on the liability to the disease. MF and RP had very short DAR period (5 and 10 days, respectively), therefore models TD and TDSC were not fitted for these two traits. Similarly, as MET was analysed with MF and RP in a multiple-trait manner, models that included regression on DAR were also not applied to this trait. Effect of the cow within sire needs to be included to account for repeated records on a cow (multiple lactations). Given the short period of data included, many cows had only one record, and the cow effect was partly confounded with the residual for this record.
Random effects of the models followed a normal distribution with location parameters equal to 0 and dispersion parameters as

where I was an identity matrix, A was an additive relationship matrix,  was the cow within sire variance,
 was the additive sire variance and
 was the residual variance.
The same linear models on a liability scale were used for multiple-trait analyses. The general form of the multiple-trait model was

where y was the vector of liabilities, f was the vector of fixed effects (herds, month of calving, parity effect and regression on DAR), c was a vector of cow within sire effects, s was a vector of sire effects and e was the vector of residual effects, X, Z1 and Z2 were incidence matrices relating effects to the observations. Random effects followed multivariate normal distribution, with location parameters equal to 0 and dispersion parameters as

where P was a covariance matrix for cow effects, G was a covariance matrix for sire effects, R was a residual covariance matrix and ⊗ was the Kronecker product. All residual variances were set to 1 to assure identification of parameters for all models.
Methods
Model parameters were estimated by Gibbs sampling with the software THRGIBB1F90, and post-Gibbs analyses were run with POSTGIBBSF90 (Misztal et al., Reference Misztal, Tsuruta, Strabel, Auvray, Druet and Lee2002). Flat prior distributions were assumed for fixed effects and covariance components on a liability scale; 100 000 samples were drawn, and the first 10 000 were discarded as a burn-in. Convergence of Gibbs chains was determined by visual inspection of trace plots of variance components. Posterior means were used as estimates of the parameters, and posterior standard deviations of variance components and genetic parameters were calculated.
Model comparison
The mean squared error statistic (MSE) on the observable scale was used to estimate goodness of fit for a model. The MSE was calculated as

where yj 1 = 0, yj 2 = 1, ak is the frequency of event in each of the two classes (healthy or sick); njk is the number of observations for the jth cow in the kth category, and  is the predicted probability, calculated as

where Φ(.) was the cumulative standard normal distribution function, wj was a vector of the matrix W of incidences of fixed and random effects and  was a vector of posterior means of model parameters (Matos et al., Reference Matos, Thomas, Gianola, Perez-Enciso and Young1997).
Results
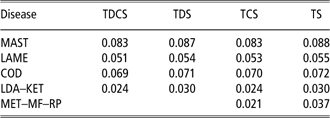
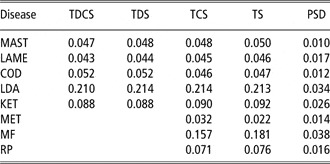
Mean squared errors of all models are given in Table 4. All models gave similar MSE within a trait. The inclusion of a cow effect tended to improve the goodness of fit. Models with a cow within the sire effect and a regression on DAR seemed to have the best goodness of fit compared with other parameterizations.
Mean squared error statistic for eight diseasesFootnote 1 from four different modelsFootnote 2

1 MAST = clinical mastitis; LAME = lameness; COD = cystic ovarian disease; LDA–Ket = left displaced abomasums and ketosis; MET–MF–RP = metritis/uterine disease, milk fever and retained placenta.
2 TDCS = threshold model with days at risk, cow within sire and sire effects; TDS = threshold model with days at risk and sire effects; TCS = threshold model with cow within sire and sire effects; TS = threshold model with sire effect.
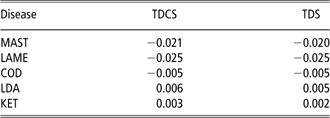
The solutions for regression coefficients on the DAR effect are given in Table 5. Both models that included DAR regression gave similar posterior means of regression coefficients for a given trait. All estimates of regression coefficients were very close to 0. Point estimates for this effect for the traits calculated with multiple-trait analyses had positive values for both models, indicating higher liability to metabolic and reproductive diseases with longer DAR. Slightly negative effects of DAR were estimated for traits analysed with single-trait models.
Posterior means of the regression coefficient of day at risk on liability to diseasesFootnote 1 from two different modelsFootnote 2

1 MAST = clinical mastitis; LAME = lameness; COD = cystic ovarian disease; LDA = left displaced abomasums; KET = ketosis.
2 TDCS = threshold model with days at risk, cow within sire and sire effects; TDS = threshold model with days at risk and sire effects.
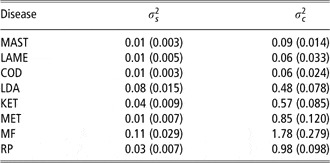
Estimates of variance components were similar across models; parameters for the TSCS model are given in Table 6. Cow components of variance were larger than the sire contribution to variation on a liability scale, with substantially larger estimates of posterior standard deviation for a given trait.
Posterior means of variance components ( = sire variance;
 = cow within sire variance) for eight diseasesFootnote 1 from the model with cow within a sire and sire effects; posterior standard deviation are given in brackets

1 MAST = clinical mastitis; LAME = lameness; COD = cystic ovarian disease; LDA = left displaced abomasums; KET = ketosis; MET = metritis/uterine disease; MF = milk fever; RP = retained placenta.
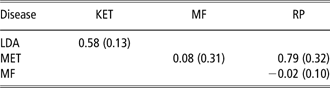
Estimates of heritabilities for eight health traits are given in Table 7. All models gave relatively consistent estimates of heritabilities within a trait. The highest heritability was for LDA (0.21) and MF (0.16 to 0.18) and the lowest for MET (0.02 to 0.03). The other five traits had heritabilities ranging between 0.02 and 0.09. Two genetic correlations (LDA–KET, MET–RP) were moderately positive, one genetic correlation (MET–MF) was not different from 0 and one genetic correlation (MF–RP) had a negative, but not significantly different from 0, value (Table 8). Estimates of genetic correlations were similar across multiple-trait models. All cow effects correlations were highly negative within TDSC and TCS models (results not shown). The cows within sire components were likely estimated with relatively poorer accuracy because of small number of repeated records (health events in different lactations) per cow.
Posterior means of heritability for liability to eight diseasesFootnote 1 from different modelsFootnote 2; posterior standard deviations are given as an average of all models fitted for a given trait

1 MAST = clinical mastitis; LAME = lameness; COD = cystic ovarian disease; LDA = left displaced abomasums; KET = ketosis; MET = metritis/uterine disease; MF = milk fever; RP = retained placenta.
2 TDCS = threshold model with days at risk, cow within sire and sire effects; TDS = threshold model with days at risk and sire effects; TCS = threshold model with cow within sire and sire effects; TS = threshold model with sire effect; PSD = posterior standard deviations.
Estimates of genetic correlations for five diseasesFootnote 1 from a model including cow within sire and sire effects; posterior standard deviations are given in brackets

1 LDA = left displaced abomasums; KET = ketosis; MET = metritis/uterine disease; MF = milk fever; RP = retained placenta.
Discussion
The descriptive statistics showed that herd enrolment in the dairy health-recording system in Canada has increased since the beginning of data recording; however, less than half of all herds collecting health data had disease cases in any given month. Although in small herds no disease may occur during a given month, most of the herds recording all eight diseases should have at least one case of a disease. The results indicated that, for some herds, data recording is not complete. The health data recording system is very new in Canada. A look at Norwegian data shows that during the first few years of data recording, reporting and incidences were low (Osteras et al., Reference Osteras, Solbu, Refsdal, Roalkvam, Filseth and Minsaas2007). Producers need time to become familiar with the new management tools. The reporting of health data needs to be monitored and encouraged to ensure accurate recording and consequently good quality data for genetic evaluations.
Inclusion of DAR did not have an impact on estimates of genetic parameters. Regression coefficients for DAR did not show positive relationships with all diseases. Only liability to LDA and KET had a positive relationship with DAR. These two diseases had relatively short period at risk (60 days). If animals were grouped according to health status (Table 3), there would be a difference in the average of DAR between sick and healthy animals of 5.4 days for LDA (42.4 days v. 47.8 days). Abdel-Azim et al. (Reference Abdel-Azim, Freeman, Kehrli, Kelm, Burton, Kuck and Schnell2005), using the whole length of lactation for all diseases, found a slightly positive value for the regression coefficients on DAR for LDA using a linear model. Similar result was also obtained in this study, when using threshold models.
The inclusion of a cow effect slightly improved goodness of fit of the models. Estimates of a cow effect, however, exhibited relatively large posterior variability because of small amount of data (repeated records in different lactations) related to this effect. However, as more years of data accumulate, the frequencies of repeated records per cow should increase, and therefore, including cow effects in the model should be continued.
MAST
Olde Riekerink et al. (Reference Olde Riekerink, Barkema, Kelton and Scholl2008) reported recently a MAST incidence rate of 23.0% in Canada, which was more than three times higher than the rate found in this study. However, their incidence was calculated as number of cases per 100 cow-years at risk (36 500 DAR), whereas the incidence in this study was calculated as the percentage of lactations with disease, and the average DAR per lactation was only 113 days (Table 3). In addition, only one case per lactation was kept in this study. The magnitude of the difference is probably a result of the inaccuracy of reporting of MAST in this study. Although the incidence of MAST was lower than in most studies (e.g. Kelton et al., Reference Kelton, Lissemore and Martin1998), the difference was not large compared with the data recorded in a large scale in the United States of America (Zwald et al., Reference Zwald, Weigel, Chang, Welper and Clay2004a). The estimate of heritability for MAST (0.05) was lower than that found in other studies with a threshold model (Kadarmideen et al., Reference Kadarmideen, Thompson and Simm2000; Heringstad et al., Reference Heringstad, Chang, Gianola and Klemetsdal2005), but consistent with estimates of Simianer et al. (Reference Simianer, Solbu and Schaeffer1991) and Heringstad et al. (Reference Heringstad, Chang, Gianola and Klemetsdal2003). Using data from Ontario, Uribe et al. (Reference Uribe, Kennedy, Martin and Kelton1995) found higher heritabilities for resistance to MAST in the first lactation (0.15); however, when data from all lactations were included, the heritability was not different from 0.
LAME
The incidence for LAME was slightly lower than the value of 7.0% reported by Kelton et al. (Reference Kelton, Lissemore and Martin1998) as the median from 39 studies. A more recent study showed a higher incidence (Zwald et al., Reference Zwald, Weigel, Chang, Welper and Clay2004a), but the incidence rate in the large Norwegian dataset was much lower (Osteras et al., Reference Osteras, Solbu, Refsdal, Roalkvam, Filseth and Minsaas2007). The comparison with the latter must be taken with caution as it deals with another breed of cattle and a population that has had a health-recording programme for many years with genetic evaluations and selection of animals for disease resistance.
Heritability of LAME was very low (0.04), but was comparable with other results from the threshold model (Zwald et al., Reference Zwald, Weigel, Chang, Welper and Clay2004a and Reference Zwald, Weigel, Chang, Welper and Clay2004b). The phenotypic variance of this trait was also lower than that for the other two traits evaluated with single-trait models. There is often a large discrepancy between observers’ scoring for this trait, even after training (Thomsen et al., Reference Thomsen, Munksgaard and Togersen2008). The only training that most producers had for this study was a written description of LAME. The whole herd is rarely scored for LAME and only obvious cases are noticed. Thus, only extreme cases of LAME are expected to be recorded by producers. These cases do not have a high genetic component, as injuries and management practices often play a major role in their occurrences. Moreover, a few different diseases (e.g. sole ulcer, white line lesion) are responsible for LAME, and resistance to these diseases is likely controlled by different genes. Other studies found higher heritability (Van Dorp et al., Reference Van Dorp, Dekkers, Martin and Noordhuizen1998; Pryce et al., Reference Pryce, Nielsen, Veerkamp and Simm1999), but they used data from smaller groups of herds with a better follow-up of herd health. Kadarmideen et al. (Reference Kadarmideen, Thompson and Simm2000), using producer-recorded data and a threshold model, also found slightly higher heritability (0.08).
COD
Estimates of incidence reported in this study were similar to the values published by Kelton et al. (Reference Kelton, Lissemore and Martin1998), Zwald et al. (Reference Zwald, Weigel, Chang, Welper and Clay2004a) and Koeck et al. (Reference Koeck, Egger-Danner, Fuerst, Obritzhauser and Fuerst-Waltl2010), but higher than the estimates of Heringstad (Reference Heringstad2010). The reporting for COD in this dataset seems to be consistent with other studies. COD is often recorded following a veterinarian visit. Therefore, the accuracy of diagnosis is higher than for other traits.
Heritability for COD (0.05) was consistent with results based on veterinarian reports (Distl et al., Reference Distl, Ron, Francos, Mayer and Kraeusslich1991; Mäntysaari et al., Reference Mäntysaari, Gröhn and Quaas1993) and more recent estimates with threshold models (Hooijer et al., Reference Hooijer, Lubbers, Ducro, van Arendonk, Kaal-Lansbergen and van der Lende2001; Zwald et al., Reference Zwald, Weigel, Chang, Welper and Clay2004a and Reference Zwald, Weigel, Chang, Welper and Clay2004b; Heringstad, Reference Heringstad2010; Koeck et al., Reference Koeck, Egger-Danner, Fuerst, Obritzhauser and Fuerst-Waltl2010). The low heritability for COD seems to be caused by the large influence of the producer on the observation of the trait. As long as the animal does not need to be bred, the producer will not check the ovaries for presence of cysts. Therefore, the incidence in the first week of lactation is very low; it increases sharply after 70 DIM, a time when producers realise that the animal did not cycle again since calving. Although not confirmed in our results, COD is one of the diseases showing the largest positive effect of DAR on a risk of disease (Abdel-Azim et al., Reference Abdel-Azim, Freeman, Kehrli, Kelm, Burton, Kuck and Schnell2005). There is a higher risk of COD in a longer lactation, but this estimate may be biased by the fact that collecting COD data is rarely done at the beginning of lactation. Cows with short lactations, and therefore short DAR, are often not checked for COD. This situation shows the risk of confounding healthy cows and cows not observed for the disease (missing value). This problem is general for all health traits, but more acute with COD.
LDA and KET
LDA is a trait with low incidence, but generally accurately recorded as its treatment always requires the intervention of a veterinarian. The heritability estimates for LDA (0.21) were similar to those reported by Uribe et al. (Reference Uribe, Kennedy, Martin and Kelton1995). Heritabilities for KET (0.09) were similar to those reported by Pryce et al. (Reference Pryce, Nielsen, Veerkamp and Simm1999) and Kadarmideen et al. (Reference Kadarmideen, Thompson and Simm2000), but were lower than more recent estimates (0.14) of Heringstad et al. (Reference Heringstad, Chang, Gianola and Klemetsdal2005). This trait does not always seem to be recorded when LDA is present, as the latter causes more economic losses. Another reason for the low heritability of KET is that it is often a result of any other disease that reduces the feed intake of cows. In that case, KET has a completely different genetic origin than when it occurs independently.
The genetic correlation between LDA and KET was moderate and positive. Zwald et al. (Reference Zwald, Weigel, Chang, Welper and Clay2004b) found a similar result. Cows with KET have a high probability of getting LDA (Stengärde and Pehrson, Reference Stengärde and Pehrson2002); therefore, the phenotypic correlation should also be high. As mentioned earlier, KET is not recorded for cows with both diseases as it is less costly and visible than LDA. Therefore, KET is often not recorded when LDA is present. With complete recording, the correlations (phenotypic and genetic) might be even higher. This observation is corroborated by the cow effects correlation between the two traits. The value of −0.95 for this correlation shows that animals having one disease are not susceptible to the other. Incomplete reporting, however, might have also contributed to the large value of this correlation.
An aspect worth mentioning is that LDA can happen only once in an animal's life. When a case of LDA is detected, a surgery is generally performed and it ensures that the animal will not have a second incidence of the disease later in life. This might have an impact on the cow effect estimates as only one case of LDA is possible for a cow during her entire life. This will also reduce the incidence of LDA in later lactations, for animals susceptible to LDA in the first lactation.
MET, MF and RP
The three traits closely linked to calving were analysed jointly with a multiple-trait model. Heritabilities were very low for MET (0.02 to 0.03); relatively higher for RP (0.07 to 0.08) and MF (0.16 to 0.18). This was in agreement with the result reported by Ouweltjes et al. (Reference Ouweltjes, Smolders, Elving, van Eldik and Shukken1996), Koeck et al. (Reference Koeck, Egger-Danner, Fuerst, Obritzhauser and Fuerst-Waltl2010) and Heringstad (Reference Heringstad2010) for MET, and Heringstad et al. (Reference Heringstad, Chang, Gianola and Klemetsdal2005), Heringstad (Reference Heringstad2010) and Koeck et al. (Reference Koeck, Egger-Danner, Fuerst, Obritzhauser and Fuerst-Waltl2010) for RP. Some studies found higher estimates for the heritability of MF (up to 0.4; Lin et al., Reference Lin, Oltenacu, van Vleck, Erb and Smith1989), but these studies generally used data from later lactations for variance components estimation. Genetic correlations between MET and MF were not significantly different from 0. This was expected as the biology of these diseases is different (infectious v. metabolic causes), although both diseases are influenced by events at parturition. There was a moderate-to-high positive genetic correlation between MET and RP. The longer period during which the birth canal is open in case of RP, leaves the uterus exposed to infection and therefore to MET (Benzaquen et al., Reference Benzaquen, Risco, Archibald, Melendez, Thatcher and Thatcher2007). Other studies found similar magnitude of correlation between these traits (Lin et al., Reference Lin, Oltenacu, van Vleck, Erb and Smith1989; Heringstad, Reference Heringstad2010; Koeck et al., Reference Koeck, Egger-Danner, Fuerst, Obritzhauser and Fuerst-Waltl2010). The genetic correlation between RP and MF was negative and close to zero. This result was somehow surprising, as hypocalcaemia (and therefore MF) render the animal more susceptible to RP (Goff and Horst, Reference Goff and Horst1997). Moreover, Heringstad et al. (Reference Heringstad, Chang, Gianola and Klemetsdal2005) found a low positive correlation between MF in the second and third lactations, and RP in any of the first three lactations. In contrast, these authors reported that MF in the first lactation had a weak negative genetic correlation with RP, but these results were not significant. The inclusion, in this study, of MF from all lactations might have caused a different genetic correlation with RP.
Conclusions
Health data recorded by the Canadian dairy producers can be used for genetic evaluation purposes. There is a component of variance associated with an additive genetic effect of liability to diseases that would enable selection for resistance against diseases. Relatively low heritability estimates based on the present dataset imply that genetic improvement for health traits will be very slow, and little genetic progress will be made unless these traits are heavily weighted in the selection programme and the selection index. Moreover, in this progeny testing structure, the number of daughters will likely be too small for newly evaluated bulls to have an accurate prediction of genetic value for these traits. A close monitoring of the completeness of data recording and stringent data validation would be required to ensure good data quality and accurate genetic evaluations.
Acknowledgements
Funding was provided by the Dairy Gen (Guelph, Ontario, Canada) and the Natural Sciences and Engineering Research Council of Canada (Ottawa, Ontario, Canada). Appreciation is extended to Ignacy Misztal for providing THRGIBBSF90 and POSTGIBBSF90 software, and to two anonymous reviewers for their comments.