1. Introduction
Climate change research has shown that temperature warming prevails more in winter than in other seasons (see, e.g., Laing and Binyamin, Reference Laing and Binyamin2013; Chen and Dong, Reference Chen and Dong2021). Further, an increasing body of research emphasizes the heterogeneous impact and trends from regional and long-term winter warming stress (Yang et al., Reference Yang, Lin, Ma, Ju, Guo, Xiong, Li and Xu2007; Zou et al., Reference Zou, Wang, Zhang and Koo2017; Qi et al., Reference Qi, Feng, Yang and Liu2022). This demands a strong interest in the evaluation of warming winter and its impact on the agricultural sector. However, recent research shows that it is important to consider rainfall and snow cover changes alongside temperature to evaluate the actual impact of warming winter on regional cropping patterns and yields (Zhu et al., Reference Zhu, Kim, Jin, Lin, Wang, Ciais, Mueller, Aghakouchak, Huang, Mulla and Makowksi2022).
As one of the largest countries in the world, China produces one-fourth of the world's grains and ranks first in the production of cereals.Footnote 1 According to the China Agricultural Statistical Yearbook, the planting area of wheat is 23.38 million hectares, which is approximately 23.87 per cent of total cereal planting area, and wheat production is 134.25 million tons in 2020, which is approximately 21.77 per cent of the total cereal production. Among all kinds of wheat, winter wheat has the largest share, accounting for 96 per cent of total wheat production. Given the large planting area and production, a small change in winter wheat yields per hectare would lead to a substantial change in total crop yields.
As has been shown in previous scientific literature, agricultural production is sensitive to climate change (see, e.g., Ju et al., Reference Ju, van der Velde, Lin, Xiong and Li2013; Elliott et al., Reference Elliott, Deryng, Müller, Frieler, Konzmann, Gerten, Glotter, Flörke, Wada, Best, Eisner, Fekete, Folberth, Foster, Gosling, Haddeland, Khabarov, Ludwig, Masaki, Olin, Rosenzweig, Ruane, Satoh, Schmid, Stacke, Tang and Wisser2014; Nelson et al., Reference Nelson, Valin, Sands, Havlíık, Ahammad, Deryng, Elliott, Fujimori, Hasegawa, Heyhoe, Kyle, Von Lampe, Lotze-Campen, Mason d'Croz, van Meijl, van der Mensbrugghe, Müller, Popp, Robertson, Robinson, Schmid, Schmitz, Tabeau and Willenbockel2014; Holzkämper, Reference Holzkämper2017). The average temperature in China has increased 1.2$^\circ$ C since 1960 and winter warming is four times the rate of summer warming (Piao et al., Reference Piao, Ciais, Huang, Shen, Peng, Li, Zhou, Liu, Ma, Ding, Friedlingstein, Liu, Tan, Yu, Zhang and Fang2010). Heavy precipitation would intensify with temperature increase in China at a rate of 6.25 per cent per degree of global warming (Zhang and Zhou, Reference Zhang and Zhou2020). In addition to temperature and precipitation, researchers also found that a reduction in snowpack may lead to a reduction in soil insulation and existing vegetation in the face of harsh cold temperatures (Abys et al., Reference Abys, Skakun and Becker-Reshef2022; Li et al., Reference Li, Qi, Smith, Pattey and Qian2022; Zhu et al., Reference Zhu, Kim, Jin, Lin, Wang, Ciais, Mueller, Aghakouchak, Huang, Mulla and Makowksi2022). This could lead to soil exposure and early vegetation to low temperatures despite the recent warming winters. Moreover, diminishing snowpack may lower soil water content following spring, worsening crop yields.Footnote 2
Though scholars have agreed on the fact that climate change affects agricultural output (see, e.g., Deschênes and Greenstone, Reference Deschênes and Greenstone2007; Hertel and Rosch, Reference Hertel and Rosch2010; Assunção and Chein, Reference Assunção and Chein2016; Kahsay and Hansen, Reference Kahsay and Hansen2016), most of the research conducted in this regard is based on heating degree days estimates from the Global North, whereas research from Global South countries is scarce due to the lack of granular crop yield data. Additionally, most research only considers the effect of heating degree days without taking into account that both heating and cooling degree days affect crop yield, and also underestimates the effect of precipitation and snow which is essential in the growth of crops. Utilizing satellite imagery of daily temperature, precipitation and snow depth, we are able to precisely identify winter wheat yields and corresponding climatic characteristics for Global South countries. In this paper, we address issues of temperature, precipitation and snow by combining measures of heating and cooling degree days, namely growing degree days (GDD) along with snow cover fraction (SCF) and freezing degree days (FDD). Furthermore, we provide evidence of snowpack insulation effect at different quantiles of winter wheat yields distribution using a novel method of quantile regression with fixed effects.
Specifically, we focus on the interaction of FDD and SCF across the three growing seasons (autumn, winter and spring) to estimate the effect of snowpack insulation on winter wheat yields using a panel data of 1,024 county-level administrative regions from 145 cities in 21 provinces in China, covering the period from 2001 to 2016. Based on a county fixed effects model, we include weather variables such as rainfall, temperature, and SCF to evaluate the impact of snowpack insulation on winter wheat yields while controlling for county-level fertilizers, soils and other county fixed effects to control for any time-invariant unobservables at the county level.
Our results show that a unit increase in FDD leads to a 2.37 kg/hectare winter wheat yield loss. Moreover, the increasing FDD causes consistent decreases in yields across the winter wheat yields distribution. Thus, we illustrate that freezing temperature harms yields as seen previously in Zhu et al. (Reference Zhu, Kim, Jin, Lin, Wang, Ciais, Mueller, Aghakouchak, Huang, Mulla and Makowksi2022). Moreover, we find that snowpack insulation, estimated using the interaction of FDD*SCF, is estimated to have a statistically significant negative effect at lower and middle quantiles of the winter wheat yields distribution, and a statistically significant positive effect at higher quantiles of the distribution. Thus, it indicates that with an increasing SCF, on the one hand, the negative effect of FDD persists at lower and middle quantiles of the winter wheat yields distribution; on the other hand, the negative effect of FDD will be offset at higher quantiles of the distribution. Additionally, heterogeneous analysis demonstrates that the effect of snowpack insulation on winter wheat yields persists for plots with higher yields in regions with low economic development, low labor input, low irrigation areas, and climate of arid and warm temperature.
This paper makes important contributions to the existing literature. First, we provide one of the first nonlinear estimates of the effect of snowpack insulation on winter wheat yields in China using a quantile regression model with county fixed effects. Differently from Zhu et al. (Reference Zhu, Kim, Jin, Lin, Wang, Ciais, Mueller, Aghakouchak, Huang, Mulla and Makowksi2022) which uses county fixed effects models, we utilize the quantile regression to assess the effect of snowpack insulation at different quantiles of winter wheat yields distribution. By focusing on estimates from different quantiles, we are able to paint a more accurate picture of the snowpack insulation effect and provide insights for specific quantiles of winter wheat yields distribution. We show that snowpack insulation has a negative effect at lower and middle quantiles but a positive effect at higher quantiles of winter wheat yields distribution, though the literature has mainly demonstrated a positive snowpack insulation effect (Zhu et al., Reference Zhu, Kim, Jin, Lin, Wang, Ciais, Mueller, Aghakouchak, Huang, Mulla and Makowksi2022).
Second, we measure snowpack insulation as well as other climatic characteristics accurately and provide a unique opportunity to validate the snowpack insulation effect with high-quality satellite imagery. Using satellite imagery of daily temperature, precipitation, snow depth and annual fertilizer and soil textures, we are able to precisely identify counties’ winter wheat yields and their environmental characteristics, especially for Global South countries without sufficient census datasets. This also sheds light on linking the scientific information with economic analysis, making it feasible to incorporate scientific information from satellite imagery with agricultural analysis. Moreover, though existing studies have investigated the heterogeneity effect of the snowpack insulation effect (Li et al., Reference Li, Qi, Smith, Pattey and Qian2022; Zhu et al., Reference Zhu, Kim, Jin, Lin, Wang, Ciais, Mueller, Aghakouchak, Huang, Mulla and Makowksi2022), we provide one of the first heterogeneity analyses from the perspective of economic development, labor input, irrigation and climate classification. Our findings suggest that temporary practices to increase SCF could be implemented, such as plastic mulch and artificial snow, which could be essential in keeping the snowpack insulation effect on winter wheat yields.
The rest of this paper is structured as follows. Section 2 presents the data. Section 3 presents the empirical strategy, and section 4 provides the main estimation results. Section 5 reports results from the robustness checks. Section 6 reports results from the heterogeneity analysis. Section 7 concludes by discussing important findings.
2. Data
2.1 Winter wheat yields
Our primary data consists of 1,024 county-level administrative regions from 145 cities in 21 provinces in China, covering the period from 2001 to 2016. We measure the county-level average winter wheat yields using the satellite imagery from Iizumi and Sakai (Reference Iizumi and Sakai2020) based on the Chinese county-level administrative regions. The satellite imagery of crop yields has been used in multiple analyses of yields (see, e.g., Zhang et al., Reference Zhang, Niu and Yu2021; Sun et al., Reference Sun, Zhao, Zhang, Chen, Ying, Lv, Che and Wang2022). Figure 1 presents the geographical locations of winter wheat growing regions in 2001, 2006, 2011 and 2016. As can been seen in figure 1, winter wheat is mostly cultivated in Northern China, such as in Shanxi Province, Shandong Province, Hebei Province and Henan Province, showing a good geographical coverage over a large territory in China.
Winter wheat yields in China, (a) Winter wheat yield in 2001, (b) Winter wheat yield in 2006, (c) Winter wheat yield in 2011, (d) Winter wheat yield in 2016. Notes: Solid blue lines represent boundaries of province-level administrative regions. Dashed black lines represent boundaries of county-level administrative regions. Red pixels represent high volume of winter wheat yields while green pixels represent low volume of winter wheat yields.

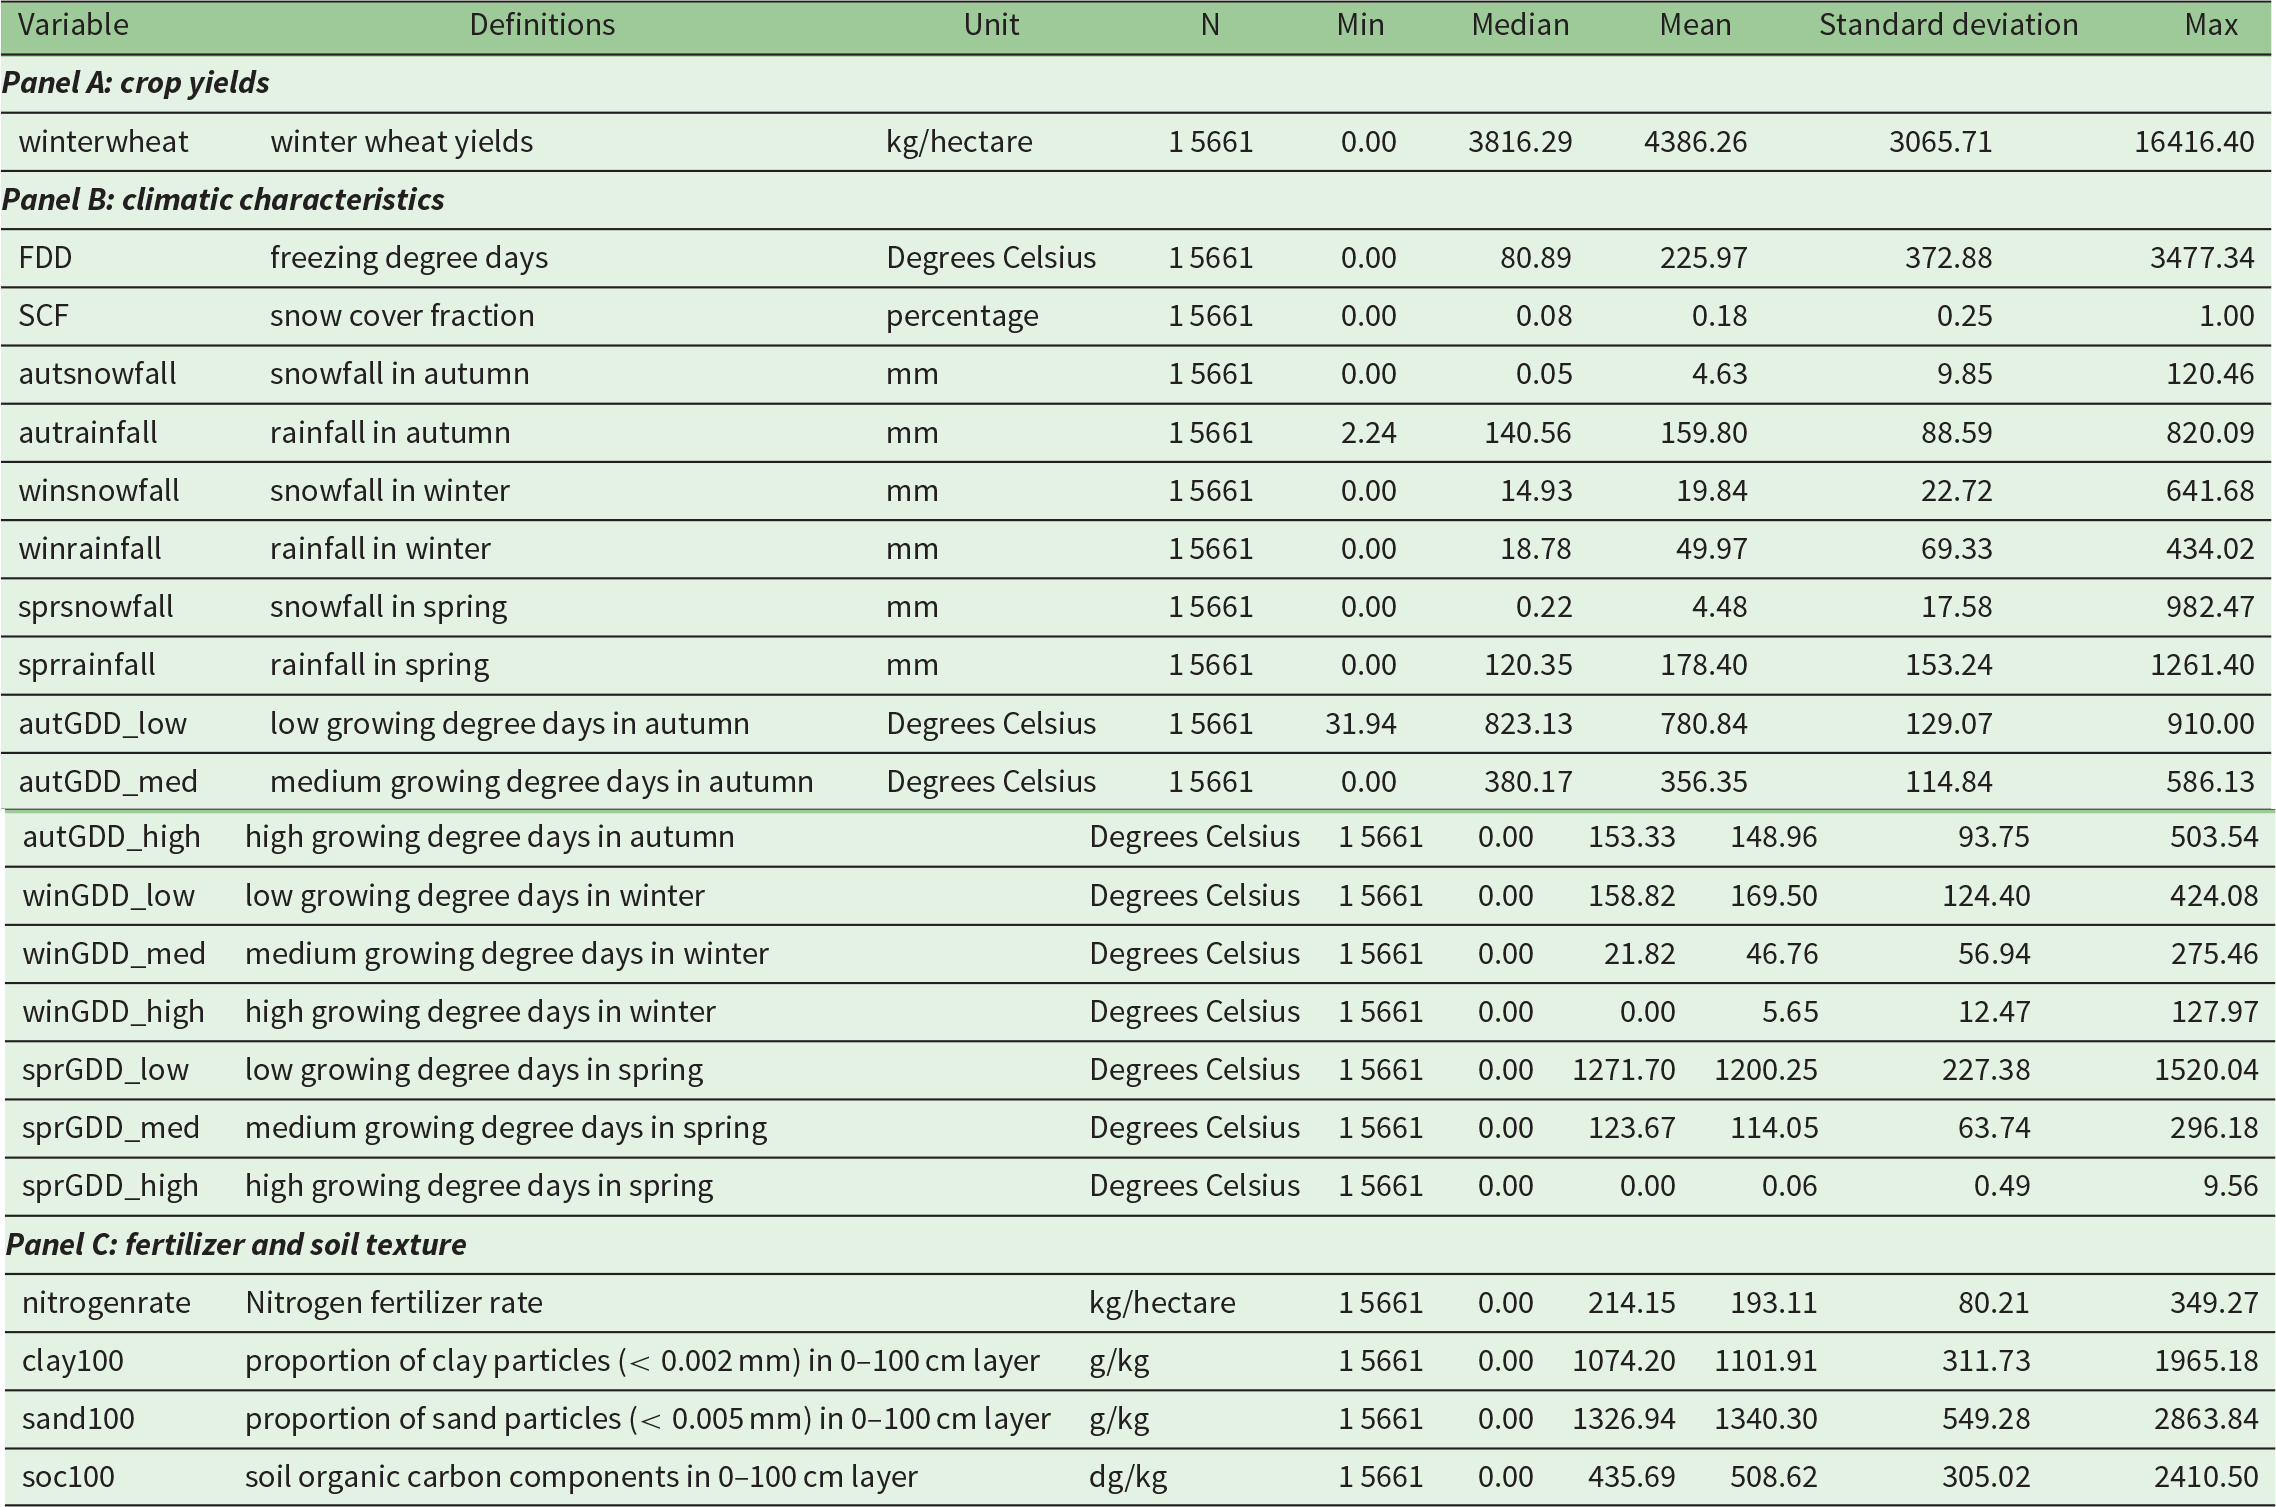
Table 1 presents variable definitions and summary statistics. As shown in panel A, the mean and standard deviation of winter wheat yieldsFootnote 3 are 4,386.26 kg/hectare and 3,065.71 kg/hectare, respectively. This indicates a high yields variability in our sample, which is consistent with large territory coverage in figure 1. In addition to winter wheat yields, we match the county-level winter wheat yields with county-level climatic characteristics, fertilizers and soils. The rest of this section includes our data-construction methods for climatic variables as well as fertilizer and soil texture.
Summary statistics

2.2 Climatic characteristics
We use daily temperature to construct the FDDFootnote 4 to investigate the effect of freezing stress occurrence on winter wheat yields (Zhu et al., Reference Zhu, Kim, Jin, Lin, Wang, Ciais, Mueller, Aghakouchak, Huang, Mulla and Makowksi2022). Additionally, we also use daily temperature to construct the GDDs in spring (March to May), autumn (September to November) and winter (December to February) following equation (1) from Zhu et al. (Reference Zhu, Kim, Jin, Lin, Wang, Ciais, Mueller, Aghakouchak, Huang, Mulla and Makowksi2022) to control for the thermal effect during the winter wheat growing seasons. As is shown in panel B of table 1, the mean and standard deviation of FDD are 225.97$^\circ$ C and 372.88$^\circ$
 C, respectively. For GDDs in autumn, winter and spring, we find that the mean and standard deviation for high GDD terms across three seasons are lower compared to low and medium GDD terms.Footnote 5
To investigate the effect of snowpack insulation expected to reduce the freezing stress on winter wheat yields, we construct the SCF using FDD as well as daily snow depth (SND) as a ratio of days when both FDD>0 and SND$>2$ cm, to days when FDD$>0$
 , following equation (2) from Zhu et al. (Reference Zhu, Kim, Jin, Lin, Wang, Ciais, Mueller, Aghakouchak, Huang, Mulla and Makowksi2022).Footnote 6 In addition to the insulation effect, snow is one of the important water storage sources that provides soil moisture. In order to control for the effect of water supply from snowmelt, we partitioned precipitation into rainfall and snowfall to represent water supply from different sources on the basis of daily temperature and daily precipitationFootnote 7 following equation (3) from Zhu et al. (Reference Zhu, Kim, Jin, Lin, Wang, Ciais, Mueller, Aghakouchak, Huang, Mulla and Makowksi2022). Panel B in table 1 shows that the mean and standard deviation of SCF are 0.18 and 0.25, respectively. This indicates that on average 18 per cent of days with freezing stress occurrence (FDD$>0$
 ) have SND greater than 2 cm. We also find that average snowfall in winter is 19.84 mm, which is higher than counterparts in spring (4.48 mm) and autumn (4.63 mm). Differently from snowfall, average rainfall in spring (178.40 mm) and autumn (159.8 mm) is higher than that in winter (49.97 mm). The difference between rainfall and snowfall in winter is consistent with intuition that snow is heavier in winter, leading to the fact that a higher proportion of precipitation is from snowfall instead of rainfall in winter than in autumn and spring.
2.3 Fertilizer and soil
As has been shown in previous literature, winter wheat yields are significantly affected by nitrogen fertilizer rates (Litke et al., Reference Litke, Gaile and Rua2018; Tabak et al., Reference Tabak, Lepiarczyk, Filipek-Mazur and Lisowska2020) and soil textures (Thaler et al., Reference Thaler, Eitzinger, Trnka and Dubrovsky2012; Johnen et al., Reference Johnen, Boettcher and Kage2014). We include the county-level nitrogen fertilizer ratesFootnote 8 and proportions of soil textures,Footnote 9 such as clay particles, sand particles and soil organic carbon components, to control for the effect of nitrogen fertilizer use and soil components on winter wheat yields (Zhu et al., Reference Zhu, Kim, Jin, Lin, Wang, Ciais, Mueller, Aghakouchak, Huang, Mulla and Makowksi2022). As shown in panel C of table 1, the mean and standard deviation of the nitrogen fertilizer rate are 193.11 kg/hectare and 80.21 kg/hectare, respectively. The mean and standard deviation of clay particles, sand particles, and organic carbon components are 1,101.91 g/kg and 311.73 g/kg, 1,326.94 g/kg and 549.28 g/kg, and 508.62 dg/kg and 305.02 dg/kg, respectively.Footnote 10
3. Empirical strategy
3.1 Conceptual framework
Our primary empirical strategy relies on quantile regression for panel data (QRPD), which is a special case of the generalized quantile estimator in which the estimator addresses a foundational problem of including fixed effects (Powell, Reference Powell2014a, Reference Powell2020, Reference Powell2022). Our choice of an empirical framework stems from the nature of the research objective and variables of interest. Our primary objective is to explore the heterogeneous impact of snowpack insulation on winter wheat yields. This indicates a potentially varying effect at different points in the conditional distribution of the outcome variable. Furthermore, the snowpack exhibits significant inter- and intra-annual variability (Mankin and Diffenbaugh, Reference Mankin and Diffenbaugh2015). Therefore, the variability is a crucial aspect of evaluating the impact of snowpack insulation on crop yields (Huning and AghaKouchak, Reference Huning and AghaKouchak2020; Qin et al., Reference Qin, Abatzoglou, Siebert, Huning, AghaKouchak, Mankin, Hong, Tong, Davis and Mueller2020).
Previous literature has shown that heterogeneous effects are useful information, but usually missed by mean regression techniques (Bitler et al., Reference Bitler, Gelbach and Hoynes2006; Powell, Reference Powell2014a; Powell and Wagner, Reference Powell and Wagner2014). Moreover, in recent advancements, there has been an impetus to combine the advantages of panel data regression as a tool to account for the unobserved heterogeneity with the ability of quantile regression to estimate robust estimates accounting for outliers (Koenker, Reference Koenker2004; Canay, Reference Canay2011; Galvao Jr, Reference Galvao2011; Ponomareva, Reference Ponomareva2011; Kato et al., Reference Kato, Galvao and Montes-Rojas2012). However, combining the quantile and panel regression, these methods exploit additive fixed effects in the quantile function at the cost of loss of generality in the quantile regression inference and interpretation. In a novel approach, Powell (Reference Powell2022) extends this approach to build non-additive fixed effects with conventional quantile regression advantages such as a nonseparable disturbance term.Powell (Reference Powell2022) provides an estimator in an instrumental variable framework for fixed effects that are consistent with the small time period and are feasible to estimate in standard econometric software.Footnote 11 Powell (Reference Powell2022) presented an estimator which utilizes fixed effects for identification purposes, while the results are interpreted as traditional cross-sectional quantile regression estimates. Fixed effects enable arbitrary correlation with the level of variables of interest, accounting for unobserved county-level differences in non-parametric specification.
In summary, our proposed empirical strategy has two key advantages. Firstly, our dataset shows that the winter wheat yields exhibit positive skewness, which indicates a potentially nonlinear relationship.Footnote 12 Previous researchers have argued that climatic variables such as temperature and rainfall have nonlinear relationships with crop yields (Schlenker and Roberts, Reference Schlenker and Roberts2009; Burke et al., Reference Burke, Hsiang and Miguel2015; Proctor, Reference Proctor2021). Therefore, we believe that the investigation of the winter wheat yields should take explicitly into account the distribution of outcome variables. However, several applied economic research studies regarding the effect of snowpack insulation on winter wheat yields do not explicitly model nonlinear relationships. We suggest that the quantile relationship is better suited for modeling climatic variables such as snowpack insulation and winter wheat yields. Furthermore, our proposed approach is robust to accounting for outliers in the data (Cameron and Trivedi, Reference Cameron and Trivedi2022; Powell, Reference Powell2022).
Secondly, we estimate the heterogeneous relationship between winter wheat yields and snowpack insulation with an explicit quantile function. The approach is semiparametric in terms of not having parametric distribution of regression errors and its departure from the normality assumptions (Cameron and Trivedi, Reference Cameron and Trivedi2022). Moreover, the nonlinear relationship between winter wheat yields and snowpack insulation has varying effects throughout the outcome distribution, and previous authors have found that snowpack insulation heterogeneously impacts crop yields (Li et al., Reference Li, Qi, Smith, Pattey and Qian2022; Zhu et al., Reference Zhu, Kim, Jin, Lin, Wang, Ciais, Mueller, Aghakouchak, Huang, Mulla and Makowksi2022). To our knowledge, we are one of the first to estimate the effect of snowpack insulation using a distribution of crop yields.
3.2 Model specification
We begin with an estimation of the two-way fixed effects (TWFE) model to estimate the relationship between the winter wheat yields and snowpack insulation effect as well as other climatic characteristics alongside the agro-economic variables such as fertilizer, and soil attributes. Our main estimating equation is specified as follows:

where $\mathrm {Wheat Yields}$ is the winter wheat yields. The ${\mathrm {FDD}}_{i,t}$
 is the FDD in county $i$
 at year $t$
 . The ${\mathrm {FDD}}_{i,t} \times {\mathrm {SCF}}_{i,t}$
 is the interaction term between FDD and SCF in county $i$
 at year $t$
 . The ${\mathrm {Snowfall}}_{i,t}^j$
 , ${\mathrm {Rainfall}}_{i,t}^j$
 and ${\mathrm {GDD}}_{i,t}^j$
 are the snowfall, rainfall and GDD in county $i$
 at year $t$
 for season $j$
 , respectively. The ${\mathrm {Fert}}_i$
 , ${\mathrm {Sand}}_i$
 , ${\mathrm {Clay}}_i$
 and ${\mathrm {OM}}_i$
 are the nitrogen fertilizer rates, clay particles, sand particles and soil organic carbon components in county $i$
 , respectively. The ${\mathrm {procitydis}}_i$
 is county FEs, controlling for any time-invariant unobserved heterogeneity at the county level. The ${\mathrm {time}}_{t}$
 denotes the year FEs.Footnote 13 We primarily focus on the estimates of $\alpha _1$
 and $\alpha _2$
 which represent the relationship between winter wheat yield with FDD and FDD*SCF.
In TWFE, the estimates reflect the average relationship, which is further refined in quantile regression as introduced by Koenker and Bassett Jr (Reference Koenker and Bassett1978). The following equation illustrates how the impact of the variable of interest changes based on total distribution:

To build on the framework from Powell and Wagner (Reference Powell and Wagner2014), the structural quantile function (SQF) can be written as

The SQF provides the $\tau$ th quantile of $y_{\mathbf {d}}=\mathbf {d}_i^{\prime } \beta (u^*)$
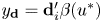 for a fixed $\mathbf {d}$
 and a randomly-selected $u^* \sim U(0,\,1)$
 . In our context, the SQFs provide the distributions of the outcome variable winter wheat yield. More specifically, we aim to account for covariates and fixed effects as shown in equation (1) as follows:

We present equation (2) building on Powell (Reference Powell2014a) with the aim of estimating the $\alpha _1$ and $\alpha _2$
 , which represents the relationship between the winter wheat yield with FDD and FDD*SCF.
4. Results
4.1 The impact of FDD
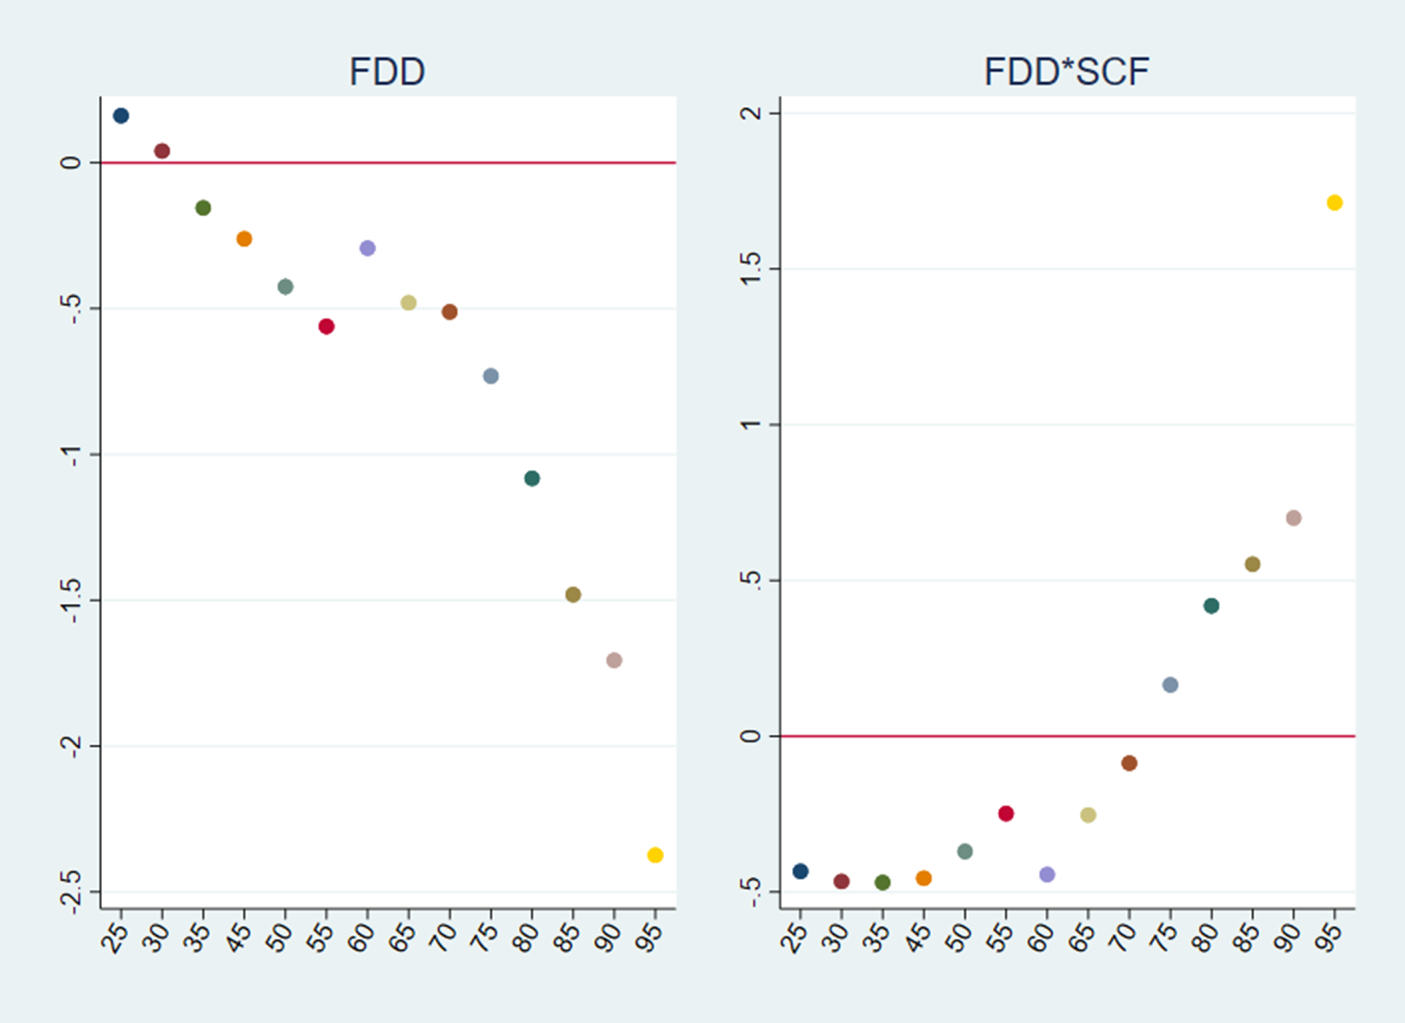
To paint an accurate picture for different quantiles, we choose 15 quantiles from the 25th to the 95th (i.e., 25th, 30th, 35th, 40th, 45th, 50th, 55th, 60th, 65th, 70th, 75th, 80th, 85th, 90th, 95th) following equation (2). Figure 2 provides a graphical representation of the QRPD estimation results for FDD and FDD*SCF in the left and right panels, respectively.Footnote 14 The left panel shows that FDD is estimated to have a statistically significant negative effect throughout the entire distribution of winter wheat yields with a few exceptions at lower quantiles (i.e., the 25th and 30th quantiles). This result indicates that a higher occurrence of freezing stress leads to a greater loss of winter wheat yields, which is also consistent with the findings from Zhu et al. (Reference Zhu, Kim, Jin, Lin, Wang, Ciais, Mueller, Aghakouchak, Huang, Mulla and Makowksi2022). This result is also aligned with previous literature that freezing temperature has a negative impact on crop yields (Verón et al., Reference Verón, De Abelleyra and Lobell2015; Zhang et al., Reference Zhang, Niu and Yu2021). Additionally, we find that the magnitudes of the FDD estimates are increasing from lower to higher quantiles of the winter wheat yields distribution, suggesting that higher occurrence of freezing stress decreases winter wheat yields in counties with higher winter wheat yields.Footnote 15 Based on the FDD estimate at the 95th quantile in column (15) in table A1 (online appendix), we find that a unit increase in FDD leads to a loss of 2.37 kg/hectare in winter wheat yields.Footnote 16
QRPD estimation results: FDD and FDD*SCF. Notes: The dependent variable in all regressions is the mean of winter wheat yields. The left panel shows QRPD estimation results for FDD and the right panel shows QRPD estimation results for FDD*SCF.

4.2 The impact of SCF
As indicated in equation (2), we investigate the snowpack insulation effect on winter wheat yields by accounting for the interaction term between FDD and SCF. As shown in the right panel of figure 2, we find that FDD*SCF is estimated to have a statistically significant negative effect at lower and middle quantiles of the winter wheat yields distribution (from the 25th to 70th quantiles), and a statistically significant positive effect at higher quantiles of the distribution (from the 75th to 95th quantiles), indicating that with an increasing SCF, on the one hand, the negative effect of FDD persists in lower and middle quantiles of the winter wheat yields distribution, while on the other hand, the negative effect of FDD will be offset at higher quantiles of the distribution. This result shows that the snowpack insulation effect could reduce the impact of freezing temperature, measured by FDD, at high quantiles of the winter wheat yields distribution; it is also different from Zhu et al. (Reference Zhu, Kim, Jin, Lin, Wang, Ciais, Mueller, Aghakouchak, Huang, Mulla and Makowksi2022) where the interaction term of FDD*SCF is estimated to have a statistically significant positive impact on wheat yields. Based on the estimate of FDD*SCF at the 95th quantile in column (15) in table A1 (online appendix) and the mean of FDD in table 1, we find that a one-percent increase in SCF leads to an increase of 3.87 kg/hectare in winter wheat yields.
4.3 The impact of GDD and snowfall
Figure 3 shows the results of the estimation of QRPD for all GDD terms.Footnote 17 Low GDD in autumn, medium GDD in autumn, low GDD in winter and high GDD in spring are estimated to have a predominantly statistically significant positive effect on winter wheat yields throughout the entire distribution of winter wheat yields. Based on estimates for high GDD in spring, we find that a unit increase in high GDD in spring increases winter wheat yields by 110 kg/hectare at the 50th quantile. This result is different from the findings from Zhu et al. (Reference Zhu, Kim, Jin, Lin, Wang, Ciais, Mueller, Aghakouchak, Huang, Mulla and Makowksi2022) where a high GDD in the spring is associated with a loss of wheat yields.
QRPD estimation results: GDDs. Notes: The dependent variable in all regressions is the mean of winter wheat yields. The top three panels show QRPD estimation results for GDD in autumn, the middle three panels show QRPD estimation results for GDD in winter and the bottom three panels show QRPD estimation results for GDD in spring.

The effect of water supply from snowmelt is represented by snowfall terms in autumn, winter and spring. As shown in the top three panels in figure 4,Footnote 18 we find that snowfall in autumn and winter is estimated to have a statistically significant positive effect on wheat wheat yields throughout the entire distribution. The magnitudes of snowfall estimates in autumn and winter are increasing from lower quantiles to higher quantiles. This result suggests a supportive role of snowfall on wheat growth by increasing moisture during the cold seasons, which is consistent with the findings of Zhu et al. (Reference Zhu, Kim, Jin, Lin, Wang, Ciais, Mueller, Aghakouchak, Huang, Mulla and Makowksi2022).
QRPD estimation results: snowfall and rainfall. Notes: The dependent variable in all regressions is the mean of winter wheat yields. The top three panels show QRPD estimation results for GDD in autumn, the middle three panels show QRPD estimation results for GDD in winter and the bottom three panels show QRPD estimation results for GDD in spring.

5. Robustness checks
5.1 Alternative snow cover fraction
In the previous section, we constructed SCF as a ratio of days when both FDD$>0$ and SND$>2$
 cm. To investigate whether threshold selection is a concern, we report estimates from alternative thresholds of SND, such as 5 cm, 10 cm, 15 cm and 20 cm. Figure A6 (online appendix) shows estimates for FDD and FDD*SCF with thresholds of SND for 5 cm, 10 cm, 15 cm and 20 cm. As can be seen in figure A6, the estimates of FDD in panels (a), (b), (c) and (d) are significantly negative, which is consistent with the results from figure 2. As SND thresholds are higher, the estimates for FDD*SCF are predominantly significantly positive. Though the estimates for FDD*SCF in figure A6 are different from the results in figure 2, the snowpack insulation effect still persists to offset the negative effect of FDD. The difference is due to a higher threshold of SND, which makes the effect of snowpack insulation stronger.
5.2 Alternative growing degree days
In the previous section, we constructed season-specific GDDs following thresholds used in Zhu et al. (Reference Zhu, Kim, Jin, Lin, Wang, Ciais, Mueller, Aghakouchak, Huang, Mulla and Makowksi2022). To alleviate the concern about threshold selection, we construct new season-specific GDDs following thresholds used in Tack et al. (Reference Tack, Barkley and Nalley2015). The thresholds to categorize low, medium and high GDDs are 0$^\circ$ C/18$^\circ$
 C/23$^\circ$
 C for autumn, 0$^\circ$
 C/5$^\circ$
 C/10$^\circ$
 C for winter, and 0$^\circ$
 C/17$^\circ$
 C/28$^\circ$
 C for spring. Furthermore, we also construct new non-season-specific GDDs following the thresholds of 0$^\circ$
 C/26$^\circ$
 C/35$^\circ$
 C used in Zhu et al. (Reference Zhu, Kim, Jin, Lin, Wang, Ciais, Mueller, Aghakouchak, Huang, Mulla and Makowksi2022). In figure A7 in the online appendix, panel (a) shows estimates for FDD and FDD*SCF using new season-specific GDDs and panel (b) shows estimates for FDD and FDD*SCF using new non-season-specific GDDs. Results from figure A7 show that FDD is estimated to have a statistically significant negative effect, which is consistent with findings from figure 2. From panel (a) in figure A7, FDD*SCF is estimated to have a statistically significant positive effect at higher quantiles of the winter wheat yields distribution (from the 75th to 95th quantiles), which is aligned with the results from figure 2. From panel (b) in figure A7, FDD*SCF is estimated to have a predominantly statistically significant positive effect, showing the existence of the snowpack insulation effect.
6. Heterogeneity analysis
6.1 Economic development
Previous literature has shown that nightlight is a good proxy for economic development (see, e.g., Chen and Nordhaus, Reference Chen and Nordhaus2011; Nordhaus and Chen, Reference Nordhaus and Chen2015; Gibson et al., Reference Gibson, Olivia, Boe-Gibson and Li2021). We construct the annual average of nightlight intensity at county-level administrative regions from 2001 to 2016Footnote 19 and categorize regions as low and high nightlight regions based on the median of nightlight intensity. Figure 5 shows QRPD estimation results for FDD and FDD*SCF for low and high nightlight regions. Panel (a) shows that FDD is estimated to have a statistically significant negative effect on winter wheat yields for regions with low nightlight intensity but a positive effect for regions with high nightlight intensity throughout the entire distribution of winter wheat yields. Panel (b) shows that FDD*SCF is estimated to have a statistically significant negative effect at lower and middle quantiles of the winter wheat yields distribution (from the 25th to 65th quantiles), and a positive effect at higher quantiles of the distribution (from the 70th to 95th quantiles). Comparing the results in figure 5 to the results in figure 2, we find that the snowpack insulation effect persists at higher quantiles of winter wheat yields distribution for regions with low nightlight intensity (FDD$<0$ and FDD*SCF$>0$
 ), indicating that a heterogeneous effect of snowpack insulation exists. One of the possible explanations is that agricultural activities are less likely to be invested in regions with low economic development (i.e., low nightlight intensity), preserving the original natural effect of snowpack insulation.
Heterogeneity analysis: nightlight, (a) QRPD estimation results: FDD, (b) QRPD estimation results: FDD*SCF. Notes: The dependent variable in all regressions is the mean of winter wheat yields. The top two panels show QRPD estimation results of FDD for low and high nightlight intensity. The bottom two panels show QRPD estimation results of FDD*SCF for low and high nightlight intensity.

6.2 Labor input
As is shown in Tongwei et al. (Reference Tongwei, Luo, Choy, Li and He2020) and Meiyan (Reference Meiyan2010), labor input is one of the important factors in agricultural productivity. To investigate the heterogeneous effect of snowpack insulation based on labor input, we construct the annual average population density at the county-level administrative regions from 2001 to 2016Footnote 20 and categorize them as low and high population density regions based on the median of population density. Figure 6 shows QRPD estimation results for FDD and FDD*SCF for low and high population density regions. Panel (a) shows that FDD is estimated to have a statistically significant negative effect on winter wheat yields for low population density regions but a statistically significant positive effect for high population density regions throughout the entire distribution of winter wheat yields. Panel (b) shows that FDD*SCF is estimated to have a significantly negative effect on winter wheat yields throughout the entire distribution with exceptions at the 90th and 95th quantiles for low population density regions. Comparing FDD and FDD*SCF estimates in figure 6 to those in figure 2, we find that the snowpack insulation effect persists at higher quantiles of the winter wheat yields distribution in low population density regions, indicating a heterogeneous effect of snowpack insulation exists. One of the possible explanations is that farmers are less likely to increase labor input in winter wheat cultivation in low population density regions, keeping the original natural effect of snowpack insulation.
Heterogeneity analysis: population density. Notes: The dependent variable in all regressions is the mean of winter wheat yields. The top two panels show QRPD estimation results of FDD for low and high population density. The bottom two panels show QRPD estimation results of FDD*SCF for low and high population density.

6.3 Irrigation intensity
As shown in previous scientific literature (Sun et al., Reference Sun, Liu, Zhang, Shen and Zhang2006; Liu et al., Reference Liu, Wiberg, Zehnder and Yang2007; Zeng et al., Reference Zeng, Yao, Zhang, Yang, Bai, Zhang, Wang and Wang2021), irrigation plays an important role in winter wheat yields. We construct the annual average irrigation area at the county-level administrative regions from 2001 to 2016Footnote 21 and categorize regions as low and high irrigation regions based on the median of irrigation area. Figure 7 presents QRPD estimation results for FDD and FDD*SCF for low and high irrigation regions. Panel (a) shows that FDD is estimated to have a statistically significant negative effect on winter wheat yields for low irrigation regions but a statistically significant positive effect for high irrigation regions throughout the entire distribution of winter wheat yields. Panel (b) shows that FDD*SCF is estimated to have a significantly positive effect on winter wheat yields at higher quantiles of winter wheat yields distribution for both low (90th and 95th quantiles) and high (80th to 95th quantiles) irrigation regions. Based on FDD and FDD*SCF estimates in low irrigation regions which are consistent with estimates of FDD and FDD*SCF from figure 2, we find that the snowpack insulation effect persists at higher quantiles of the distribution for the low irrigation regions, suggesting a heterogeneous effect of snowpack insulation exists. One of the possible explanations is that high irrigation regions are more likely to be affected by artificial irrigation, distorting the original natural effect of snowpack insulation.
Heterogeneity analysis: irrigation intensity. (a) QRPD estimation results: FDD, (b) QRPD estimation results: FDD*SCF. Notes: The dependent variable in all regressions is the mean of winter wheat yields. The top two panels show QRPD estimation results of FDD for low and high irrigation intensity. The bottom two panels show QRPD estimation results of FDD*SCF for low and high irrigation intensity.

6.4 Climate classifications
As shown in figure 1, winter wheat is cultivated in a large territory in China, covering different climatic regions from warm to snow as well as humid to arid. To investigate the heterogeneous effect of climate classifications, we split regions into three categories: arid, temperature and perhumid.Footnote 22 Figure 8 shows QRPD estimation results for FDD and FDD*SCF for the climate of arid, temperature and perhumid. As can be seen in panel (a), FDD is estimated to have a statistically significantly negative effect on winter wheat yields throughout the entire distribution for all three climate classifications. Panel (b) shows that FDD*SCF is estimated to have a predominantly statistically significant positive effect on winter wheat yields for the climate of arid and temperature but a predominantly negative effect for perhumid. Based on FDD and FDD*SCF estimates in figure 8, we find that the snowpack insulation effect persists for the climate of arid and temperature, indicating a heterogeneous effect of snowpack insulation for different climate classifications.
Heterogeneity analysis: climate classifications. (a) QRPD estimation results: FDD, (b) QRPD estimation results: FDD*SCF. Notes: The dependent variable in all regressions is the mean of winter wheat yields. The top three panels show QRPD estimation results of FDD for arid, warm temp and snow climate classifications. The bottom two panels show QRPD estimation results of FDD*SCF for arid, warm temp and snow climate classifications.

7. Discussion and conclusion
In this paper, we investigate the heterogeneous effect of snowpack insulation on winter wheat yields in China. Taking advantage of satellite imagery, we construct a county-level panel data, including winter wheat yields, climatic characteristics, fertilizer and soil textures to investigate the effect of snowpack insulation on winter wheat yields. Using the QRPD with additive fixed effects such as year and county fixed effects, we reveal the varying effects of snowpack insulation at different quantiles of the winter wheat yields distribution. In addition, we account for economic development, labor input, irrigation areas and climate classifications to provide a thorough understanding of the snowpack insulation effect for heterogeneous analysis.
Several key findings emerge from our analysis. First, our results demonstrate that FDD has a significantly negative effect on winter wheat yields and its magnitudes increase from lower to higher quantiles of the winter wheat yields distribution. Second, by accounting for the interaction term between FDD and SCF, our results show that FDD*SCF has a significantly positive effect at higher quantiles of the winter wheat yields distribution, indicating that the negative effect of FDD will be offset and the effect of snowpack insulation exists at higher quantiles of the distribution. Third, we show that high GDD in spring has the highest positive effect on winter wheat yields among all GDD terms. Our estimates also suggest that snowfall in autumn and winter has a positive effect on winter wheat yields throughout the entire distribution, showing a supportive role of moisture from snowmelt.Footnote 23 Lastly, results from heterogeneity analysis demonstrate that the snowpack insulation effect on winter wheat yields persists at higher quantiles of the winter wheat yields distribution in regions with low economic development, regions with low labor input, regions with low irrigation areas as well as regions with the climate of arid and warm temperature.
This study has important policy implications. First, given the fact that a unit increase in FDD leads to a loss of 2.37 kg/hectare in winter wheat yields, temporary defensive actions could be essential in mitigating the negative effect of freezing stress. For example, farmers could choose to use plastic mulch to protect crops from freezing cold and increase crop yields (Liu and Siddique, Reference Liu and Siddique2015; Gao et al., Reference Gao, Yan, Liu, Ding, Chen and Li2019). Second, a back-of-the-envelope calculation suggests that preserving the snowpack insulation effect could bring meaningful economic benefits. For example, our estimate indicates that a unit increase in FDD leads to a loss of 2.37 kg/hectare, which would result in a winter wheat yield loss of 128.93 kg/ha from 2015 to 2016 or a total loss of 2.919 million tons on a national scale.Footnote 24 Consequently, the monetary value of the winter wheat yields loss on the national scale for each year would be approximately 1084.85 million dollars.Footnote 25 Third, as the snowpack insulation effect exists, especially for higher quantiles of winter wheat yields distribution, temporary practices to increase the SCF could be implemented to increase the snowpack insulation effect against the impact of freezing temperature. For example, local government could implement artificial snow under proper meteorological conditions to increase the SCF to keep a stronger snowpack insulation effect. Lastly, results from heterogeneity analysis indicate that temporary and protective measures could be implemented particularly for specific regions with low economic development, regions with low labor input, regions with low irrigation areas as well as regions with climate of arid and warm temperature.
Supplementary material
The supplementary material for this article can be found at https://doi.org/10.1017/S1355770X25000154
Acknowledgements
This work was supported by Youth Innovative Talent Project of Guangdong Province, China (Grant No.2023KQNCX097); 2023 University Stabilization Support and Funding Program of Shenzhen. Young Scientists Fund of the National Nature Science Foundation of China (Grant No.72403166).
Competing interests
The authors declare none.