I. INTRODUCTION
Utilization of high dielectric constant metal-oxide systems has been widely investigated as an essential component in metal-oxide-semiconductor (MOS)-based devices as a gate dielectric for decades.Reference Wilk, Wallace and Anthony1–Reference Lee, An, Park, Choi and Kim3 In particular, ZrO2 has gained great interest due to its high enough κ value (22–25), suitably large band gap (5.8–7.8 eV), good thermodynamic stability when in contact with Si up to ∼900 °C of processing temperature, and minimal lattice mismatch with Si(100). Moreover, it can be easily stabilized in the form of cubic or tetragonal polymorphs, which may further enhance its effective κ value.Reference Wilk, Wallace and Anthony1,Reference Wong and Cheong2,Reference Jõgi, Kukli, Ritala, Leskelä, Aarik, Aidla and Lu4
Various methods have been used by several groups of researchers to form ZrO2 thin films on Si substrate, for example, thermal evaporation, pulsed laser deposition, atomic layer deposition, metalorganic chemical vapor deposition, and sputtering.Reference Miyazaki5–Reference Zhu, Fang, He, Liu and Zhang9 Highly dependent on the deposition techniques, various characteristics and quality of ZrO2 thin films can be fabricated. Based on the reported literature, a combination of metallic Zr sputtering and thermal oxidation process in O2 ambient is able to produce stoichiometric ZrO2 thin films.Reference Wong and Cheong2,Reference Hsieh, Ko, Kuei and Lee10–Reference Nagasato, Aya, Iwazaki, Hasumi, Ueno and Kuroiwa12 However, this process initiates the diffusion and reaction between oxygen, silicon, and zirconium, causing an inevitable formation of undesirable interfacial layer (IL) in between ZrO2 thin film and Si substrate. As a result, capacitance of the MOS capacitor was reduced, and performance of the MOS-based devices was deteriorated.
The presence of nitrogen in the film may help to reduce the IL thickness in between ZrO2 and Si. It is believed that nitrogen content in the film can help to suppress the out-diffusion of Si by passivating the dangling bonds of the Si surface and improve the hot carrier resistance at the Si-dielectric interface.Reference de Almeida and Baumvol13–Reference Chen, Lai and Chen15 Based on several reported papers,Reference Chen, Lai and Chen15–Reference Koyama, Suguro, Yoshiki, Kamimuta, Koike, Ohse, Hongo and Nishiyama17 ZrO2 films have shown well-behaved electrical characteristics in the presence of nitrogen. To perform oxidation and nitridation simultaneously, NO and N2O are the typical gases used.Reference de Almeida and Baumvol13 As compared to NO, N2O is more suitable and preferable to be used due to its nontoxic property.Reference Enta, Suto, Takeda, Kato and Sakisaka18 Extending from the previous reported works,Reference Wong and Cheong19–Reference Wong and Cheong22 N2O has been used to act as the oxidation as well as nitridation source to form tetragonal-ZrO2 thin films on the Si substrate. Electrical performance of the tetragonal-ZrO2/Si system formed in N2O ambient has been studied up to 15 min. The studies provided high enough effective dielectric constant values of 10.58–21.82, with relatively low densities of effective oxide charge, slow-trap, and interface-trap. However, up to date, no investigation has been carried out on the electrical performance for tetragonal-ZrO2/Si system formed in N2O ambient for an extended time. It has been reported that a complete catalytic decomposition of N2O on ZrO2 happens at a temperature of 700 °C; hence, this particular temperature was chosen in this study.Reference Wong and Cheong19 The purpose of the time extension is to ascertain whether time extension could help in improving the electrical properties of the tetragonal-ZrO2/Si system as compared to previous works.Reference Wong and Cheong19,Reference Wong and Cheong21 Therefore, in this work, tetragonal-ZrO2 was formed by simultaneous oxidation and nitridation of sputtered Zr thin film on Si at various temperatures for an extended time of 20 min in N2O ambient. Capacitance–voltage (C–V) and current–voltage (I–V) measurements have been conducted to investigate the electrical properties of tetragonal-ZrO2 thin films fabricated in this work.
II. EXPERIMENTAL PROCEDURES
(100)-oriented n-type Si substrates (1–10 Ω cm) were subjected to a standard RCA cleaning and diluted HF solution treatment (1 HF:50 H2O) for 15 s to remove native oxide from the surface prior to metallic Zr sputtering. Edwards Auto 500 RF sputtering system was used to deposit an ultrathin 5-nm Zr metal thin film on the cleaned Si substrates by using a Zr metal target (Alfa Aesar, 99.5%, Alfa Aesar, UK). RF power, working pressure, inert Ar gas flow, and deposition rate were regulated at 170 W, 1.2 × 10⁻⁷ Torr, 20 cm3/min, and 2 Å/s respectively. After the deposition, samples were placed into a horizontal tube furnace and heated up from room temperature to a set of temperatures (500, 700, 900, and 1100 °C) in an Ar flow ambient and the heating rate was constant at 10 °C/min. Once the set temperature was reached, N2O gas was then introduced with a flow rate of 150 mL/min for 20 min. Samples were eventually taken out at room temperature after the furnace was cooled down to room temperature in an Ar ambient.
MOS capacitors were fabricated to conduct electrical characterization. A layer of 100-nm thick Al was thermally evaporated on top of the films. Subsequently, an array of 9 × 10⁻⁴ cm2 of Al gate electrode was patterned by photolithography process using a shadow mask. Last, an Ohmic back contact was fabricated by depositing a 100-nm thick Al film on backside of the Si substrate after removal of native oxide. The electrical properties of the MOS capacitors were then characterized by high-frequency (1 MHz) capacitance–voltage (C–V) and current–voltage (I–V) measurements using a computer-controlled Agilent HP4284 LCR meter (Agilent Technologies, Santa Clara, CA) and HP4155-6C semiconductor parameter analyzer (SPA; Agilent Technologies, Santa Clara, CA), respectively.
III. RESULTS AND DISCUSSION
High-frequency C–V characteristics of MOS capacitors with ZrO2 thin film oxidized and nitrided at different processing temperatures (500–1100 °C) for 20 min are shown in Fig. 1. Different saturation capacitance can be observed at the accumulation level. The highest capacitance is attained by the sample oxidized/nitrided at 700 °C, followed by 500, 900 °C, and the lowest capacitance is obtained by 1100 °C oxidized/nitrided sample. This could be due to the formation of IL that may aggravate the dielectric polarization of the oxidized/nitrided sample, thus reducing the capacitance. The effective dielectric constant (κeff) can be calculated based on the following general equationReference Lee, An, Park, Choi and Kim3:
 $${C_{{\rm{ox}}}} = {{\rm{\kappa }}_{{\rm{eff}}}}{{\rm{\varepsilon }}_{\rm{0}}}A{\rm{/}}{t_{{\rm{ox}}}}\quad ,$$
where C ox is the capacitance of the oxide, ε0 is the permittivity of free space, A is the area of the capacitor, and t ox is the total oxide thickness (ZrO2 + IL). C ox was obtained from the saturation capacitance at the accumulation level (Fig. 1), and the total oxide thickness was obtained from the energy-filtered transmission electron microscope image in Ref. Reference Wong and Cheong19. The total oxide thickness of 20-min oxidized/nitrided sample was approximately 11 nm. The calculated κeff values are in the range of 7.04–18.22 (inset of Fig. 1), depending on the oxidation/nitridation temperature. The highest κeff value (18.22) is attained by 700 °C oxidized/nitrided sample. This obtained value is comparable with the value reported in Ref. Reference Chiu, Lin, Chang, Wang, Chuang, Huang, Lee and Hwang23 and slightly lower than the values reported in Refs. Reference Wang, Zhao, Luu, Wang and Nakashima24 and Reference Wong and Cheong20.
C–V characteristics of the investigated samples oxidized/nitrided at various temperatures. The inset shows the calculated κeff values as a function of oxidation/nitridation temperature.

Depletion region is generally observed in the negative bias, and flatband voltage is shifted (ΔV FB) negatively for all characterized capacitors. This indicates the existence of positive effective oxide charges (Q eff) in the oxide.Reference Schroder25 The formation of positive oxide charges might be due to the presence of traps in the oxide, contributed by the Zr and Si dangling bonds. The Q eff contained in the samples can be calculated by the following equationReference Schroder25:
 $${Q_{{\rm{eff}}}} = {\rm{(}}\Delta {V_{{\rm{FB}}}}{\rm{)}}{C_{{\rm{ox}}}}{\rm{/}}qA\quad ,$$
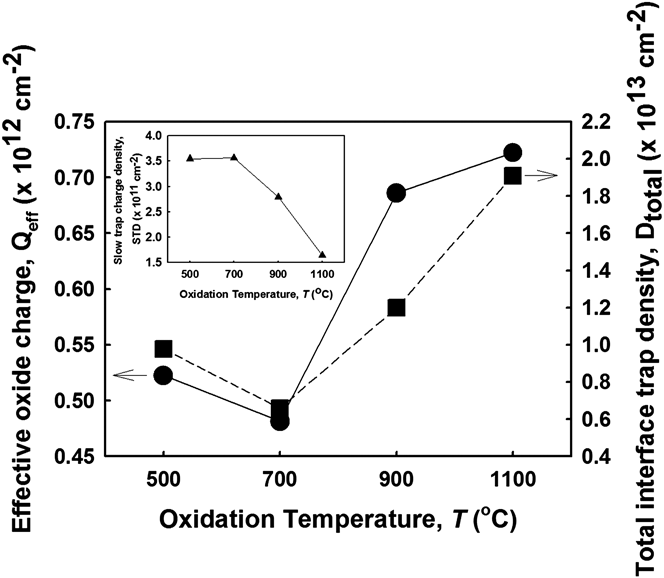
where q is the electronic charge. The calculated Q eff for each sample is presented in Fig. 2. The lowest Q eff is acquired by 700 °C oxidized/nitrided sample (4.81 × 1011 cm−2), which is lower than the value reported in Ref. Reference Kurniawan, Cheong, Abdul Razak, Lockman and Ahmad26.
Effective oxide charge and total interface-trap density in the investigated sample as a function of oxidation/nitridation temperature. The inset shows STD in the investigated sample as a function of oxidation/nitridation temperature.
Hysteresis of the C–V measurements between forward and reverse bias is detected in all samples. As explained by Tanner et al.Reference Tanner, Dimitrijev and Harrison27 and Dimitrijev et al.,Reference Dimitrijev, Tanner and Harrison28 this phenomenon occurs due to slow traps located at some distance from the interface. The slow trap density (STD) can be indirectly associated with the hysteresis based on the following equation:
 $${\rm{STD = (}}\Delta V{\rm{)}}{C_{{\rm{ox}}}}{\rm{/}}qA\quad ,$$
where ΔV is the difference between flatband voltages of a hysteresis curve. Based on the calculated value (inset of Fig. 2), it is revealed that 700 °C oxidized/nitrided sample has the highest STD (3.57 × 1011 cm−2). The change in STD as a function of oxidation/nitridation temperature is in the reverse trend of Q eff. The oxide charge and hysteresis of the films formed at different temperatures show differences that could be due to the IL thickness change, as reported in Ref. Reference Wong and Cheong21.
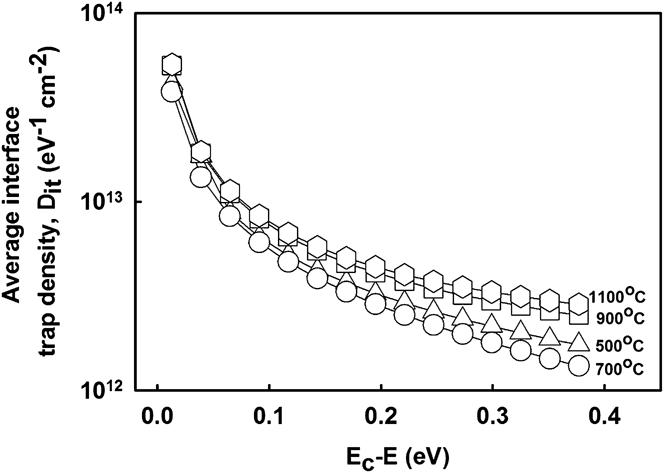
Figure 3 shows the oxide-semiconductor interface-trap density (D it) of the investigated samples with respect to the energy level of the trap. The D it value was estimated from high frequency C–V measurements using Terman method that had been performed at room temperatureReference Schroder25:
 $${D_{{\rm{it}}}} = {\rm{(}}{C_{{\rm{ox}}}}{\rm{/}}qA{\rm{)}} \cdot {\rm{[d(}}\Delta {V_{\rm{g}}}{\rm{)/d(}}{\phi _{\rm{s}}}{\rm{)]}}\quad {\rm{,}}$$
where φs is the surface potential of Si at a specific gate voltage, V g. The surface potential of a particular capacitance is taken from an ideal MOS capacitor. The gate voltage is then acquired from the experimental C–V curve of the same capacitance as that of φs. The steps are repeated for other data points until a relevant D it against (E c–E) curve is obtained.
Interface-trap density of the investigated sample oxidized/nitrided at various temperatures.
From the D it curves, 700 °C oxidized/nitrided sample shows the lowest D it. The D it value obtained at an energy level of 0.2 eV from this experiment is comparable to other reported works, which is in the order of ∼1012 per eV per cm2.Reference Wang, Zhao, Luu, Wang and Nakashima24,Reference Hembram, Dutta, Waghmare and Mohan Rao29 To determine the total interface-trap density (D total) of the energy range (E c–E), the area under the D it − (E c–E) plot was calculated (Fig. 2). The variation of D total as a function of oxidation time is similar to the changes of Q eff. The reduction of D total is most probably due to incorporation of nitrogen in the ILs. The lowest total interface-trap density obtained in this experiment is 7.21 × 1012 cm−2, which is obtained from 700 °C oxidized/nitrided sample. The D it and D total increase with temperature could be due to the concentration of Si–N, which is too high or much higher than the concentration of Zr–N in the sample, as reported in Ref. Reference Wong and Cheong21.
Figure 4 shows the leakage current density–electric field (J–E) characteristics of the investigated samples. The J–E plot was transformed from current–voltage (I–V) measurements obtained from the computer-controlled SPA system. The E value was estimated byReference Schroder25:
 $$E = ({V_{\rm{g}}} - {V_{{\rm{FB}}}})/{t_{{\rm{ox}}}}\quad .$$
J–E characteristics of investigated sample oxidized/nitrided at various temperatures.
There is a two-step oxide breakdown (E B and E HDB) observed in the J–E plot for all investigated samples (Fig. 4), due to the presence of interfacial and ZrO2 layers in the sample.Reference Xiaolong, Qianghua and Tao30 The breakdowns can be explained as follows. One of the layers may experience an electrical breakdown at a lower field, which is labeled as E B. Subsequently, another layer would block the carriers. Due to increment of electric field, the concentration of the carrier increases until the layer is electrically broken down at a higher electric field at E HDB. The instantaneous increment of leakage current density at E B is relatively small when compared with others and it is defined as soft breakdown. In contrast, the instantaneous increment of current density at E HDB is large and this is considered as hard breakdown. The trend of E HDB as a function of oxidation/nitridation temperature is reverse when compared with the trend of effective oxide charge (Fig. 2) and of total interface-trap density (Fig. 2) with respect to the oxidation/nitridation temperature. As the density of effective charge and that of interface trap reduce, electrical breakdown field increases. In addition, the breakdown field is also affected by STD (inset of Fig. 2). It is observed that as the trap density is higher, a larger breakdown field can be obtained. The highest dielectric breakdown field, which is referred to as hard breakdown, is attained by 700 °C oxidized/nitrided sample (10.7 MV/cm). The lowest one is recorded by 1100 °C oxidized/nitrided sample (8.6 MV/cm). In comparison, the highest breakdown field recorded in this work is higher than the previous reported works.
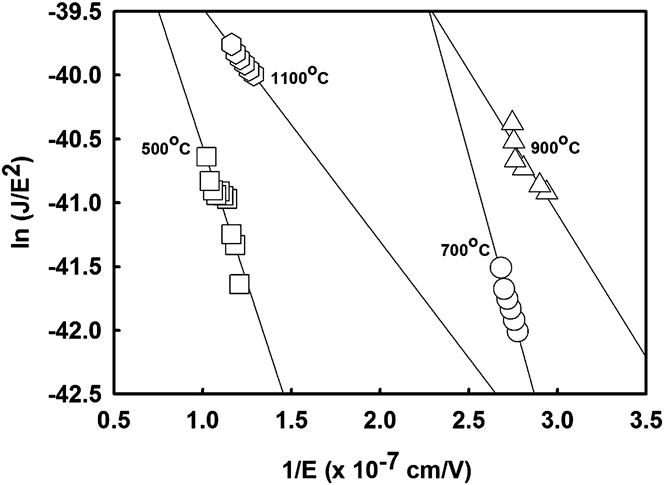
F–N tunneling linear regression plot [ln(J/E 2) − 1/E] of investigated sample oxidized/nitrided at various temperatures.
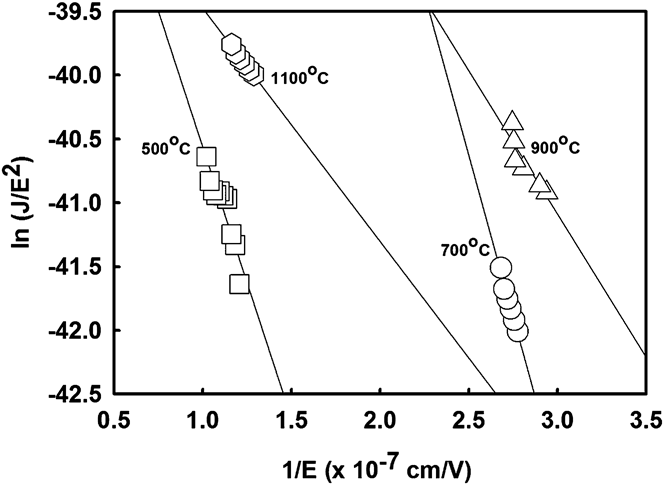
Barrier height (φB) of conduction band edge between Si and the oxidized layer was extracted from Fowler–Nordheim (FN) tunneling model. FN tunneling is referred to the flow of electron through a triangular potential barrier into the conduction band of an insulator.Reference Schroder25 The J attributed to FN tunneling (J FN) can be defined as followsReference Schroder25:
 $${J_{{\rm{FN}}}} = A{E^{\rm{2}}}{\rm{exp(}} - B{\rm{/}}E{\rm{)}}\quad {\rm{,}}$$
where
 $$A = 1.54 \times {10^{ - 6}}(m/{m_{{\rm{ox}}}}\phi B)\quad ,$$
and
 $$B = 6.83 \times 107{({m_{{\rm{ox}}}}\phi {B^3}/m)^{1/2}}\quad ,$$
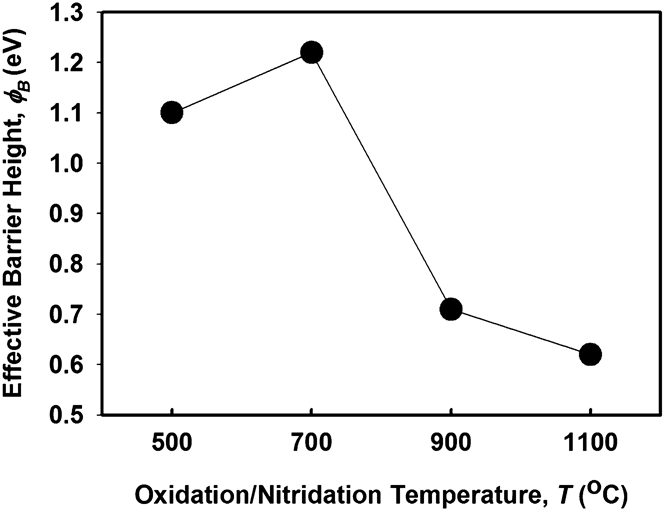
where m ox is the effective electron mass in the oxidized layer, and m is the free electron mass. A linear FN plot of ln (J FN/E 2) versus 1/E is presented in Fig. 5. The intercept of the plot yields A and the gradient of the slope yields B. To calculate φB, the electron effective mass of the investigated oxide is assumed to be 0.3m.Reference Chiu, Lin, Chang, Wang, Chuang, Huang, Lee and Hwang23 The calculated φB as a function of oxidation/nitridation temperature is presented in Fig. 6. The extracted φB values are ranging from 0.62 to 1.22 eV. The highest value was attained by 700 °C oxidized/nitrided sample (1.22 eV). Comparatively, the highest value obtained in this work is comparable to the value reported (1.23 eV) by thermally evaporated ZrO2 on Si.Reference Miyazaki5
Barrier height values as a function of oxidation/nitridation temperature.
IV. CONCLUSION
In conclusion, ZrO2 has been formed by simultaneous oxidation and nitridation of sputtered Zr thin film on n-type Si at different temperatures (500–1100 °C) in N2O environment for an extended time of 20 min. The electrical properties of the thin films were investigated. Results indicated that the highest effective dielectric constant of 18.22 and electrical breakdown field of 10.7 MV/cm at 10−6 A/cm2 were attained by 700 °C oxidized/nitrided sample. This is attributed to the lowest effective oxide charge, interface trap density, total interface trap density, and increment of barrier height between conduction band edge of the film and the semiconductor.
ACKNOWLEDGMENTS
One of the authors (YHW) would like to acknowledge University of Malaya for the financial support through UMRG program (Grant No. RP013D-13AET) and PRPUM (Grant No. CG022-2013).