


1. Introduction
What are the sources of the business cycle? This article studies how sudden changes in bank credit supply impact economic activity. I use a general equilibrium model where firms can borrow from banks and markets to study how disruptions in bank supply affect firms’ funding decisions and their activity. The model implies that only bank supply shocks generate opposite movements in bond and loan volumes. I use this qualitative prediction in a sign-restriction vector autoregression model (VAR) to identify the sources of economic fluctuations. Bank shocks account for a third of US business cycles over the past 30 years and are predictive of broad measures of credit conditions as proxied by the bond spread.
Figure 1 plots the growth rates of loan and bond volumes for US nonfinancial corporate firms. Two key features stand out from this graph. First, corporate loans are highly procyclical, increasing in periods of expansion and falling during recessions. Second, while bonds and loans comove along the cycle, the two series systematically diverge in response to recessions. In what follows, I use movements in the two types of corporate debt to identify bank shocks. To study how bonds and loans respond to various types of macroeconomic shocks, I augment the workhorse new Keynesian (NK) model with the mechanism of debt choice from De Fiore and Uhlig (Reference De Fiore and Uhlig2011, Reference De Fiore and Uhlig2015). The model assumes banks are more efficient than markets in reducing asymmetric information problems but also more costly. I find that only bank shocks generate procyclical loans and opposite movements in loans and bonds on impact. This is because, following an adverse bank shock, firms adjust their funding to the deteriorated credit conditions and substitute bonds for loans while cutting down on production and employment. On the other hand, supply, monetary, and other demand shocks generate comovements in the two types of debt. Accordingly, bank shocks can explain both the procyclicality of loans and the opposite movements of bonds and loans observed during recessions while other shocks cannot. In the second part of the paper, I use the qualitative predictions of the modified NK model to inform a sign-restriction VAR model estimated with aggregate US corporate firm balance sheet data. Bank shocks account for a large share of the US business cycle and are identified around specific events such as the Japanese crisis, the LTCM crisis, and the Great Recession. In the final part, I estimate the modified NK model to minimize the distance between its impulse responses and those from the VAR model.Footnote 1 The modified NK model can reproduce both the qualitative and quantitative features implied by the VAR model. This is true for all types of shock. I use the estimated model to recover the bank shocks and construct a measure of the bond spread. Comparing the model variable to its data counterpart, I find that the two series strongly correlate over the past 30 years. I also find that the bank shocks are predictive of the bond spread as observed in the data. This property can only be attributed to the relative movements in bond and loan series as no data on the cost of credit is used in the estimation.
The rest of the paper is organized as follows. Section 2 provides a discussion of the relevant literature. Section 3 introduces the modified NK model, section 4 presents the calibration of the model and discusses its properties. Section 5 lays out the sign-restriction VAR model. Section 6 estimates the modified NK model and provides out-of-sample exercises. Section 7 concludes.
Bond and loan growth rates.
Note: Bond and loan quarterly growth rates for US nonfinancial corporate firms. The orange and blue bars correspond, respectively, to bank loans and bonds. Gray bands correspond to NBER recession dates. Source: Flow of Funds.

2. Literature review
Over the past twenty years, various papers have studied the impact of financial shocks on business cycles. On the dynamic stochastic general equilibrium modeling (DSGE) front, Gilchrist, et al. (Reference Gilchrist, Otiz and Zakrajsek2009), Nolan and Thoenissen (Reference Nolan and Thoenissen2009), Christiano, et al. (Reference Christiano, Motto and Rostagno2014), Ajello (Reference Ajello2016) and Becard and Gauthier (Reference Becard and Gauthier2022) use models embedding credit frictions to show that financial shocks can jointly explain most of the fluctuations observed in financial and nonfinancial variables. Based on VAR models, Meeks (Reference Meeks2012), Fornari and Stracca (Reference Fornari and Stracca2012), Caldara, et al. (Reference Caldara, Fuentes-Albero, Gilchrist and Zakrajsek2016) and Furlanetto, et al. (Reference Furlanetto, Ravazzolo and Sarferaz2017) identify financial shocks with sign-restriction methods and also find that financial shocks explain a large share of the US business cycle.
The present article tries to complement this literature in two directions. First, the above-mentioned articles mainly rely on credit spreads and asset prices to proxy for credit conditions and identify financial shocks. Because financial stress can result in credit rationing rather than in price changes, such strategies have been shown to misrepresent credit conditions faced by firms.Footnote 2 I propose instead an identification strategy based on the relative movements in bond and loan volumes, I use credit spreads ex-post to perform out-of-sample tests. Second, this article seeks to distinguish bank credit supply shocks from more generic shocks such as the risk premium shock of Smets and Wouters (Reference Smets and Wouters2007) or other financial shocks with similarly broad interpretations.Footnote 3 To do so, I build on the literature that studies the impact of bank credit supply on firms’ funding decisions. Adrian, et al. (Reference Adrian, Colla and Shin2013), Becker and Ivashina (Reference Becker and Ivashina2014), and Altavilla, et al. (Reference Altavilla, Pariès and Nicoletti2015) all find that corporate firms strongly substitute bonds for loans in the face of adverse bank credit supply shocks, with strong repercussions on investment and employment. To convey this result in a general equilibrium model, I include the mechanism of debt substitution from De Fiore and Uhlig (Reference De Fiore and Uhlig2011, Reference De Fiore and Uhlig2015) in a standard NK model to identify bank shocks.Footnote 4 As in Bassett, et al. (Reference Bassett, Chosak, Driscoll and Zakrajšek2014) and Gambetti and Musso (Reference Gambetti and Musso2017), I find that disruptions in bank credit supply have a strong impact on economic activity and debt markets. The main novelty of my approach is staging the movements in bonds and loans at the core of the business-cycle analysis.
3. Debt arbitrage in a new Keynesian model
The model is populated by three types of agents. Households consume, work and save, firms use capital and labor to produce final goods, and financial intermediaries channel funds from households to the productive sector.Footnote 5
3.1. Households
The model assumes a large number of identical and competitive households. A representative household maximizes its utility function defined as
 \begin{align} E_0\sum _{t=0}^{\infty }\beta ^t \zeta ^C_{t}\left \lbrace \log (C_{t})-\psi _H\frac{H_{t}^{1+\sigma _H}}{1+\sigma _H}\right \rbrace, \end{align}
where
 $C_t$
is the consumption,
 $\zeta ^C_{t}\gt 0$
is a preference shock,
 $\sigma _H\gt 1$
is the inverse Frisch elasticity of labor supply and
 $\psi _H$
is a weighting parameter for labor desutility. Each household is subject to the budget constraint:
 \begin{align} p_t C_t+p_t D_t+q^K_{t}K_{t}\leq{w}_{t}H_{t}+ R_{t} p_{t-1} D_{t-1}+\left ( q^K_{t}(1-\delta ) + p_t r_t^K \right ) K_{t-1}+O_t. \end{align}
Households spend on consumption of the final goods priced at
 $p_t$
and capital
 $K_t$
purchased from capital installers at price
 $q^K_{t}$
. Revenues come from selling labor
 $H_{t}$
at a nominal wage
 ${w}_{t}$
. Real deposits
 $D_{t-1}$
are remunerated at a gross nominal rate
 $R_t$
. Each period, households supply capital
 $K_t$
to entrepreneurs at a competitive rental rate
 $r_t^K$
. Depreciated past-period capital is sold back to capital installers. Variable
 $O_t$
corresponds to transfers from entrepreneurs.
3.2. Firms
Firms produce final goods using capital and labor inputs. I follow Gali (Reference Gali2010) in assuming a three-sector structure for firms. Entrepreneurs produce homogeneous goods transformed by monopolistically competitive retailers into intermediate goods. Final good producers combine intermediate goods to produce homogeneous final goods sold to households in competitive markets.
3.2.1. Entrepreneurs
Entrepreneurs are heterogeneous agents modeled as in De Fiore and Uhlig (Reference De Fiore and Uhlig2011). Each period entrepreneurs have the option to contract with a financial intermediary to fund working capital and produce homogeneous goods sold to intermediate producers. Because there exist different types of financial intermediaries, entrepreneurs can select the form of debt they prefer depending on their characteristics.
Production.—A continuum of risk-neutral entrepreneurs
 $e \in [0,1]$
operate in competitive markets. An entrepreneur
 $e$
produces goods
 $Y^E_{et}$
with capital and labor inputs using the following Cobb–Douglas technology:
 \begin{align} Y^E_{et} = \varepsilon _{et}^{E} A_t K_{et-1}^{\alpha } H_{et}^{1-\alpha }, \end{align}
where
 $K_{et}$
and
 $H_{et}$
denote, respectively, capital and labor inputs used for production. Variable
 $A_{t}$
corresponds to a technology shock and
 $\varepsilon _{et}^E$
is a sequence of independent idiosyncratic shock realizations that make entrepreneurs different ex-post.
Entrepreneurs are subject to a debt constraint. An entrepreneur starts the period
 $t$
with net worth
 $N_{et}$
that corresponds to the sum of past period profits minus dividends transferred to households. Each period entrepreneur
 $e$
rents capital inputs and purchases labor paid at a real wage
 $\tilde{w}_t = w_t / p_t$
using funds
 $X_{et}$
:
 \begin{equation} X_{et} \geq r_t^K K_{et} + \tilde{w}_t H_{et}, \end{equation}
where
 $X_{et}$
is the sum of the entrepreneur’s net worth and external debt
 $\bar{D}_{et}$
:
 \begin{align} X_{et} = N_{et} + \bar{D}_{et}. \end{align}
To obtain external funds
 $\bar{D}_{et}$
from a financial intermediary, an entrepreneur must pledge her net worth according to the leverage constraint:
 \begin{equation} X_{et} = \xi N_{et}, \end{equation}
where
 $\xi$
is a parameter that pins down entrepreneur leverage.Footnote 6 Production
 $Y^E_{et}$
is sold to retailers at a competitive price
 $p^E_{t}$
. The problem of an entrepreneur given available funds
 $X_{et}$
is to choose the combination of capital and labor inputs to maximize her real profits,
 \begin{equation} \left ({p^E_t}/{p_t}\right ) Y^E_{et} - r_t^K K_{et} - \tilde{w}_t H_{et}, \end{equation}
subject to the debt constraint defined in equation (4).
Idiosyncrasy.—Before production takes place, each entrepreneur gets hit by a series of successive idiosyncratic productivity shocks that determine whether she produces or not and her preferred type of financial intermediary.
First, a shock
 $\varepsilon ^{}_{1,et}$
is publicly observed and creates heterogeneity in the productivity of entrepreneurs. This shock realizes together with aggregate shocks and before entrepreneurs contract with financial intermediaries. Second, a shock
 $\varepsilon ^{}_{2,et}$
occurs after financial contracts are set and is observed only by bank-funded entrepreneurs and their banks. This shock creates a rationale for choosing intermediated finance over direct finance.Footnote
7
A third shock
 $\varepsilon ^{}_{3,et}$
is privately observed by entrepreneurs and realizes just before production takes place. This final shock justifies the existence of risky debt contracts between entrepreneurs and financial intermediaries. Both privately observed shocks
 $\varepsilon ^{}_{2,et}$
and
 $\varepsilon ^{}_{3,et}$
can be monitored at a cost by financial intermediaries.
After the first idiosyncratic shock
 $\varepsilon ^{}_{1,et}$
is realized, each entrepreneur decides whether she wants to produce and if so, selects her optimal source of funds. Entrepreneurs have the option to contract with banks to decrease their production risk. To do so, they must pay a share
 $\tau _b$
of their net worth to banks to resolve part of their productivity uncertainty. A bank-funded entrepreneur
 $e$
pays
 $\tau _b N_{et}$
to observe the realization of
 $\varepsilon ^{}_{2,et}$
and to share it with her bank. Before production takes place and based on the realization of
 $\varepsilon ^{}_{2,et}$
, bank-funded entrepreneurs can renegotiate their debt contract. In this case, they recover their pledged net worth and abstain from production. An entrepreneur can also choose to fund from markets, in which case she produces regardless of her productivity.
The Bank Shock.—Throughout this article, idiosyncratic shocks
 $\varepsilon ^{}_{1,et}$
,
 $\varepsilon ^{}_{2,et}$
, and
 $\varepsilon ^{}_{3,et}$
are assumed to be independent and log-normally distributed with unit means and respective variances
 $\sigma _1^{2}$
,
 $\sigma _2^{2}+\nu ^{}_t$
, and
 $\sigma _3^{2}-\nu ^{}_t$
. Here
 $\nu _t$
is a zero-mean shock shifting the relative share of entrepreneurs’ idiosyncratic productivity that the bank can observe. Denoting
 $\sigma ^f_t$
the standard deviation of entrepreneur productivity conditional on its funding decision yields:
 \begin{align} \sigma ^{f}_{t} = \begin{cases} \sqrt{\sigma _2^2 + \sigma _3^2}& \textit{, if bond financing}\\[4pt] \sqrt{\sigma _3^2 - \nu _t}& \textit{, if loan financing.} \end{cases} \end{align}
The bank shock
 $\nu _t$
represents the time-varying ability of banks to screen their borrowers. A high
 $\nu _t$
implies that banks can select efficiently among the pool of borrowers, which reduces banks’ lending risk and improves credit conditions for bank-funded entrepreneurs. Notice here that the bank shock is specified such that it does not modify entrepreneur uncertainty before they contract with a bank or if they fund from markets. In a model without banks,
 $\nu _t$
has no effect.
Funding Decisions.—Following De Fiore and Uhlig (Reference De Fiore and Uhlig2011), it is possible to show the existence of thresholds
 $\bar{\varepsilon }^b$
and
 $\bar{\varepsilon }^c$
in
 $\varepsilon ^{}_{1,et}$
, above which entrepreneurs decide to fund, respectively, from banks or from markets, and a threshold
 $\bar{\varepsilon }^d$
in
 $\varepsilon ^{}_{2,et}$
above which bank-funded entrepreneurs proceed with their bank loan. Accordingly, entrepreneurs split into distinct sets that map the realizations of their idiosyncratic productivity shocks
 $\varepsilon ^{}_{1,et}$
and
 $\varepsilon ^{}_{2,et}$
to their optimal funding decision. Denoting
 $s^a_t$
,
 $s^b_t$
,
 $s^c_t$
, and
 $s^{bp}_t$
, respectively, the shares of entrepreneurs abstaining from production, contracting with banks, proceeding with bonds, and proceeding with bank loans, we have,
 \begin{align} s^a_t = \Phi \left (\bar{\varepsilon }^b(q_t,R_t,\nu _t)\right ),\end{align}
 \begin{align} s^b_t = \Phi \left (\bar{\varepsilon }^c(q_t,R_t,\nu _t)\right ) - \Phi \left (\bar{\varepsilon }^b(q_t,R_t,\nu _t)\right ),\end{align}
 \begin{align} s^c_t = 1 - \Phi \left (\bar{\varepsilon }^c(q_t,R_t,\nu _t)\right ),\end{align}
 \begin{align} s^{bp}_t = \int ^{\bar{\varepsilon }^c(q_t,R_t,\nu _t)}_{\bar{\varepsilon }^b(q_t,R_t,\nu _t)} \int _{\bar{\varepsilon }^d(\varepsilon _1,q_t,R_t,\nu _t)}\Phi \left (d\varepsilon _2\right )\Phi \left (d\varepsilon _1\right ), \end{align}
where
 $q_t$
is the aggregate entrepreneurial markup over input costs and
 $\Phi$
is the cumulative density function of the standard normal. Based on these funding shares, it is possible to compute the aggregate volumes of bonds and loans in the economy.
Debt Aggregation.—Aggregate funds available to entrepreneurs
 $X_t$
are obtained as the sum of bank-funded and market-funded entrepreneurs,Footnote 8
 \begin{equation} X_t=\left [(1-\tau _b)s^{bp}_t+s^c_t\right ]\xi N_t. \end{equation}
Besides, the level of aggregate external debt
 $\bar{D}_t$
corresponds to the volumes of bond
 $B_t$
and loan
 $L_t$
raised by entrepreneurs:
 \begin{equation} \bar{D}_t = B_t + L_t, \end{equation}
with,
 \begin{equation} B_t=\left (\xi -1\right )s^{c}_t N_t, \end{equation}
 \begin{equation} L_t=\left (\xi -1\right )s^{bp}_t \left (1-\tau _b\right )N_t. \end{equation}
and where equilibrium on the debt market implies that
 $\bar{D}_t ={D}_t$
.
3.3. Aggregate constraint and monetary authority
The aggregate resource constraint of the economy writes:
 \begin{equation} Y_t = C_t + I_t + y^M_t, \end{equation}
where
 $y^M_t$
denotes resources consumed in bank-specific information acquisition costs and monitoring costs. A monetary authority sets the nominal interest rate according to a Taylor rule expressed in linearized form:
 \begin{equation} R_t - R =\rho _p \left (R_{t-1} - R\right ) + (1-\rho _p)\left [\alpha _\pi \left ({E}\pi _{t+1} - \pi \right ) + \frac{\alpha _{\Delta Y}}{4}g_{Y,t}\right ] + \frac{1}{400}\epsilon _t^p, \end{equation}
where
 $\epsilon _t^p$
is a monetary policy shock expressed in annual percentage points, and
 $\rho _p$
is a smoothing parameter in the policy rule. Here,
 $R_t-R$
is the deviation of the nominal interest rate,
 $R_t$
, from its steady-state value
 $R$
. Parameters
 $\alpha _\pi$
and
 $\alpha _{\Delta Y}$
are coefficients on the quarterly rate of expected inflation
 ${E}\pi _{t+1} - \pi$
and on output quarterly growth rate
 $g_{Y,t}$
.
3.4. Shock processes
The model includes four different shock processes,
 $A_t, \zeta ^C_t, \zeta ^I_t$
, and
 $\nu _{t}$
. The first three shocks correspond, respectively, to technology, preference, and investment shocks. All shocks follow standard autoregressive processes of degree one. A generic exogenous variable
 $x_t$
writes as
 \begin{align*} log \left(\frac{x_t}{x}\right)=\rho _x log\left (\frac{x_{t-1}}{x}\right ) + \epsilon ^x_t \text{ and } \epsilon ^x_t \sim N\left (0,\sigma _x\right ). \end{align*}
Also, exogenous shifts in monetary policy are captured by innovations
 $\epsilon _t^p$
which are assumed i.i.d and normally distributed. The model is linearized and simulated locally around its steady state.Footnote
9
3.5. Firm funding decisions
Before presenting the model calibration and the dynamic implications of the model, I describe the link between entrepreneurs’ expected productivity and their funding decisions in the static model. The upper panel in figure 2 displays entrepreneurs’ expected profits for the different funding options, conditional on the realizations of the first idiosyncratic shock
 $\varepsilon _1$
. The lower panel shows the density of this shock. The gray, orange, and blue areas correspond, respectively, to
 $s^a_t$
,
 $s^b_t$
, and
 $s^c_t$
, respectively, the shares of entrepreneurs abstaining from production, contracting with banks, and funding from markets, as defined in equation (9) to (11).
Funding decisions.
Note: The first panel corresponds to the expected profits of entrepreneurs depending on their funding choice and conditional on the realization of the first idiosyncratic shock
 $\varepsilon _1$
. The second panel displays the density of this shock.
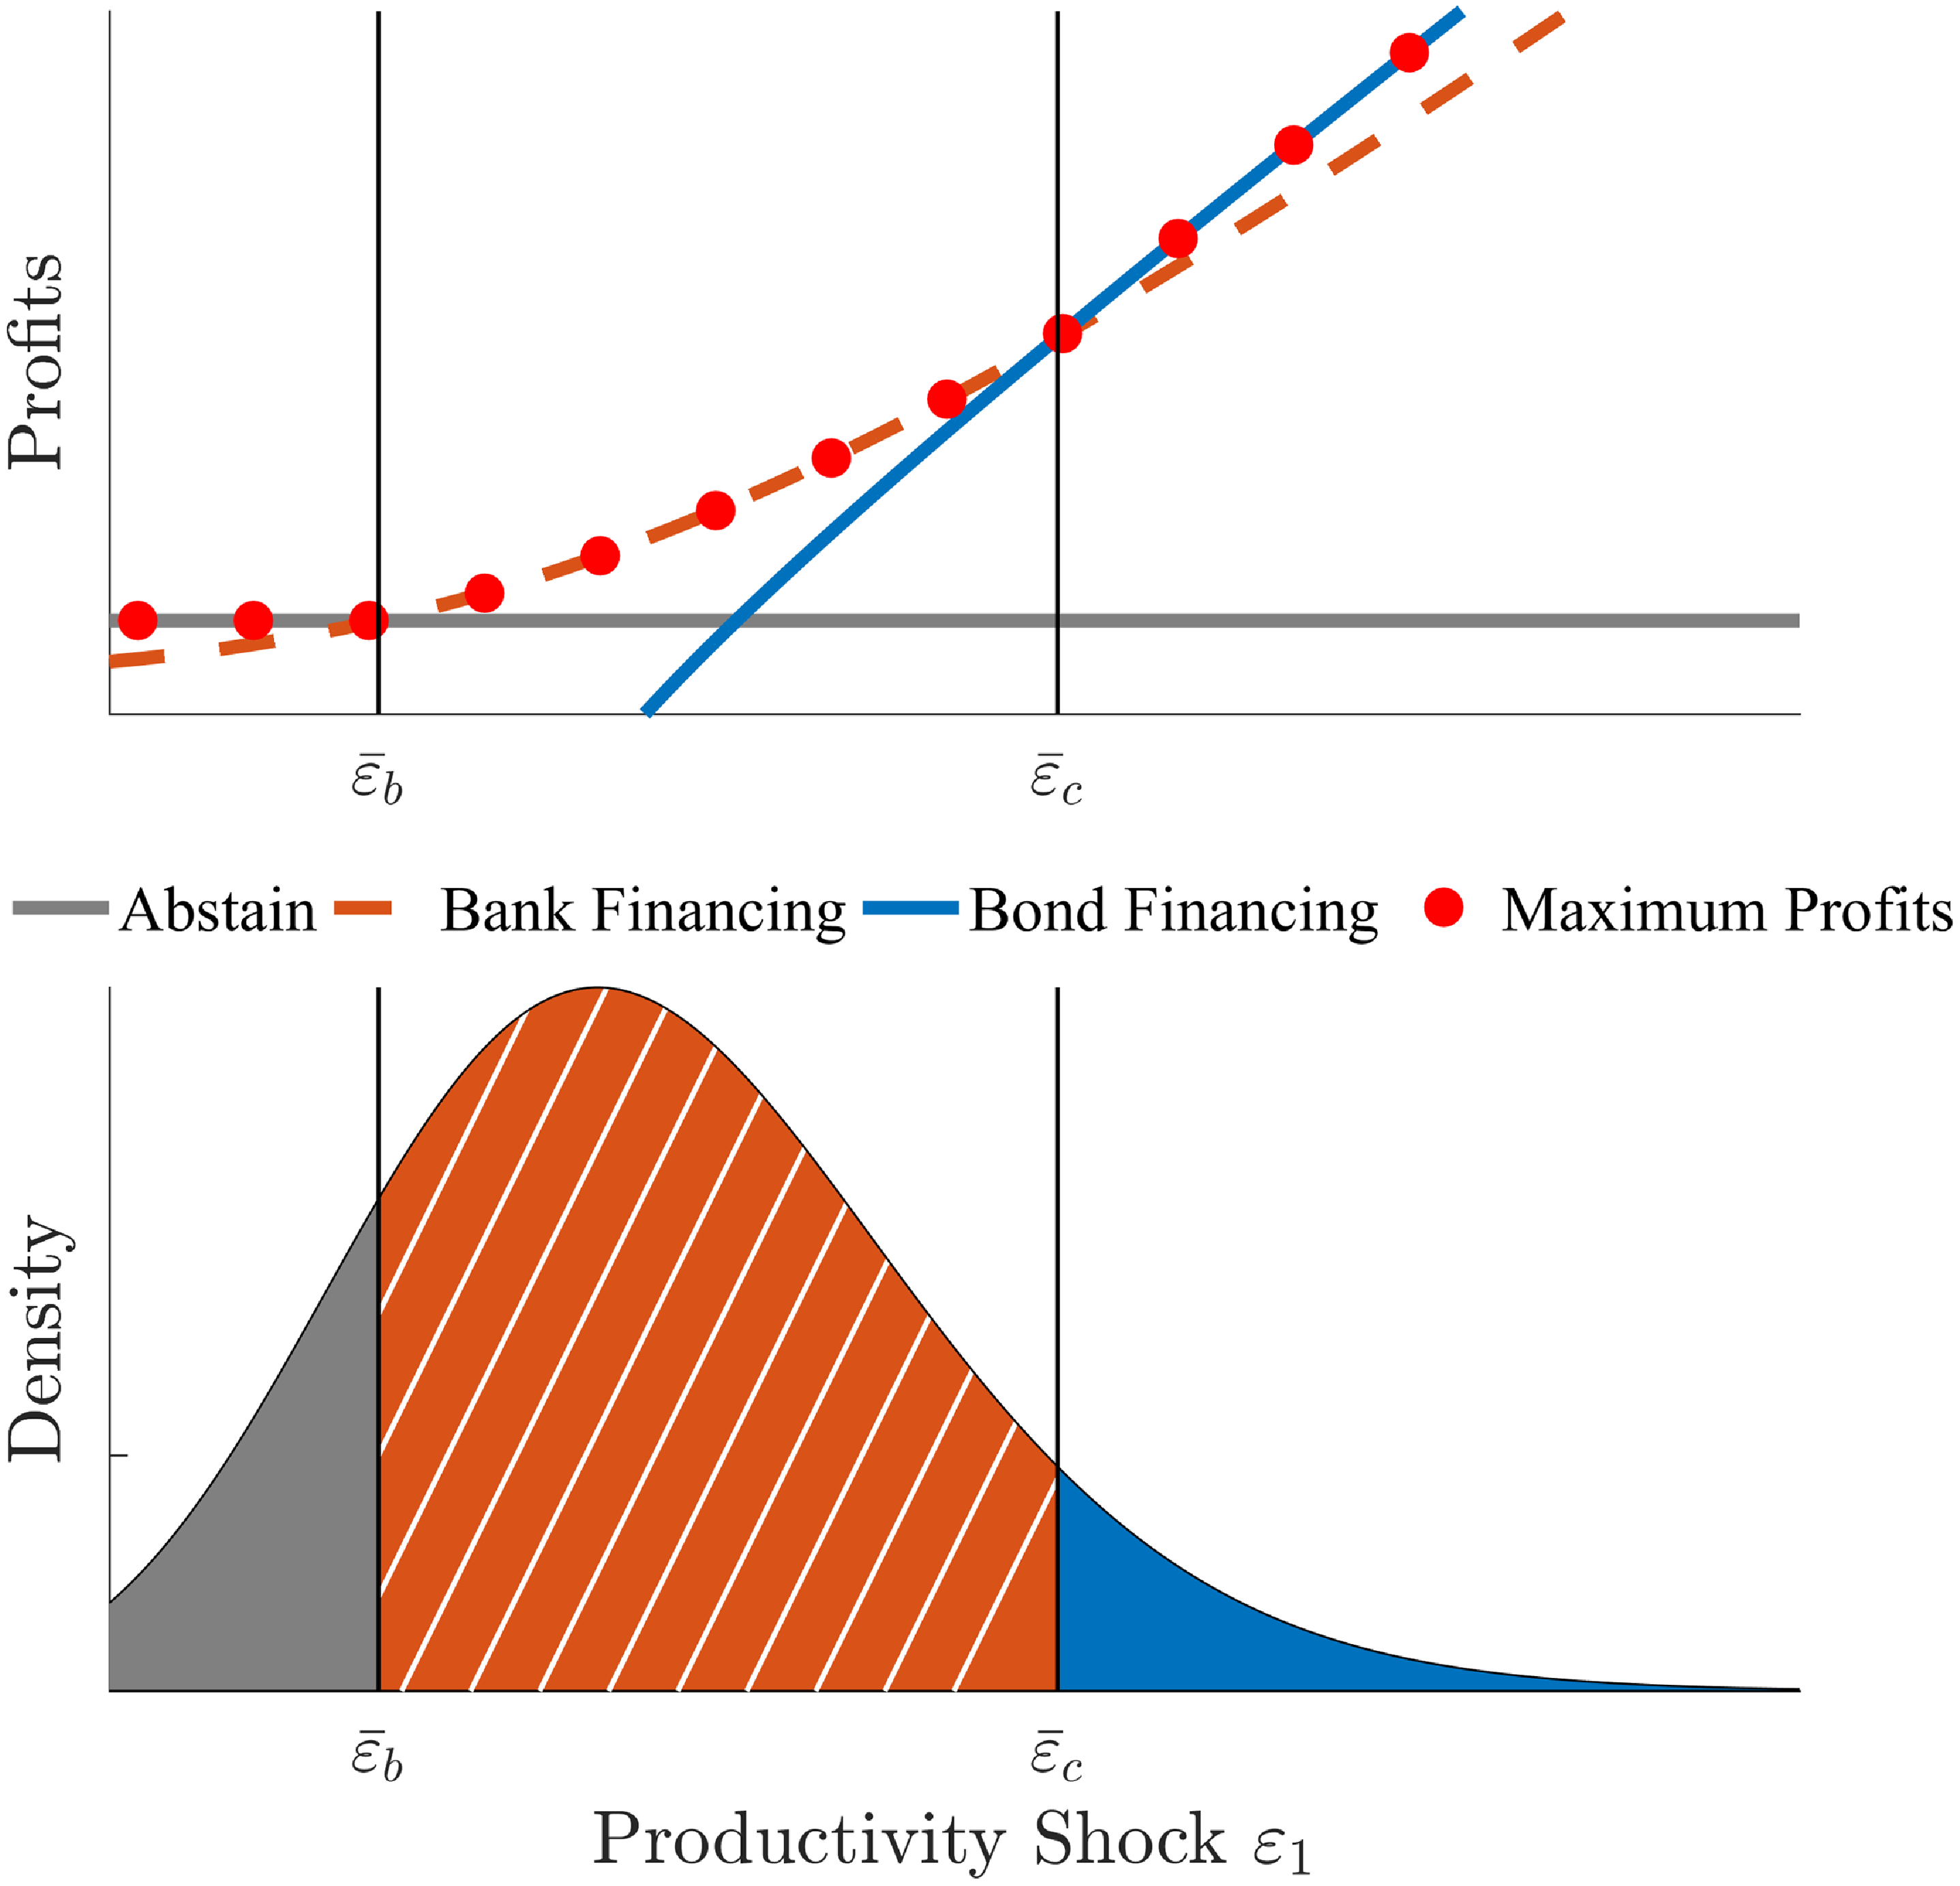
Entrepreneurs with intermediate expected productivity contract with banks while those with high expected productivity prefer to fund from markets. The reason is that entrepreneurs with low expected productivity have a higher default probability and prefer to hedge their net worth against risk by not producing or by entering into renegotiable contracts with banks. On the other hand, entrepreneurs with high productivity and low risk of default are better off funding from markets and avoiding intermediation costs.Footnote 10 Notice also that entrepreneurs’ profits are a monotonic function of their net worth. Hence the model rules out simultaneous funding from markets and banks.Footnote 11
Finally, while the model assumes constant leverage for entrepreneurs, it is important to notice that equity for nonfinancial corporate US firms has been stable compared to their debt composition. Figure A1 in the appendix compares the ratios of assets-to-debt, assets-to-loans, and assets-to-bonds between 1985 and 2018. While the ratio of assets-to-debt stays around its mean, both assets-to-loans and assets-to-bonds appear very volatile, wavering from simple to double over the period considered.
4. Calibration and model properties
4.1. Model calibration
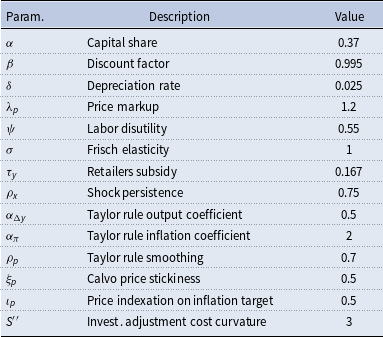
I use a calibrated version of the model to investigate the evolution of firms’ debt structure in response to the different types of aggregate shocks. There are 21 parameters in total.Footnote 12 Most of the parameters are standard in the DSGE literature and calibrated with conservative values.
Parameter
 $\alpha$
is set at 0.37 to target a labor share of 63 percent as observed for US nonfinancial corporate firms in Karabarbounis and Neiman (Reference Karabarbounis and Neiman2014). The depreciation rate
 $\delta$
is
 $0.025$
to obtain an annual rate of capital depreciation of 10 percent. The household discount factor
 $\beta$
at 0.995 implies a policy rate of 2 percent, equal to the average annualized federal funds rate observed between 1985Q1 and 2018Q1. The price markup
 $\lambda _p$
is 1.2 to match the average markup observed in the US between 1980 and 2013 by De Loecker, et al. (Reference De Loecker, Eeckhout and Unger2020). The subsidy rate on intermediate goods
 $\tau _Y$
is set at 0.17 to equate the price of the intermediate goods with the price of the final goods.Footnote 13 I set the inverse Frisch elasticity
 $\sigma _H$
to 1 and the labor disutility parameter
 $\psi _H$
to 0.68 to normalize steady-state hours to unity. Parameters for the Taylor rule, price stickiness, investment cost curvatures and shock autocorrelations
 $\rho _x$
are calibrated to lie within the posterior densities obtained from medium-scale New-Keynesian models estimated for the US on samples covering the past thirty years.Footnote
14
Calibration for these parameters is summarized in table 1. The standard deviations
 $\sigma _x$
are set to generate impulse response functions of similar magnitudes. I estimate those parameters to study the empirical properties of the model in section 6.
Calibrated parameters
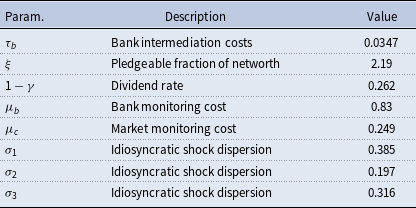
Parameters for the financial sector and the idiosyncratic productivity distributions are less usual and are calibrated to jointly match the characteristics of intermediated and direct debt for US nonfinancial corporate firms over the period 1987Q1 to 2016Q3. Table 2 displays the targeted financial variables and their model counterparts. Calibration for the financial parameters is summarized in table 3. The loan-to-bond and debt-to-equity ratios are computed using data from the Flow of Funds Accounts for nonfinancial US corporate firms. Their average values amount, respectively, to 0.44 and 0.47. The risk premium for loans corresponds to the spread between the interest rate for commercial and industrial loans and the federal funds rate.Footnote 15 I obtain a mean annualized spread of 2 percent. For the bond risk premium, I use Moody’s Aaa corporate bond yield minus the federal funds rate which is equal to 2.97 percent. The corporate rate of default for loans corresponds to the delinquency rate on commercial and industrial loans at 2.86 percent. Finally, the default rate for corporate bonds is inferred from Emery and Cantor (Reference Emery and Cantor2005) who show that the default rate for bonds is 20 percent higher on average than the default rate for loans.Footnote 16
Financial facts - model vs data

Note: Default rates and risk premia are expressed in annualized percentage points.
Calibrated parameters - financial
4.2. Model dynamics and the debt structure
This section presents the dynamic implications of the different aggregate shocks. The key result is that only the responses in loans and bonds allow to qualitatively distinguish a bank shock from other macroeconomic shocks.
4.2.1 The bank shock
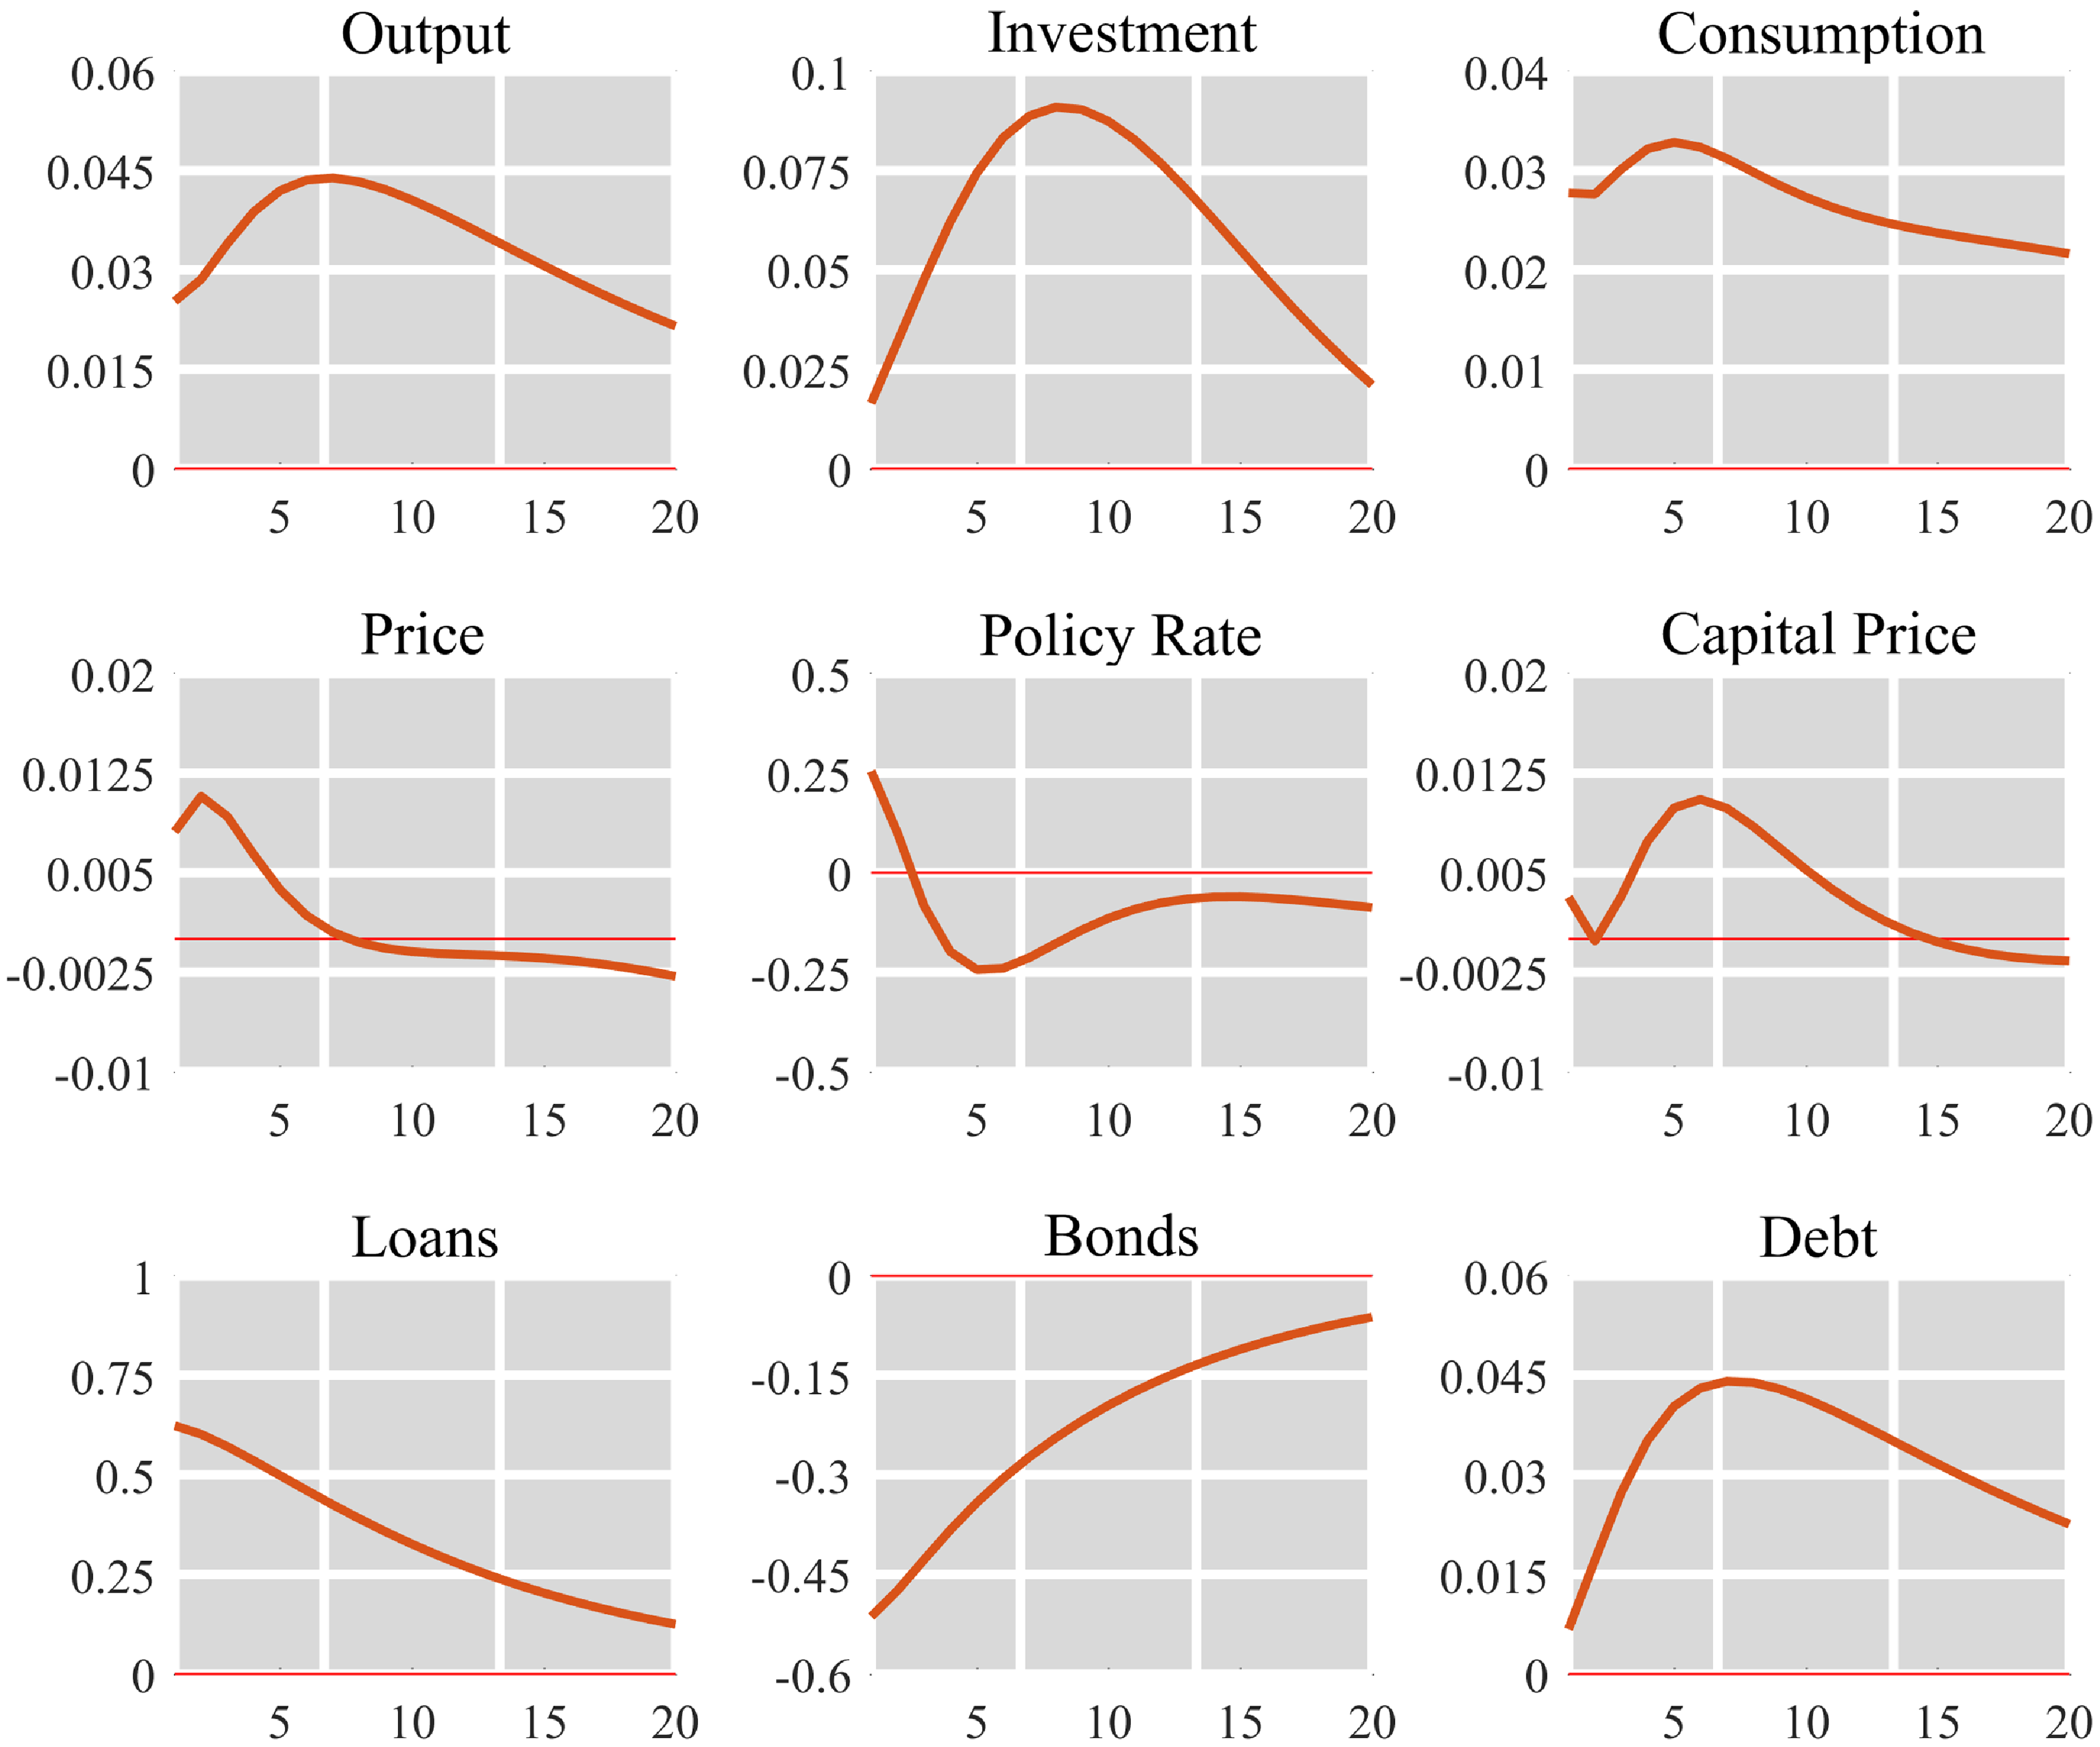
Figure 3 displays impulse responses to a positive bank shock
 $\nu _{t}$
for the main variables of the model. This shock improves banks’ screening capacity by increasing the share of idiosyncratic productivity they can observe among their borrowers. With the share of market-funded entrepreneurs decreasing and the share of bank-funded entrepreneurs rising—the extreme case being if none of the entrepreneurs switching to bank finance decide to proceed with their loan – the bank shock implies opposite movements in the shares of bank and bond-funded entrepreneurs. Overall, the aggregate level of debt increases as the proportion of abstaining entrepreneurs switching to bank finance and proceeding with their loan outweighs the share of entrepreneurs switching from market to bank finance and not proceeding with their loan. As funds available to entrepreneurs move up, the demand for labor and capital increases together with the wage and the capital rental rate. Entrepreneurs’ marginal cost of production goes up. Output, investment, consumption, and hours increase, along with capital price, goods price, and the policy rate. The increase in the policy rate and the marginal cost of production pushes up funding and production costs and dampens the rise in aggregate debt. On the other hand, because entrepreneurs’ aggregate profits react positively to the fall in aggregate uncertainty triggered by the shock, aggregate net worth increases and feeds up next period borrowing through the leverage constraint. Because only the least productive market-funded entrepreneurs switch to bank funding, the risk for bondholders also declines. This leads to a fall in the risk premia for the two types of debt. Overall, the bank shock pushes firms to substitute loans for bonds and triggers positive responses in output, investment, and consumption.
Responses to a bank shock
 $\nu _t$
.
Note: All series are expressed in deviation from the steady state in percentage points. The response in the policy rate is expressed in basis points.
4.2.2 Macroeconomic shocks
Without detailing impulse responses for other shocks, it is important to notice that they transmit differently to entrepreneurs’ funding decisions relative to bank shocks. Figure 4 presents impulse responses following technology, preference, investment, and monetary shocks. First, notice that the introduction of debt arbitrage in the NK framework does not modify the qualitative implications of the model. The signs of the impulse responses for these shocks correspond to those described in Straub and Peersman (Reference Straub and Peersman2006). Importantly, they all generate comovements in output, loans, and bonds. Two effects are at play here. Regardless of the type of shock hitting the economy, entrepreneurs must produce more for output to increase. The shocks do not impact directly credit conditions, instead, they modify aggregate entrepreneurial markup either by decreasing input costs or by increasing firms’ productivity. Following a non-bank shock entrepreneurs’ profitability increases. This pushes up net worth and increases demand for the two types of debt. Loans and bonds increase altogether. On the other hand, the increase in the profitability of entrepreneurs reduces their production risk and modifies their funding decisions. Some entrepreneurs abstaining from production are better off producing after the shock realizes. Accordingly, the shares of entrepreneurs abstaining from production or not proceeding with their bank loan decrease. On the other hand, some entrepreneurs who were contracting with a bank before the shock now prefer to avoid intermediation costs and switch to market finance. Overall, the share of entrepreneurs abstaining from production decreases and both the shares of market-funded entrepreneurs and entrepreneurs proceeding with their bank loans increase. Following non-bank shocks, both bond and loan volumes comove with output.
Responses to macro shocks.
Note: All series are expressed in deviation from the steady state in percentage points. The response in the policy rate is expressed in basis points.

Section 2 in the appendix presents robustness tests for the different impulse responses presented here. It shows that the signs of the responses for output, loans, and bonds to bank and other aggregate shocks are robust to various parameter specifications. Comparing impulse responses for the different types of shock, there exist no robust qualitative differences between demand and bank shocks other than the response of bonds. In the next section, I use the qualitative features of the NK model to inform a sign-restriction VAR and identify bank shocks based on loan and bond dynamics.
5. Empirical analysis
This section presents the results from a sign-restriction VAR model used to identify bank shocks and evaluate their business cycle implications.
5.1. The sign-restriction VAR
I use the qualitative predictions of the modified NK model to inform a sign-restriction Bayesian VAR. The model is estimated with US quarterly data for the period 1985Q1 to 2018Q1. The data set includes the gross domestic product (GDP), the GDP implicit price deflator, the ratio of investment over GDP, and the annualized effective federal funds rate. I take outstanding loan and bond volumes for corporate nonfinancial firms to track the evolution of aggregate debt composition. The loan series includes loans from depository institutions, mortgage loans, and other loans and advances. The bond series includes both bonds and commercial papers. Bond and loan series are obtained from the Federal Reserve System Board of Governors. All series are seasonally adjusted and expressed in log levels except for the federal funds rate which is in levels.Footnote 17 Section 3 of the appendix contains a complete description of the data set and the econometric methods used to estimate the model.
The model is estimated using Jeffrey’s prior with a lag order of two which minimizes the Bayesian information criterion and the Hannan-Quinn information criterion.Footnote 18 The estimation of the model involves two separate steps. First, I estimate a reduced form Bayesian VAR model. Second, I use the algorithm presented in Arias, et al. (Reference Arias, Rubio-Ramirez and Waggoner2018) to generate candidate impulse responses and retain models satisfying the imposed sign restrictions until a sufficient number of draws are obtained.Footnote 19 I consider five types of structural shocks identified based on the signs of the impulse responses on impact for the different variables. A sixth shock is left unrestricted to add a degree of freedom to the estimation and match the number of series used. The restrictions imposed and the series used are chosen to classify shocks into five broad categories - supply, demand, investment, monetary, and bank shocks. These capture most types of shocks found in the business cycle literature as well as the shocks present in the modified NK model.Footnote 20 The sign-restrictions imposed are summarized in table 4. Supply shocks are identified as implying opposite movements in output and prices. Demand and investment shocks generate comovements in output and prices and have, respectively, negative and positive impacts on the investment-to-output ratio. Monetary shocks generate opposite responses in the policy rate, output, and prices. Finally, all these shocks generate comovements in output, loans, and bonds.
Sign restrictions

Note: Sign restrictions imposed. The restrictions are imposed on impact only. The presence of a question mark indicates the absence of restriction.
Bank shocks are identified as the only type of shock that can simultaneously generate comovements in output and loans and opposite movements in output and bonds. Importantly, bank shocks need not to be identified as demand shocks. This restriction is commonly imposed to identify financial shocks in sign-restriction VAR but is at odds with recent evidence.Footnote 21 As I do not impose restrictions on the responses of prices, interest rate, and the investment-to-output ratio conditional to a bank shock, these can be used as a simple test for the overidentifying predictions of the VAR model.
5.2. Empirical results
This section presents the results from the structural VAR model, I focus on the characteristics of bank shocks and how they relate to financial shocks identified with different econometric methods.
5.2.1. What bank shocks do
Figure 5 displays the median impulse responses following a one standard deviation bank shock. The response of output is short-lived with a duration close to 10 quarters before returning to zero. While left unrestricted, the impact on the investment-to-output ratio is positive and twice as strong as for output with a similarly short duration. In comparison, the impact on loans takes more than 15 quarters to fade out and is nearly five times stronger than for output. ts maximum impact is reached after 10 quarters with a value close to 2 percent. The fall in bonds is twice weaker than the increase in loans and peaks more rapidly after only 5 quarters. The federal funds rate exhibits a large positive hump-shaped response dying out after 10 quarters. I find the response of prices to be weak and positive. The responses of the policy rate and prices are consistent with a large body of empirical and theoretical evidence.Footnote 22
While bank shocks are identified restricting only the responses of output, loans, and bonds, the responses obtained for the investment-to-output ratio, the policy rate, and the price level also match dynamics implied by financial shocks from various DSGE models.Footnote 23 Impulse responses for the other shocks are displayed in section 6 of the appendix.
5.2.2. Bank shocks and the business cycle
Table 5 shows the contributions of the different shocks to the variance of model observables at business-cycle frequency. Bank shocks are the main driver of the business cycle. They account for nearly 40 percent of fluctuations in output, and, respectively, 43 and 62 percent of loan and bond fluctuations but bear little implication for prices. Both supply and demand shocks have a sizable role in output and price level fluctuations. Interestingly, although other recessions show different drivers, the model attributes a very early role to bank shocks in the Great Recession. The initial fall in output is explained mainly by supply-side disturbances and the vanishing of positive bank shocks. The core of the recession is also associated with demand and monetary factors.Footnote 24
Variance contributions
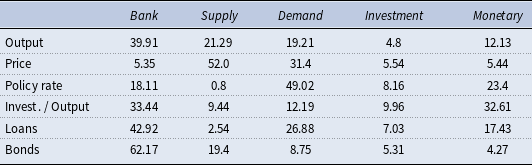
Note: Contributions of the structural shocks to the business-cycle volatility of the model observables. The table does not display the residual shock to save space. Business cycle frequency includes cycles between 6 and 32 quarters obtained using the model spectrum.
Responses to a bank shock.
Note: Median impulse responses to a one standard deviation bank shock. The gray lines correspond to the 16th and 84th quantiles. All series are expressed in percentage points. The policy rate is annualized.

To verify that the characteristics of the estimated bank shocks are robust to changes in the sign-restrictions imposed for the responses of price, interest rate, and investment, I re-estimate the VAR model restricting only the responses of output, loans, and bonds. I also add a measure of credit spread to alleviate risks of noninvertibility and verify the implications of bank shocks for credit costs.Footnote 25 Section 5 of the appendix presents the results for this alternative specification. The characteristics of the bank shocks are identical to those obtained in the fully specified model.
6. Putting the model to the test
In this final section, I use an estimated version of the modified NK model to investigate how bank shocks identified using aggregate debt composition relate to measures of financial stress such as the corporate bond spread.
6.1. Impulse response matching
The estimation procedure consists in minimizing the distance between the median impulse responses implied by the structural VAR and by the modified NK model.Footnote
26
I estimate a total of 22 parameters which are listed in table A2 of the appendix. Writing
 $\theta ^{}$
the vector that contains the estimated parameters, its estimator
 $\theta ^*$
is obtained as the solution of:
 \begin{align}{\theta ^*} = \underset{\theta }{argmin}\left [\hat{\Psi }-\bar{\Psi }(\theta ^{})\right ]'V^{-1}\left [\hat{\Psi }-\bar{\Psi }(\theta ^{})\right ]. \end{align}
Here,
 $\hat{\Psi }$
is a vector that contains the median impulse responses obtained from the VAR model,
 $\bar{\Psi }(\theta ^{})$
contains the impulse responses from the NK model and
 $V$
is a diagonal matrix with the variances of the empirical impulse responses stacked along its main diagonal. I consider a horizon of 25 periods for the five different structural shocks and the six different variables. This implies that
 $\bar{\Psi }(\theta ^{})$
is a 750 column vector. Figure 6 displays impulse responses to a bank shock for the estimated NK model and the VAR model. The modified NK model can reproduce both qualitative and quantitative features of the VAR model for all types of shock with parameter values in line with those obtained from medium-scale DSGE models estimated with US data.Footnote
27
Impulse responses for the other shocks are provided in section 6 of the appendix.
6.2. Bank shocks and the bond spread
Going back to the question of whether corporate aggregate debt composition can help to identify bank shocks, I investigate the relevance of the identification strategy based on two criteria. First, does the identification method yield a bond spread that resembles measures of financial stress as experienced by nonfinancial firms? Second, do firm funding decisions help to predict disruptions in the financial system? To address these questions, I proceed as follows. I assume that the estimated NK model is the true data generating process and use it to recover the structural shocks implied by the data set.Footnote 28 Figure 7 plots the model bond spread and Moody’s seasoned Aaa corporate bond yield minus the federal funds rate.Footnote 29 The model spread closely tracks its data counterpart although no data on price is used for the estimation. The two series correlate at 0.65 over the whole sample. The proximity between the two series shows that the NK model modified to incorporate bonds and loans can capture fluctuations in financial stress based on aggregate firms’ funding choices.Footnote 30
Granger Causality test

Note: Granger causality is inferred based on likelihood ratio test. The bank shocks correspond to shocks
 $\epsilon ^{\nu }_{t}$
obtained using a Kalman filter.
Impacts of a bank shock in the VAR and NK models.
Note: Median impulse responses to a one standard deviation bank shock. The gray lines correspond to the 16th and 84th quantiles for the VAR model. All series are expressed in percentage points. The policy rate is annualized.

Bond spread.
Note: The continuous blue line corresponds to Moody’s seasoned Aaa corporate bond minus the federal funds rate. The dashed blue line corresponds to the bond spread from the model. Gray areas correspond to NBER recession dates.

A follow-up question is whether financial shocks as identified with the NK model can help predict development in the bond markets. To answer this question, I investigate whether the bank shocks
 $\epsilon ^\nu _t$
can help to predict changes in the bond spread. Table 6 displays the result from several Granger-causality tests. The tests are performed using a multivariate VAR model with different lag orders. The data I use for the tests correspond to the series used in section 6.2. The hypothesis that bank shocks do not Granger cause the bond spread is rejected by the different specifications. This exercise highlights the importance of firm funding decisions to understand the evolution of borrowing costs. This also echoes the finding of Adrian, et al. (Reference Adrian, Colla and Shin2013) that the rise observed in the bond spread during the Great Recession was mostly the result of firms substituting bonds for loans.
7. Conclusion
I include a mechanism of debt arbitrage into a NK model to investigate the evolution of firms’ debt structure in response to various macroeconomic shocks. The model implies that only bank shocks produce opposite movements in bonds and loans. In contrast, other macroeconomic shocks generate comovements in the two types of debt. I use these results to inform a sign-restrictions VAR estimated with US data. Bank shocks account for a large share of the business cycle. I estimate the modified NK model using impulse response matching methods. The NK model can replicate the quantitative implications of the structural VAR for all types of shock. Finally, I use the estimated model to construct a measure of financial stress for the US and test the identification strategy.
Supplementary material
To view supplementary material for this article, please visit https://doi.org/10.1017/S136510052400049X



