





1. Introduction
Aggregation via collisions of tiny particles sedimenting in a shear flow influences the dynamics of many scenarios involving gas–solid and gas–liquid suspensions. Sampling aerosols and conveying them to instruments for analysis or separation, pneumatic conveyance, and the transport of catalytic particulate matter in riser reactors are a few examples of flows of suspensions through vertical pipes or channels (Jackson Reference Jackson2000). In sampling scenarios, a concern could be how much coalescence occurs before the size distribution analysis. It would be desirable to have a laminar flow with low shear rates to minimize coalescence. Suppose that the mean shear in turbulent vertical two-phase flows is large enough. In that case, the mean shear will predominantly drive the collisions, and one could consider the background flow to be laminar while studying coalescence. The coupled effects of gravity and the imposed shear flow would dictate the collision dynamics in all these situations.
Collision rates between pairs of particles depend on the detailed interparticle interactions, especially hydrodynamic interactions. Unlike the collision of the dispersed particles in a liquid medium, the near-field hydrodynamic interaction between a pair of particles is severely influenced by non-continuum physics when the surrounding fluid medium is gaseous. Continuum hydrodynamic interactions would not allow collisions between rigid surfaces in finite time unless attractive interparticle forces (such as the van der Waals force) act between the particles. The attractive van der Waals force overcomes the continuum lubrication forces at close separations and enables particles to make contact in finite time (see Russel, Saville & Schowalter Reference Russel, Saville and Schowalter1991). One needs to consider the combined effects of shear, gravity and the van der Waals force in systems designed to remove particles, such as porous aerosol filters (see Jaworek et al. Reference Jaworek, Sobczyk, Krupa, Marchewicz, Czech and Śliwiński2019) and impactors (see Malá et al. Reference Malá, Rulík, Bečková, Mihalík and Slezáková2013). In media with a large mean free path ( $\lambda _0$), such as air, the continuum approximation of hydrodynamic interactions is no longer valid near contact. Therefore, one must consider non-continuum lubrication interactions (see Sundararajakumar & Koch Reference Sundararajakumar and Koch1996; Chun & Koch Reference Chun and Koch2005). Previous studies have obtained particle collisions due to the inclusion of interparticle forces (see Zeichner & Schowalter Reference Zeichner and Schowalter1977), interfacial mobility (see Wang, Zinchenko & Davis Reference Wang, Zinchenko and Davis1994), deformation (see Rother & Davis Reference Rother and Davis2001) and compressibility (see Gopinath, Chen & Koch Reference Gopinath, Chen and Koch1997).
Recently, Dhanasekaran, Roy & Koch (Reference Dhanasekaran, Roy and Koch2021a,Reference Dhanasekaran, Roy and Kochb) have studied collisions in a dilute polydisperse suspension of sedimenting spheres interacting through non-continuum hydrodynamics in a background deterministic compressional flow and a turbulent flow. When the non-dimensional separation  $\xi$ between two particles becomes asymptotically small (i.e.
 $\xi \ll 1$), lubrication effects become important. Here,
 $\xi =r-2$, where
 $r$ is the dimensionless (non-dimensionalized by the average radius of the two spherical particles) centre-to-centre distance between the spheres. Continuum lubrication asymptotics predicts that the resistive force due to the normal motion of two surfaces is
 $O(\xi ^{-1})$, indicating that
 $\xi \rightarrow 0$ only when
 $t\rightarrow \infty$, meaning that particles will not come into contact in finite time (see Wang et al. Reference Wang, Zinchenko and Davis1994; Dhanasekaran et al. Reference Dhanasekaran, Roy and Koch2021a). When
 $\xi \sim \lambda _0$, the continuum approximation breaks down. The Knudsen number
 $Kn=\lambda _0/a^*$, where
 $a^* = (a_1+a_2)/2$ is the mean of the sphere radii
 $a_1$ and
 $a_2$, quantifies how dominant the non-continuum effects are. Sundararajakumar & Koch (Reference Sundararajakumar and Koch1996) derived the lubrication force when the gap width is smaller than
 $\lambda _0$ from the Poiseuille flow solution of the linearized Boltzmann equation (see Cercignani & Daneri Reference Cercignani and Daneri1963). They found that the lubrication resistivity is
 $O(Kn^{-1}\ln (\ln (Kn\,\xi ^{-1})))$, a weaker divergence compared to
 $O(\xi ^{-1})$, thus allowing for the possibility of a finite time contact under the action of a constant force (see figure 1 for the variation of
 $\varLambda$, a quantity proportional to the lubrication force). For collisions in gas, it is possible to show that the non-continuum effect is comparable to the van der Waals force and dominates other factors such as deformability, interfacial mobility and compressibility in facilitating particle collision (see the detailed discussion in § 2 of Dhanasekaran et al. Reference Dhanasekaran, Roy and Koch2021a).
Near-field variation of the resistance function  $\varLambda = 1/(1-A)$ for two equal-sized particles when
 $Kn = 10^{-1}$. Here,
 $A$ is the axisymmetric mobility for a pair of spheres in a linear flow. The weaker divergence of the non-continuum lubrication resistance leads to collisions in finite time.

We analyse the collision rate of non-Brownian spheres settling in a simple shear flow while interacting through non-continuum hydrodynamics and van der Waals forces. We assume that fluid inertia is negligible and thus use the Stokes equations to describe the flow fields. Particle inertia for spheres with larger radii may significantly influence the collision dynamics, but we can safely neglect it for relatively small particles. This study will focus primarily on pair trajectories and collision rate calculations without particle inertia. However, we will explore the perturbative effects of small particle inertia on pair trajectories and collision rates towards the end of the paper. To justify the assumptions of negligible fluid and particle inertia, and negligible Brownian diffusion, let us calculate the relevant parameters for a water droplet of radius  $a_1=10\,\mathrm {\mu }{\rm m}$ in air (dynamic viscosity
 $\mu _f \approx 10^{-5}\,{\rm Pa}\,{\rm s}$ and density
 $\rho _f \approx 1\,{\rm kg}\,{\rm m}^{-3}$). In this case, droplets will behave like rigid spheres because of their small sizes and the high drop-to-medium viscosity ratio (
 $\hat {\mu } \approx 10^2$). The density ratio
 $\rho _p/\rho _f \approx 10^3$, where
 $\rho _p$ is the density of water droplets. Small drops may often have surfactants on their surfaces. Since the mobility of the interface is small due to the high viscosity ratio, the motion of the drops would not drive a significant change in surfactant concentration, eliminating the Marangoni effects. We assume that drop surfaces remain spherical because of high interfacial tension. For a typical shear rate
 $\dot {\gamma }=10\,{\rm s}^{-1}$, the Reynolds number based on particle radius is
 $Re_p=\rho _f\dot {\gamma } a_1^2/\mu _f =10^{-5}$, and the Stokes number (based on the shearing time scale) is
 $St=2 a_1^2\rho _p\dot {\gamma }/9\mu _f \approx 2 \times 10^{-2}$. The Péclet number
 $Pe$ measures the relative importance of flow-induced motion and Brownian diffusion. At room temperature (
 $T=300$ K),
 $Pe=3{\rm \pi} \mu _f \dot {\gamma }a_1^3/k_BT \approx 227$ (large enough for neglecting Brownian diffusion in the system under consideration), where
 $k_B$ is the Boltzmann constant. Therefore, the above representative numbers justify our assumptions. The particle velocity due to imposed shear scales as
 $\dot {\gamma }a_1$, which is equal to
 $10^{-4}\,{\rm m}\,{\rm s}^{-1}$ and
 $10^{-2}\,{\rm m}\,{\rm s}^{-1}$ for
 $\dot {\gamma }=10\,{\rm s}^{-1}$ and
 $\dot {\gamma }=10^3\,{\rm s}^{-1}$, respectively. On the other hand, the gravitational settling speed scales as
 $2\rho _pa_1^2g/9\mu _f\approx 2\times 10^{-2}\,{\rm m}\,{\rm s}^{-1}$, where
 $g$ is the acceleration due to gravity. So the effects due to sedimentation and shear can compete with each other for larger shear rates.
Particle volume fractions in many natural systems, such as clouds (see Grabowski & Wang Reference Grabowski and Wang2013), aerosol reactors (see Balthasar et al. Reference Balthasar, Mauss, Knobel and Kraft2002) and separators, are very low (typically  $O(10^{-6}\unicode{x2013}10^{-4})$), which allows us to analyse the problem in the dilute limit. Therefore, we assume only pairwise interactions between particles of radii
 $a_1$ and
 $a_2$ (see figure 2). For a non-interacting inertialess system, the particle paths coincide with the fluid streamlines; hence the relative velocity of a particle pair is divergence-free. Therefore, the ideal collision rate calculation with no interactions is a trivial one. Explicit analytical expressions for ideal collision rates for uncoupled systems (i.e. simple shear flow alone or pure differential sedimentation) are available in the literature (see Smoluchowski Reference Smoluchowski1917). To the best of our knowledge, no result exists in the literature for the ideal collision rate for a pair of droplets settling in a simple shear flow. In § 3, we provide an analytical expression for the ideal collision rate for a pair of droplets settling along the flow axis of a simple shear flow.
Schematic of the coordinate system used in the analysis. The sphere of radius  $a_1$ will be referred to as sphere 1, and that of radius
 $a_2$ as sphere 2. Sphere 3 is the collision sphere of radius
 $a_1+a_2$. Here,
 $x_1$,
 $x_2$ and
 $x_3$ are flow, gradient and vorticity directions, respectively. The simple shear field is given by
 ${\boldsymbol {U}}^\infty (\boldsymbol {x}) = (\dot {\gamma }x_2,0,0)$, where
 $\dot {\gamma }$ is the rate of shear. In § 2, we will use
 $\hat {e}_r$,
 $\hat {e}_{\theta }$ and
 $\hat {e}_{\phi }$ as the unit vectors in the
 $r$,
 $\theta$ and
 $\phi$ directions, respectively.

To determine the collision rate for the interacting case, we need to calculate the flux per unit volume of two spheres coming into contact with each other. This flux depends on the pair distribution function ( $P$), the relative velocity between the pair, and their respective number densities. In the inertialess limit, the pair distribution function is the probability density of two particle centres being separated by
 ${\boldsymbol {r}}$. We scale the probability density by
 $n_1n_2$ so that
 $P\in [0,1]$, where
 $n_1$ and
 $n_2$ are the number densities of spheres with size categories characterized by radii
 $a_1$ and
 $a_2$, respectively. Two-body interactions dominate the dynamics of dilute dispersions of micron-size particles. For pairwise interactions of non-Brownian particles, the pair probability thus evolves purely due to the relative velocity between the particles (see Batchelor & Green Reference Batchelor and Green1972a). The pair trajectories in uniaxial extensional/compressional flow and differential sedimentation are open, thus one obtains an analytical expression for
 $P$ in terms of the scalar mobility functions. Both open and closed trajectories exist for a simple shear flow, and the pair probability is indeterminate for the closed trajectories (see Batchelor & Green Reference Batchelor and Green1972b).
One of the earliest studies on particles colliding in a viscous fluid was carried out by Smoluchowski (Reference Smoluchowski1917) who found the collision rate of non-interacting spheres in a simple shear flow to be  $(4/3)n_1 n_2 \dot {\gamma }(a_1 + a_2 )^3$. He found the collision rate for two non-interacting spheres settling in quiescent fluid with a relative velocity
 $V_{rel}$ to be
 $n_1 n_2 {\rm \pi}(a_1 + a_2)^2 V_{rel}$. Here, the relative velocity due to differential sedimentation is given by
 $V_{rel} = 2\rho _pg( a_1^2-a_2^2)/(9\mu _f)$. Arp & Mason (Reference Arp and Mason1976) were among the first to calculate the modification to Smoluchowski's result for the collision rate due to hydrodynamic interactions. Since continuum theory for rigid spheres does not allow for colliding trajectories, they calculated the collision efficiency assuming different sizes of collision spheres with radii larger than
 $a_1+a_2$. As expected, they found that the collision efficiency for continuum interactions vanishes in the limit of the radius approaching
 $a_1+a_2$. Davis (Reference Davis1984) calculated the collision efficiency of a dilute polydisperse system of sedimenting spheres with hydrodynamic and interparticle interactions (attractive van der Waals forces) using trajectory analysis. Zinchenko & Davis (Reference Zinchenko and Davis1995) predicted the collision rate for two interacting spherical drops in a simple shear flow at arbitrary
 $Pe$ by solving the quasi-steady Fokker–Planck equation for the pair probability conservation. Most previous studies restrict their analysis to continuum hydrodynamic interactions with van der Waals forces (see Davis Reference Davis1984; Zhang & Davis Reference Zhang and Davis1991; Wang et al. Reference Wang, Zinchenko and Davis1994), suitable for colloidal particles in aqueous suspensions where van der Waals force acts as the predominant mechanism to overcome the continuum lubrication forces and bring particles into surface-to-surface contact. On the other hand, for gas–particle suspensions, the non-continuum lubrication force at close separations results in a finite collision rate (see Dhanasekaran et al. Reference Dhanasekaran, Roy and Koch2021a,Reference Dhanasekaran, Roy and Kochb; Patra & Roy Reference Patra and Roy2022). Here, we study the collision rate of bidisperse spheres settling in simple shear flows with non-continuum hydrodynamic interactions. Our study reveals several interesting collision dynamics for particles colliding in a simple shear flow due to non-continuum hydrodynamics. We report the collision rate results for the coupled problem as a function of the strength of gravity relative to the simple shear flow when the angle between the flow axis and gravity is zero (see figure 2).
When the motion of the particles needs to be determined in response to prescribed forces and torques acting on the particles in a known background flow, that is called a mobility problem in microhydrodynamics. For negligible fluid and particle inertia, the mobility formulation is applicable to our problem because we consider torque-free particles with specified gravitational and van der Waals forces. We express the relative velocity between the pairs in terms of hydrodynamic mobility functions. These mobility functions depend on size ratio and radial separation between the particle pairs. There are different methods for calculating these mobility functions, such as the twin-multipole expansions (see Jeffrey & Onishi Reference Jeffrey and Onishi1984; Jeffrey Reference Jeffrey1992; Townsend Reference Townsend2018), the boundary-multipole collocation method (see Kim & Karrila Reference Kim and Karrila2013), and solution of the Stokes equations in bispherical coordinates (see Lin, Lee & Sather Reference Lin, Lee and Sather1970; Wang et al. Reference Wang, Zinchenko and Davis1994). In this paper, for continuum hydrodynamic interactions, axisymmetric mobility functions are obtained using bispherical coordinates, and asymmetric mobility functions are obtained using twin-multipole expansions. We will use uniformly valid solutions for axisymmetric mobilities, where the continuum lubrication resistance matches asymptotically with the non-continuum result of Sundararajakumar & Koch (Reference Sundararajakumar and Koch1996) (see figure 1). We expect that continuum breakdown will not strongly influence asymmetric mobilities because these mobilities remain finite at contact. Thus we will consider continuum hydrodynamics for asymmetric motion at all separations. Far-field and near-field analytical forms of these mobility functions for continuum hydrodynamic interactions are available in the previous literature (see Batchelor & Green Reference Batchelor and Green1972a; Batchelor Reference Batchelor1976; Kim & Karrila Reference Kim and Karrila2013).
In the current study, we will calculate collision efficiencies with non-continuum lubrication interactions under the action of various driving forces – a background simple shear flow, van der Waals forces, gravity and particle inertia. In § 2, we will formulate the problem for a zero inertia system when gravity, background shear and van der Waals forces are present. The collision rate without interparticle interactions will be presented in § 3. In § 4.1, we will calculate the collision efficiency due to non-continuum hydrodynamic interactions between a pair of spheres subject to a simple shear flow. Then in § 4.2, we will quantify the effects of attractive van der Waals force on the collision efficiency between the particles while background shear and non-continuum lubrication interactions are present. We will calculate the collision rate and efficiency due to the combined effects of simple shearing flow, gravity, non-continuum hydrodynamics and van der Waals forces in § 4.3. Ignoring the effects of van der Waals forces and gravitational sedimentation, in § 5, we will study the effect of small particle inertia ( $St \ll 1$) on the collision dynamics of two equal-sized spheres interacting through non-continuum hydrodynamics in a simple flow. Finally, in § 6, we will summarize our results and discuss their implications.
2. Formulation
2.1. Trajectory equations for zero particle inertia ( $St=0$)

We consider a dilute suspension of non-Brownian spherical particles in a non-continuum gas subject to a simple shear flow, sedimenting along the flow axis. For dilute suspensions, the probability of a third particle influencing the relative motion of two interacting particles is negligible, so we restrict our analysis to binary interactions of particles with radii  $a_1$ and
 $a_2$, as shown in figure 2. The particles are sufficiently small to neglect the role of fluid inertia; thus we assume that the Stokes equations govern this creeping flow. Though we focus on a simple shear flow in the present study, the following formulation will apply to any arbitrary linear flow. A linear flow field
 ${\boldsymbol {U}}^\infty (\boldsymbol {x})$ can be characterized by a spatially constant strain rate tensor
 \begin{equation} {\boldsymbol{E}}^{\infty} = \tfrac{1}{2} \left[(\boldsymbol{\nabla} {\boldsymbol{U}}^{\infty}) + (\boldsymbol{\nabla} {\boldsymbol{U}}^{\infty})^{\rm T} \right], \end{equation}
and a rigid body rotation with angular velocity,
 \begin{equation} \boldsymbol{\varOmega}^{\infty} = \tfrac{1}{2}{\boldsymbol{\nabla}} \times {\boldsymbol{U}}^{\infty}. \end{equation}
The linearity of the Stokes equations enables us to write the resultant relative velocity between two particles by vector summing the relative velocities caused by the motion of force-free and torque-free particles in the background flow, attractive van der Waals force, and gravity. Moreover, because of the axisymmetric geometry of the problem, we can resolve the relative velocity along and normal to the line joining the centres of the two spheres (see Batchelor & Green Reference Batchelor and Green1972a; Batchelor Reference Batchelor1976, Reference Batchelor1982; Wang et al. Reference Wang, Zinchenko and Davis1994; Batchelor & Wen Reference Batchelor and Wen1982):
 \begin{align} \hat{\boldsymbol{v}}_{12}(\hat{\boldsymbol{r}}) &= \boldsymbol{\varOmega}^{\infty}\times \hat{\boldsymbol{r}} + {\boldsymbol{E}}^{\infty}\boldsymbol{\cdot}\hat{\boldsymbol{r}}-\left[A\, \frac{\hat{\boldsymbol{r}}\hat{\boldsymbol{r}}}{\hat{r}^2}+B\left({\boldsymbol{I}}-\frac{\hat{\boldsymbol{r}}\hat{\boldsymbol{r}}}{\hat{r}^2}\right)\right]\boldsymbol{\cdot} \left({\boldsymbol{E}}^{\infty}\boldsymbol{\cdot}\hat{\boldsymbol{r}}\right) \nonumber\\ &\quad -\frac{1}{6{\rm \pi} \mu_f }\left(\frac{1}{a_1} + \frac{1}{a_2}\right)\left[ G\,\frac{\hat{\boldsymbol{r}}\hat{\boldsymbol{r}}}{\hat{r}^2}+H\left({\boldsymbol{I}}-\frac{\hat{\boldsymbol{r}}\hat{\boldsymbol{r}}}{\hat{r}^2}\right)\right]\boldsymbol{\cdot}\boldsymbol{\nabla}(\hat{\varPhi}_{12}) \nonumber\\ &\quad -\frac{2 \rho_p \left(a^2_1-a^2_2\right) \boldsymbol{g}}{9 \mu_f}\boldsymbol{\cdot}\left[ L\,\frac{\hat{\boldsymbol{r}}\hat{\boldsymbol{r}}}{\hat{r}^2} + M\left({\boldsymbol{I}}-\frac{\hat{\boldsymbol{r}}\hat{\boldsymbol{r}}}{\hat{r}^2}\right)\right], \end{align}
where  $\hat {\boldsymbol {r}}$ is the vector from the centre of particle 2 to the centre of particle 1, and
 ${\boldsymbol {I}}$ is the unit second-order tensor. Here,
 $A$ and
 $B$ are the mobility functions for two hydrodynamically interacting spherical particles in a linear flow field,
 $L$ and
 $M$ are the mobility functions for two unequal-sized spherical particles settling under gravity through a quiescent fluid, and
 $G$ and
 $H$ are the mobility functions for two spherical particles interacting hydrodynamically and moving because of a central potential. Also,
 $A$,
 $L$,
 $G$ are axisymmetric mobilities (i.e. mobility functions responsible for the relative motion along the line-of-centres), and
 $B$,
 $M$,
 $H$ are asymmetric mobilities (i.e. mobility functions responsible for the relative motion normal to the line-of-centres). These mobility functions depend on the size ratio
 $\kappa = a_2/a_1$ and dimensionless centre-to-centre distance
 $r=2|\hat {\boldsymbol {r}}|/(a_1+a_2)$. Dhanasekaran et al. (Reference Dhanasekaran, Roy and Koch2021a) calculated the modifications of the axisymmetric mobilities due to non-continuum lubrication interactions, where they considered continuum hydrodynamic interactions when
 $\xi > O(Kn)$, and non-continuum lubrication interactions when
 $\xi \leq O(Kn)$. In this study, we use the uniformly valid solution of axisymmetric mobilities developed by them.
We are interested in uncharged drops or particles in a gas, thus the potential  $\hat {\varPhi }_{12} = \hat {\varPhi }_{{vdW}}$ is due solely to van der Waals attraction. Assuming pairwise additivity of the intermolecular attractions, Hamaker (Reference Hamaker1937) calculated the van der Waals force between two isolated particles. The force potential as a function of dimensionless centre-to-centre distance for two unequal-sized particles without retardation is then
 $$\begin{gather} \hat{\varPhi}_{{vdW}}={-}\frac{A_H}{6}\left[\frac{8\kappa}{(r^2-4)(1+\kappa)^2}+\frac{8\kappa}{r^2(1+\kappa)^2-4(1-\kappa)^2} \right. \nonumber\\ +\left.\ln\left\{\frac{(r^2-4)(1+\kappa)^2}{r^2(1+\kappa)^2-4(1-\kappa)^2}\right\}\right], \end{gather}$$
where  $A_H$ is the Hamaker constant for the materials composing the two spheres. Typically,
 $A_H$ is of order
 $10^{-19}\unicode{x2013}10^{-21}$J (see Russel et al. Reference Russel, Saville and Schowalter1991).
The induced-dipole/induced-dipole interaction between the molecules results in van der Waals attraction. We can express this induced-dipole/induced-dipole interaction in the form of a summation of characteristic electromagnetic waves with finite propagation speed. The finite propagation speed of electromagnetic waves alters the induced-dipole/induced-dipole interactions when droplet separations are comparable with or larger than the London wavelength  $\lambda _L$ (
 $\approx 0.1\,\mathrm {\mu }{\rm m}$). The effect of electromagnetic retardation was not considered in Hamaker's calculation; hence (2.4) is valid only for separations less than
 $\lambda _L$. Schenkel & Kitchener (Reference Schenkel and Kitchener1960) analysed the retardation effect and provided the following expressions for
 $\hat {\varPhi }_{{vdW}}$ when
 $\xi = r-2 \ll 1$:
 \begin{equation} \hat{\varPhi}_{{vdW}} = \left\{ \begin{array}{ll} \displaystyle -\left(\dfrac{\kappa}{3(1+\kappa)^2}\right)\left(\dfrac{A_H}{\xi + 0.855 N_L \xi^2}\right), & \text{for}\ \xi < 4/N_L,\\ \displaystyle -\left(\dfrac{\kappa}{\left(1+\kappa\right)^2}\right)\left(\dfrac{A_H}{\xi}\right)\left[ \dfrac{4.9}{15 N_L \xi} - \dfrac{8.68}{45 N^2_L \xi^2} + \dfrac{4.72}{105 N^3_L \xi^3} \right], & \text{for}\ \xi > 4/N_L, \end{array}\right. \end{equation}
where  $N_L$ is the radius of the two particles scaled by the retardation wavelength
 $\lambda _L$ (i.e.
 $N_L = 2 {\rm \pi}(a_1+a_2)/\lambda _L = 2 {\rm \pi}a_1 (1+\kappa )/\lambda _L)$.
We choose a spherical coordinate system  $(r,\theta,\phi )$ with origin at the centre of sphere 2 and
 $\theta = 0$ being the vorticity axis (
 $x_3$). To non-dimensionalize the system, we consider
 $a^*\ (=(a_1+a_2)/2)$,
 $\dot {\gamma }^{-1}$ and
 $\dot {\gamma }a^*$ as the characteristic length, time and velocity scales of the problem, respectively. Thus the non-dimensional radial separation between the centres of the two spheres lies in the range from
 $r=2$ (referred to as the collision sphere, indicated as sphere 3 in figure 2) to
 $r=\infty$ (where one sphere does not influence the other). The size ratio
 $\kappa$, which can vary in the range
 $(0,1]$, captures the geometry of the two-spheres system. For
 ${\boldsymbol {U}}^\infty (\boldsymbol {x}) = (\dot {\gamma }x_2,0,0)$, the dimensionless relative velocity
 $\boldsymbol {v}\ (= \hat {\boldsymbol {v}}_{12}/\dot {\gamma }a^*)$ can be written as
 $\boldsymbol {v} = v_r \hat {e}_r + v_{\theta } \hat {e}_{\theta } + v_{\phi } \hat {e}_{\phi }$, where
 \begin{gather} v_r ={-}L Q \sin\theta\cos\phi + (1-A)r \sin^2\theta\sin\phi\cos\phi-\frac{G}{N_F}\,\frac{{\rm d}\varPhi_{12}}{{\rm d}r}, \end{gather}
 \begin{gather}v_{\theta} ={-}M Q \cos\theta\cos\phi + (1-B)r \sin\theta\cos\theta\sin\phi\cos\phi, \end{gather}
 \begin{gather}v_{\phi} = M Q \sin\phi - r \sin\theta \left[\sin^2\phi + \frac{1}{2}\,B \left(\cos^2\phi - \sin^2\phi \right) \right]. \end{gather}
Here,  $\varPhi _{12} = \hat {\varPhi }_{12}/A_H$ is the dimensionless interparticle potential. The dimensionless number
 $N_F$ measures the relative importance of viscous forces due to shear and van der Waals forces:
 \begin{equation} N_F = \frac{3{\rm \pi}\mu_f a_1^3\kappa(1+\kappa)\dot{\gamma}}{2A_H}. \end{equation}
The other non-dimensional quantity is  $Q$, which is the terminal velocity due to gravity scaled with
 $\dot {\gamma }a^*$:
 \begin{equation} Q = \frac{4 \rho_p g a_1 (1-\kappa)}{9 \mu_f \dot{\gamma}}. \end{equation}
The quantity  $Q N_F$, which measures the relative strength of gravitational and van der Waals forces, is independent of the fluid viscosity
 $\mu _f$ and the imposed shear rate
 $\dot {\gamma }$. We denote
 $Q N_F$ as
 $N_g$:
 \begin{equation} N_g = \frac{2 {\rm \pi}\rho_p g a_1^4 \kappa (1-\kappa^2)}{3 A_H}. \end{equation}
With the expressions for the relative velocity (2.6)–(2.8) thus obtained, we need to solve the following relative trajectory equations:
 \begin{gather} \frac{{\rm d}r}{{\rm d}t} = v_r, \end{gather}
 \begin{gather}\frac{{\rm d}\theta}{{\rm d}t} = \frac{v_{\theta}}{r}, \end{gather}
 \begin{gather}\frac{{\rm d}\phi}{{\rm d}t} = \frac{v_{\phi}}{r \sin\theta}, \end{gather}
where  $t$ is the dimensionless time.
2.2. Expressions for the particle collision rate and efficiency
The collision rate is defined as the rate at which particles of radii  $a_1$ and
 $a_2$ with number densities
 $n_1$ and
 $n_2$ collide with each other per unit volume. Mathematically, the collision rate
 $K_{12}$ is equal to the flux of pairs into the collision sphere of radius
 $r = 2$, thus we can express it in terms of the pair distribution function
 $P(r)$ and the particle relative velocity
 $\boldsymbol {v}$. In this problem, the collision rate over the collision sphere scales as
 $n_1n_2\dot {\gamma }(a_1+a_2)^3$, and therefore we can write
 \begin{equation} \frac{K_{12}}{n_1n_2\dot{\gamma}(a_1+a_2)^3}={-} \frac{1}{8} \int_{(r=2)\&(\boldsymbol{v}\boldsymbol{\cdot}{\boldsymbol{n}}<0)} (\boldsymbol{v}\boldsymbol{\cdot}{\boldsymbol{n}}) P\,{\rm d}A, \end{equation}
where  ${\boldsymbol {n}}$ is the outward unit normal at the spherical contact surface. For a dilute suspension, the pair distribution function is governed by the quasi-steady Fokker–Planck equation for regions of space outside the contact surface,
 \begin{equation} \boldsymbol{\nabla}\boldsymbol{\cdot}(P\boldsymbol{v}) = 0, \end{equation}
with the upstream boundary condition  $P \rightarrow 1$ as
 $r \rightarrow \infty$. For our numerical calculations we consider
 $P=1$ at
 $r=r_{\infty }$, a large but finite radial location.
The deterministic background flow and high particle Péclet number (negligible Brownian diffusion) make the relative motion deterministic. Therefore, we can find the collision rate using trajectory analysis. Using (2.16) and the divergence theorem, the integral in (2.15) can be taken over the surface that encloses the volume occupied by all trajectories that originate at  $r=r_{\infty }$ (far upstream) and terminate at
 $r=2$ (collision surface). The trajectories far upstream will become parallel to the
 $x_1$-axis as the interparticle interactions become insignificant for large separations. Thus the collision rate is equal to the flux through a cross-section
 $A_c$ located far upstream and perpendicular to the flow axis:
 \begin{equation} \frac{K_{12}}{n_1n_2\dot{\gamma}(a_1+a_2)^3}={-} \frac{1}{8} \int_{A_c} (\boldsymbol{v} \boldsymbol{\cdot}{\boldsymbol{n}}')|_{r_{\infty}}\,{\rm d}A, \end{equation}
where  ${\boldsymbol {n}}'$ is the unit outward normal vector at the area element of
 $A_c$. From here onwards, we will label this area
 $A_c$ as the upstream interception area. Equation (2.17) bypasses the evaluation of the pair probability
 $P$. The interaction between the spheres is negligible at large separation, thus we can calculate
 $\boldsymbol {v}$ using the far-field values of the hydrodynamic mobilities. At large separation,
 $\boldsymbol {v}$ becomes parallel to the flow axis. We find that
 $(\boldsymbol {v} \boldsymbol {\cdot }{\boldsymbol {n}}')|_{r_{\infty }} = -Q + \bar {x}_2$, where
 $\bar {x}_i = x_i/a^*$ (
 $i=1,2,3$). Therefore, (2.17) reduces to
 \begin{equation} \frac{K_{12}}{n_1n_2\dot{\gamma}(a_1+a_2)^3}= \frac{1}{8} \int_{A_c} (Q - \bar{x}_2)\,{\rm d}\kern0.06em \bar{x}_3 \, {\rm d}\kern0.06em \bar{x}_2. \end{equation}
We denote the collision rates with and without interactions as  $K_{12}^{PI}$ and
 $K_{12}^{0}$, respectively. The collision efficiency
 $E_{12}$ is defined as the ratio of
 $K_{12}^{PI}$ to
 $K_{12}^{0}$:
 \begin{equation} E_{12} = \frac{K^{PI}_{12}}{K_{12}^{0}}. \end{equation}
Using trajectory analysis, we determine the upstream interception area, within which two widely separated spheres will eventually collide.
3. Ideal collision rate
In the absence of interparticle interactions, the particle trajectories coincide with the undisturbed fluid streamlines. Therefore, in the ideal collision rate calculation,  $P=1$ for all radial separation, and we have
 \begin{align}
\frac{K_{12}^0}{n_1n_2\dot{\gamma}(a_1+a_2)^3}&={-}
\frac{1}{8}
\int_{(r=2)\&( \boldsymbol{v}\boldsymbol{\cdot}{\boldsymbol{n}}<0)}
(\boldsymbol{v}\boldsymbol{\cdot}{\boldsymbol{n}})r^2
\sin\theta\,{\rm d}\theta\, {\rm d}\phi
\end{align}
 \begin{align} &= \frac{1}{2}
\int_0^{2{\rm \pi}}\,{\rm d}\phi \int_0^{\rm \pi}\,{\rm d}\theta
\sin\theta
\,\bigl(|\boldsymbol{v}\boldsymbol{\cdot}{\boldsymbol{n}}|\mathcal{H}
(-\boldsymbol{v}\boldsymbol{\cdot}{\boldsymbol{n}})\bigr)|_{r=2},
\end{align}
where  $\mathcal {H}$ is the Heaviside step function. In the absence of interactions, we can calculate
 $\boldsymbol {v}$ using (2.6), (2.7) and (2.8) with
 $A=0$,
 $B=0$,
 $L=1$,
 $M=1$,
 $G=1$ and
 ${\rm d}\varPhi _{12}/{\rm d}r=0$. On the surface of the collision sphere,
 \begin{equation} v_r|_{r=2} = \boldsymbol{v}\boldsymbol{\cdot}{\boldsymbol{n}}|_{r=2} ={-}\sin\theta\cos\phi \, (Q - 2\sin\theta\sin\phi). \end{equation}
There are two regions on the collision sphere where collisions can occur when simple shear flow alone ( $Q \rightarrow 0$ limit) drives the motion of the particles. One region is
 $r=2$,
 $0 \leq \theta \leq {\rm \pi}$,
 $0.5{\rm \pi} \leq \phi \leq {\rm \pi}$, and the other region is
 $r=2$,
 $0 \leq \theta \leq {\rm \pi}$,
 $1.5{\rm \pi} \leq \phi \leq 2{\rm \pi}$. The upstream interception area formed by trajectories starting from each region is a semicircle (of non-dimensional radius 2). Therefore, the total upstream interception area
 $A_c$ for a simple shear flow is a circle of non-dimensional radius
 $2$. The collisions due to differential sedimentation alone (
 $Q \rightarrow \infty$ limit) occur over the hemisphere in the gravity direction. The upstream interception area, in this case, is also a circle of non-dimensional radius
 $2$. The collision regions on the collision sphere for intermediate values of
 $Q$ can be obtained by finding the
 $\theta$ and
 $\phi$ values where
 $v_r|_{r=2}<0$. The region on the collision sphere that contributes to the influx of particle trajectories can be calculated analytically, and we have found the collision rate for the mixed problem to be
 $$\begin{gather} \frac{K_{12}^0}{n_1n_2\dot{\gamma}(a_1+a_2)^3} = \left[ \frac{1}{12}\,\sqrt{4-Q^2}\,(8+Q^2) + Q\sin^{{-}1}\left(\frac{Q}{2}\right)\right]\mathcal{H}(2-Q) \nonumber\\ + \frac{{\rm \pi} Q}{2}\,\mathcal{H}(Q-2). \end{gather}$$
Figure 3 shows the variation of the ideal collision rate as a function of the strength of gravity relative to the simple shear flow. This ideal collision rate matches asymptotically Smoluchowski's results in the  $Q\rightarrow 0$ and
 $Q\rightarrow \infty$ limits, which correspond to simple shear flow alone and pure differential sedimentation, respectively. For intermediate values of
 $Q$, the ideal collision rate is not a linear combination of the rates resulting from the two driving forces acting independently. Interestingly, in this problem for
 $Q>2$, the ideal collision rate is exactly equal to the collision rate due to differential sedimentation, although the simple shear flow continues to influence the pair trajectories for any finite
 $Q$. This feature seems to be peculiar to simple shear flow since for uniaxial compressional flow, the pure differential sedimentation collision rate is achieved asymptotically in the
 $Q\rightarrow \infty$ limit (see Dhanasekaran et al. Reference Dhanasekaran, Roy and Koch2021a).
The variation of ideal collision rate for a pair of spheres settling in a simple shear flow (where the flow axis is aligned with gravity) with  $Q$. The results for pure simple shear flow (
 $4/3$), and pure differential sedimentation (
 ${\rm \pi} Q/2$) are included for reference.

4. Collisions with interparticle interactions
4.1. Collision efficiency without gravity and van der Waals forces ($Q=0$, $N_F^{-1}=0$)


In the absence of gravity and van der Waals forces, (2.12)–(2.14) yield the following integrals for the relative trajectories (see Batchelor & Green Reference Batchelor and Green1972a):
 \begin{gather} \bar{x}_3 = \zeta_3\,\varphi(r), \end{gather}
 \begin{gather}\bar{x}_2^2 = \varphi^2(r)\,[\zeta_2 + \varPsi(r)] , \end{gather}
where  $\zeta _2$ and
 $\zeta _3$ are the constants specifying a particular trajectory. The expressions for
 $\varphi (r)$ and
 $\varPsi (r)$ are
 \begin{gather} \varphi(r) = \exp \left[\int_r^{\infty} \frac{A(r')-B(r')}{1-A(r')}\,\frac{{\rm d}r'}{r'}\right], \end{gather}
 \begin{gather}\varPsi(r) = \int_r^{\infty} \frac{B(r')\,r'\,{\rm d}r'}{[1-A(r')]\,\varphi^2(r')}. \end{gather}
We perform integrals in (4.3) and (4.4) using near-field and far-field asymptotic expressions (for both  $A(r)$ and
 $B(r)$) along with an exact bispherical coordinate solution of
 $A(r)$ and a twin-multipole expansion solution of
 $B(r)$ for intermediate separations. Continuum hydrodynamic interactions between a pair of solid spheres result in two types of relative trajectories – open and closed (see Batchelor & Green Reference Batchelor and Green1972a). These trajectories are fore–aft symmetric. Figure 4(a) shows in-plane (i.e. at
 $\bar {x}_3 = 0$) relative trajectories for continuum hydrodynamic interactions. The separatrices (black lines in figure 4a)
 $\zeta _2=0$ for continuum hydrodynamic interactions separate the closed and open trajectories (see Batchelor & Green Reference Batchelor and Green1972a). We find that non-continuum lubrication interactions introduce two new kinds of relative trajectories – collision and semi-closed – but trajectories remain fore–aft symmetric. Therefore, non-continuum lubrication interactions result in four types of trajectories: (i) open trajectories that arrive from infinity and depart to infinity without reaching the collision sphere; (ii) collision trajectories that arrive from infinity and collide on the surface of the contact sphere
 $r=2$, or depart from the surface of the contact sphere and go to infinity; (iii) semi-closed trajectories that start from the surface of the contact sphere and return to it; and (iv) closed trajectories. Figure 4(b) shows the pattern of pair trajectories at the shearing plane (i.e. at
 $\theta = {\rm \pi}/2$) for non-continuum hydrodynamic interactions. Interestingly, two distinct types of separatrix exist due to non-continuum lubrication interactions. The separatrix that separates semi-closed and collision trajectories touches the
 $\bar {x}_1$-axis at
 $r=\infty$. So for this separatrix,
 $\bar {x}_2=0$ at
 $r=\infty$, which yields
 $\zeta _2=0$. The other separatrix, which divides regions of collision and open trajectories, is tangent to the collision sphere at
 $\bar {x}_2=2$, and maintains a finite gap from the
 $\bar {x}_1$-axis at
 $r=\infty$; accordingly, from (4.2), we have
 $\zeta _2 = (4/\varphi ^2(2)) - \varPsi (2)$. For semi-closed and closed trajectories
 $\zeta _2<0$, and for open trajectories
 $\zeta _2> (4/\varphi ^2(2))-\varPsi (2)$. The trajectories confined between these two types of separatrix are collision trajectories. These separatrices form the boundary of the collision trajectories in three dimensions. The cross-section of this boundary becomes a semicircle as
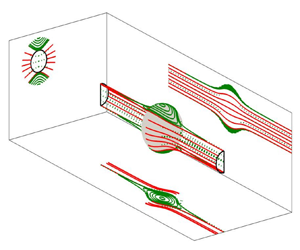
 $r \rightarrow \infty$ (see figure 5). From figure 5, it can be seen that out-of-plane closed trajectories are present, while no closed trajectories exist in the shearing plane.
A comparison is made between (a) continuum ( $Kn=0$) and (b) non-continuum (
 $Kn=10^{-1}$) in-plane pair trajectories when
 $\kappa =1$. The sphere located at the centre is the test sphere, and the black circle is the collision circle in the shearing plane. Arrows on the trajectories indicate their directions, and black arrows in each quadrant indicate the flow direction. In (a), blue and green lines are open and closed trajectories, and continuous black lines are the separatrices between them. In (b), blue, continuous red and dotted green lines are open, colliding and semi-closed trajectories. Dashed red lines start from the collision sphere and depart to infinity. Continuous black lines are separatrices between regions of semi-closed and collision trajectories, and between regions of collision and open trajectories. It is important to note that the trajectories for both cases are fore–aft symmetric.

The sphere (with non-dimensional radius 2) represents the collision surface. The limiting collision (continuous red lines) and semi-closed (dotted green lines) trajectories, and the closed (continuous green lines) trajectories along with their projections in different planes, are plotted for  $Kn=10^{-2}$ and
 $\kappa =0.5$. The black circle represents the upstream interception area whose radius varies depending on the values of
 $Kn$ and
 $\kappa$.

The hydrodynamic mobility functions always asymptote to a specific numerical value as the separation approaches infinity; in this case, both  $A$ and
 $B$ approach zero as
 $\xi \rightarrow \infty$. The lubrication force becomes dominant for
 $\xi \ll 1$. The radial mobility
 $(1 - A)$ is
 $O(\xi )$ for continuum lubrication interactions and thus precludes finite time contact between the spheres. As was discussed earlier, the non-continuum lubrication interactions lead to
 $1-A = O(1/{\ln (\ln (Kn/\xi ))})$, which vanishes slower than its continuum counterpart. This weaker non-continuum lubrication force arises at
 $\xi = O(Kn)$ and is responsible for the contact between the spheres in finite time. On the shearing plane, the minimum distance of the separatrix (that separates closed and open trajectories) from the collision sphere,
 $d^{sep}_{min} = \bar {x}_2-2 = r-2$ at
 $\bar {x}_1=0$, is finite for continuum hydrodynamic interactions. To find
 $d^{sep}_{min}$, we put
 $\bar {x}_2=r$ and
 $\zeta _2=0$ in (4.2), then solve for
 $r$ numerically. For a given size ratio,
 $d^{sep}_{min}$ decreases gradually with increasing
 $Kn$, and it becomes zero when
 $Kn$ is greater than
 $Kn_c$. We call this
 $Kn_c$ the critical Knudsen number for a given
 $\kappa$. The separatrix for
 $Kn>Kn_c$ always maintains a finite distance from the flow axis in the far field. Zinchenko (Reference Zinchenko1984) and later Wang et al. (Reference Wang, Zinchenko and Davis1994) analysed a problem that also encounters weakened lubrication interactions, similar to the current problem. They considered collisions of small drops in linear flow fields. For drops, the radial mobility is
 $1-A = O(\sqrt {\xi })$ for
 $\xi \ll 1$, which also vanishes slower than its rigid counterpart and therefore results in collision trajectories and finite collision rates in the absence of colloidal forces. They found a critical size ratio for a given viscosity ratio necessary for a collision to occur, thus finding a phase boundary for the existence of stable emulsions in the absence of colloidal forces.
Following the works of Zinchenko (Reference Zinchenko1984) and Wang et al. (Reference Wang, Zinchenko and Davis1994), we define two regions in  $\boldsymbol {r}$-space (
 $r>2$) as given below:
 \begin{gather} D_f: \bar{x}_2^2 < \varphi^2(r)\,\varPsi(r), \end{gather}
 \begin{gather}D_t: \bar{x}_2^2 + \bar{x}_3^2 \leq \varphi^2(r) \left[\frac{4}{\varphi^2(2)} - \varPsi(2) + \varPsi(r)\right], \end{gather}
where the domain  $D_f$ consists of trajectories with a finite length (i.e. semi-closed and closed trajectories), while trajectories touching the collision sphere (i.e. semi-closed and collision trajectories) occupy the region
 $D_t$. According to their definitions, these two regions must have overlap regions because semi-closed trajectories have finite lengths, and at the same time, they touch the collision sphere. The same is also evident from figure 5, where projections of the separatrices in different planes overlap. Therefore, semi-closed trajectories belong to the region
 $D_f \cap D_t$. Collision trajectories belong to
 $D_t - (D_f \cap D_t)$, closed trajectories belong to
 $D_f - (D_f \cap D_t)$, and open trajectories do not belong to any of these regions. The boundaries of the regions
 $D_f$ and
 $D_t$ are formed by rotating the in-plane separatrices corresponding to
 $\zeta _2 = 0$ about the
 $\bar {x}_2$-axis, and
 $\zeta _2 = (4/\varphi ^2(2))-\varPsi (2)$ about the
 $\bar {x}_1$-axis. The volumes of the regions
 $D_f$ and
 $D_t$ depend on
 $Kn$ and
 $\kappa$.
Unlike the scenario with continuum interactions, the collision rate is non-zero for non-continuum lubrication interactions, even in the absence of the van der Waals force. The expression for the collision efficiency in this case is
 \begin{equation} E_{12} = \frac{1}{8}\,\zeta^{3/2}_2 = \left(\frac{1}{\varphi^2(2)} - \frac{\varPsi(2)}{4}\right)^{3/2}. \end{equation}
Figure 6(a) shows the variation of the collision efficiencies with  $Kn$ for different size ratios. As expected, for a given
 $\kappa$, the collision efficiency decreases with decreasing
 $Kn$. Most importantly, the collision efficiency is zero when
 $Kn$ is less than some critical value
 $Kn_c$. In contrast, our previous study (Dhanasekaran et al. Reference Dhanasekaran, Roy and Koch2021a) observed that collisions in a uniaxial compressional flow could occur without van der Waals forces for arbitrarily small
 $Kn$. In simple shear flow, the driving force for relative motion is primarily tangential at the closest approach. Thus the non-continuum modification of the resistivity for normal motion is less effective in simple shear flow than in uniaxial compressional flow. The critical Knudsen number
 $Kn_c$ is different for different values of
 $\kappa$. In (4.7), the quantity
 $(4-\varphi ^2(2)\,\varPsi (2))$ switches sign at
 $Kn=Kn_c$. Figure 6(b) shows that
 $Kn_c$ decreases as
 $\kappa$ increases. The
 $Kn_c\unicode{x2013}\kappa$ plot shows the demarcation between the region of stable dispersion (no collision possible) and the region of unstable dispersion (collision possible). The same figure also shows the variation of
 $d^{sep}_{min}$ with
 $\kappa$, and it is evident that the trends of
 $Kn_c$ and
 $d^{sep}_{min}$ are quite similar. The region of closed trajectories is larger for particles with a smaller
 $\kappa$, therefore
 $Kn_c$ decreases with increasing
 $\kappa$. For a medium with the mean free path
 $\lambda _0$, and
 $\kappa =1$, the critical particle size is
 $a_1=\lambda _0/Kn_c$. So, using the value of
 $Kn_c$, we can create a stable dispersion of equal-sized drops. Another important application of
 $Kn_c$ might be in detecting the mean free path of a gaseous medium. For known values of
 $a_1$ and
 $\kappa$, the mean free path of the medium can be found from the expression
 $\lambda _0=a_1(1+\kappa )\,Kn_c/2$.
(a) The collision efficiency for particles in a simple shear field as a function of  $Kn$ for different
 $\kappa$ without van der Waals forces (i.e.
 $N_F=\infty$). For any value of
 $\kappa$, the collision efficiency decreases with decreasing
 $Kn$. The dotted lines corresponding to each curve indicate the value of the critical Knudsen number
 $Kn_c$ for that value of
 $\kappa$. (b) Plot showing how
 $Kn_c$ varies with
 $\kappa$. The solid red circles indicate the minimum distance of the separatrices from the collision sphere for
 $\kappa =0.3,0.4,\ldots,1.0$ when a pair of particles interacts through continuum hydrodynamics. The lower inset in (b) shows continuum in-plane separatrices for different values of
 $\kappa$. The black dashed line is a separatrix that separates closed and open streamlines for a single sphere in a simple shear flow. The upper inset in (b) shows a zoomed-in view of the separatrices near
 $\bar {x}_1=0$ in increasing order of
 $\kappa$ from the top.

4.2. Collision efficiency with van der Waals forces but without gravity ($Q=0$, $N_F^{-1} \neq 0$)


The van der Waals force acts along the line joining the two spheres’ centres, thus influencing only the radial component of the relative velocity. The last term on the right-hand side of (2.6) represents the relative velocity due to van der Waals attractions, whose potentials are expressed by (2.4) and (2.5). We use a uniformly valid solution of the mobility function  $G$, which captures non-continuum hydrodynamic interactions for separations
 $\xi \leq O(Kn)$, and continuum hydrodynamic interactions for
 $\xi > O(Kn)$. In the presence of van der Waals interactions, the parameter
 $N_F$ becomes greater than zero. The van der Waals interaction eliminates the fore–aft symmetry of the relative trajectories, thus the determination of the upstream interception area becomes non-trivial.
The dimensionless trajectory equations (2.12)–(2.14) form an autonomous system, thus we can reduce the system to two equations:
 \begin{gather} \frac{{\rm d}r}{{\rm d}\phi} ={-} \frac{r(1-A) \sin^2\theta\sin\phi\cos\phi-\dfrac{G}{N_F}\,\dfrac{{\rm d}\varPhi_{12}}{{\rm d}r}} {\left[\sin^2\phi + \tfrac{1}{2} B \left(\cos^2\phi - \sin^2\phi \right) \right]}, \end{gather}
 \begin{gather}\frac{{\rm d}\theta}{{\rm d}\phi} ={-} \frac{(1-B) \sin\theta\cos\theta\sin\phi\cos\phi}{\left[\sin^2\phi + \tfrac{1}{2} B \left(\cos^2\phi - \sin^2\phi \right) \right]}. \end{gather}
Equations (4.8) and (4.9) are solved numerically using a fourth-order Runge–Kutta method (we use the ‘ode45’ subroutine in MATLAB). The near-field and far-field expressions for  ${\rm d}r/{\rm d}\phi$ and
 ${\rm d}\theta /{\rm d}\phi$ can be derived by using respective near-field and far-field asymptotic forms of
 $A(r)$,
 $B(r)$ and
 $G(r)$. In this subsection, first, we will illustrate typical in-plane and off-plane trajectories, and a typical upstream interception area in three dimensions, using only the unretarded form of the van der Waals potential. Then we will show the upstream interception areas and collision efficiencies as a function of different relevant parameter values with both unretarded and retarded van der Waals potentials.
Figure 7 shows some typical in-plane trajectories for  $Kn=10^{-2}$ and
 $N_F=10$ when
 $\kappa =0.5$. We find two kinds of in-plane trajectories – open and colliding. The van der Waals force enables satellite spheres to collide on the rear side of the test sphere. This type of collision trajectory does not exist in the absence of van der Waals interactions. Some open trajectories convert into collision trajectories because of van der Waals interactions, and these converted collision trajectories terminate on the rear side of the collision sphere. Thus the separatrices that separate open and colliding trajectories asymptote with the
 $x_1$-axis (flow axis) in the far downstream, and maintain a finite distance from the
 $x_1$-axis in the far upstream. This distance is greater for non-continuum hydrodynamic interactions compared to their continuum counterparts (see figure 7). Figure 8 shows two new kinds of off-plane collision trajectories. In one case, we find that the satellite sphere undertakes multiple circulations around the test sphere before collision (see figure 8a), whereas in the other case, the satellite sphere starts from a point near the vorticity axis and spirals in towards the test sphere to collide (see figure 8b). Feke & Schowalter (Reference Feke and Schowalter1983) and Wang et al. (Reference Wang, Zinchenko and Davis1994) have reported similar collision trajectories for colloidal particles interacting through continuum hydrodynamics in a simple shear flow.
A comparison is made between in-plane continuum and non-continuum relative trajectories for  $N_F=10$ and
 $\kappa =0.5$. In the presence of van der Waals interactions, pair trajectories are not fore–aft symmetric. Blue lines are open trajectories. Red continuous (
 $Kn=10^{-2}$) and dash-dotted (
 $Kn=0$) lines indicate collision trajectories starting from different downstream locations but ending at the same point on the collision circle. Collisions occur on both the front and rear sides of the test sphere; trajectories designated by
 $1$,
 $1'$,
 $2$,
 $2'$ are such examples. Black continuous and dash-dotted lines are in-plane separatrices for non-continuum and continuum hydrodynamic interactions.

Off-plane collision trajectories in the presence of van der Waals forces when  $Kn=10^{-2}$,
 $N_F=10$ and
 $\kappa =0.5$. In (a), a trajectory coming from upstream makes multiple circulations before hitting the collision sphere. In (b), a trajectory starts near the vorticity axis and spirals in towards the collision surface. In both plots, blue and black dots are the start and end locations of the trajectories.

As discussed below, we employ the backward integration method (first used by Adler Reference Adler1981) for obtaining the upstream interception area because this method considers collision trajectories of all types. Here, the separatrices that separate colliding and non-colliding trajectories define the boundary of the upstream interception area. It is well established that the van der Waals force becomes significant only when particles are in close separation (see Zhang & Davis Reference Zhang and Davis1991; Wang et al. Reference Wang, Zinchenko and Davis1994). Therefore, the boundary of  $D_f$ must merge with the separatrices in the
 $r\rightarrow \infty$ limit, and the far downstream part of a collision trajectory must belong to the region
 $D_f$. The far-field coordinates of the boundary of
 $D_f$ are obtained after substituting the far-field expressions for
 $A(r)$ and
 $B(r)$ into (4.2) and (4.1):
 \begin{gather} \bar{x}_3 \sim \zeta_3 \left[1 + \frac{20}{3}\,\frac{1+\kappa^3}{(1+\kappa)^3}\,\frac{1}{r^3} \right], \end{gather}
 \begin{gather}\bar{x}_2^2 \sim \left(\frac{\bar{x}_3}{\zeta_3} \right)^2\left[\zeta_2 + \frac{32}{2}\, \frac{3(1+\kappa^5)+5\kappa^2(1+\kappa)}{3(1+\kappa)^5}\,\frac{1}{r^3}\right]. \end{gather}
For determining the separatrices, we integrate (4.8) and (4.9) from far downstream to far upstream (i.e.  $\phi$ varies from
 ${\rm \pi}$ to
 $0$ for
 $\bar {x}_2 > 0$, and from
 ${\rm \pi}$ to
 $2{\rm \pi}$ for
 $\bar {x}_2 < 0$). We take
 $r=10$ as a reasonably large separation for far-field expressions to be valid. Thus the starting positions of these separatrices are obtained by fixing
 $r=10$ and calculating
 $\theta$ and
 $\phi$ according to (4.10) and (4.11) with
 $\zeta _2=0$. Figure 9 shows one-quarter of the upstream interception area in the (
 $\bar {x}_1,\bar {x}_2,\bar {x}_3$) space for
 $Kn=10^{-2}$,
 $N_F=10$ and
 $\kappa =0.5$. This area and its mirror image about the shearing plane (for the hemisphere on the negative side of the
 $x_3$-axis) constitute one-half of the total upstream interception area. The other half of the upstream area lies far upstream on the positive
 $x_1$ side, where the flow is in the negative
 $x_1$ direction. It is interesting to note that the curve bounding the area approaches infinity in the vorticity direction (i.e.
 $\bar {x}_3 \rightarrow \infty$ as
 $\bar {x}_2 \rightarrow 0$) because of the attractive van der Waals force between the spheres. Quarters of the upstream interception areas for different values of
 $N_F$ when
 $Kn=10^{-2}$ and
 $\kappa =1.0$ are plotted in figure 10(a). As expected, the area decreases with increasing
 $N_F$, and the area for the unretarded van der Waals interaction is larger than that for the retarded one at the same value of
 $N_F$. We obtain qualitatively similar plots of upstream interception areas for different
 $Kn$ when
 $N_F=10^2$ and
 $\kappa =1.0$ (see figure 10b). However, in this case, the area increases as
 $Kn$ increases.
Separatrices (that separate colliding and non-colliding trajectories) calculated using the backward integration method, plotted for  $Kn=10^{-2}$,
 $N_F=10$ and
 $\kappa =0.5$. The area enclosed by the red lines is one-quarter of the upstream interception area.

Quarters of the upstream interception areas in the  $\bar {x}_2\unicode{x2013}\bar {x}_3$ plane. (a) Upstream interception areas for different values of the van der Waals (vdW) force parameter
 $N_F$ (both unretarded and retarded) when
 $Kn=10^{-2}$ and
 $\kappa = 1.0$. (b) Upstream interception areas for various values of
 $Kn$ when
 $N_F=10^2$ (both unretarded and retarded) and
 $\kappa =1.0$. The solid and dashed lines in both the plots are for the retarded (
 $N_L=250$) and unretarded van der Waals interactions, respectively.

Figures 11(a) and 11(b), respectively, show the variation of the collision efficiency with  $Kn$ (keeping
 $N_F$ fixed) and
 $N_F$ (keeping
 $Kn$ fixed) for two equal-sized spheres in a simple shear flow with non-continuum lubrication interactions and attractive van der Waals forces. Here too, the collision efficiency decreases with decreasing
 $Kn$, but unlike the previous case, for
 $Kn< Kn_c$,
 $E_{12}$ does not approach zero because van der Waals interactions between the particles then drive the entire collision dynamics. As
 $Kn$ approaches zero, the problem becomes equivalent to particles interacting through continuum hydrodynamics and van der Waals forces. The collision efficiency decreases as the strength of van der Waals forces relative to shear-driven viscous forces decreases, or in other words,
 $N_F$ increases (see figure 11b). The collision efficiency for unretarded van der Waals forces is considerably higher than that of the retarded cases when the value of
 $N_F$ is not high (approximately less than
 $10^4$). From an experimental perspective, figure 11(a) would correspond to a set of experiments holding
 $a_1$,
 $\dot {\gamma }$ and the sphere material fixed, and varying the mean free path
 $\lambda _0$ by varying gas pressure; and figure 11(b) would correspond to keeping
 $a_1$ and
 $\lambda _0$ fixed, and varying the shear rate
 $\dot {\gamma }$. In figure 12, we plot the collision efficiency of water drops in air with
 $a_1=10\,\mathrm {\mu }{\rm m}$ and
 $a_1=50\,\mathrm {\mu }{\rm m}$ as a function of
 $\kappa$ at different shear rates
 $\dot {\gamma }$. Given the numerical values of
 $\kappa$ and
 $\dot {\gamma }$, we can calculate easily the relevant dimensionless parameters required to determine the collision efficiencies. The mean free path of air at standard temperature and pressure is
 ${\approx }70$ nm. With decreasing pressure, the mean free path increases, a scenario relevant in the context of droplet coalescence in warm clouds, thus
 $\lambda _0 \approx 0.1\,\mathrm {\mu }{\rm m}$ would be an appropriate choice (see Lamb & Verlinde Reference Lamb and Verlinde2011). The Knudsen numbers as a function of size ratio are given by
 $Kn = 0.02/(1+\kappa )$ for
 $a_1=10\,\mathrm {\mu }{\rm m}$, and
 $Kn = 0.004/(1+\kappa )$ for
 $a_1=50\,\mathrm {\mu }{\rm m}$. For water droplets in air,
 $A_H\approx 5\times 10^{-20}$ J and
 $\mu _f\approx 1.8\times 10^{-5}\,{\rm Pa}\,{\rm s}$. Thus the dimensionless numbers
 $N_L$ and
 $N_F$ vary according to the relations
 $N_L\approx 628(1+\kappa )$ and
 $N_F\approx 1.7 \kappa (1+\kappa )\dot {\gamma }$ when
 $a_1=10\,\mathrm {\mu }{\rm m}$; and
 $N_L\approx 3141(1+\kappa )$ and
 $N_F\approx 212 \kappa (1+\kappa )\dot {\gamma }$ when
 $a_1=50\,\mathrm {\mu }{\rm m}$. For any fixed value of
 $\dot {\gamma }$, the collision efficiency increases with increasing
 $\kappa$. It is important to note that
 $\dot {\gamma }=\infty$ is equivalent to no van der Waals interactions. Therefore, the line
 $\dot {\gamma }=\infty$ must set the minimum value of the collision efficiencies for a given
 $\kappa$. For a fixed
 $\kappa$, the collision efficiency increases monotonically with decreasing
 $\dot {\gamma }$.
(a) Collision efficiency as a function of  $Kn$ for
 $\kappa =1.0$ and
 $N_F = 10^2,10^4$ with
 $N_L=250$. Straight lines indicate the values of the collision efficiency for continuum hydrodynamic interactions in the presence of van der Waals forces. Each curve approaches the corresponding straight line as
 $Kn$ tends to zero. (b) Collision efficiency for two equal-sized spheres as a function of
 $N_F$ for
 $Kn=10^{-1}, 10^{-2}$. The result for
 $Kn=0$ obtained by Wang et al. (Reference Wang, Zinchenko and Davis1994) is included to validate our calculations.

Collision efficiency as a function of  $\kappa$ at different shear rates
 $\dot {\gamma }$ for
 $a_1=10\,\mathrm {\mu }{\rm m}$ and
 $a_1=50\,\mathrm {\mu }{\rm m}$. The
 $\dot {\gamma }=\infty$ line corresponds to collision efficiencies resulting from non-continuum hydrodynamic interactions alone.

4.3. Collision rate and efficiency with gravity and van der Waals forces
There are several scenarios where the background flow and gravity, together, play a significant role in particle collisions. As stated earlier, we assume that the background flow is a simple shear flow. Here, we encounter an additional parameter, the inclination angle between the flow axis and gravity. Dhanasekaran et al. (Reference Dhanasekaran, Roy and Koch2021a) have recently studied collisions due to the combined effect of uniaxial compressional flow and gravity, exploring a range of inclination angles. To reduce complexity, in the current study, we fix the angle between the flow axis and gravity to be zero. In this case, the collision rate will depend on  $Kn$ (quantifying the strength of non-continuum hydrodynamic interactions),
 $\kappa$ (describing the geometry of two interacting spheres),
 $Q$ (capturing the relative velocity due to gravity) and
 $N_F$ (capturing the van der Waals interactions). We will span these parameters to obtain salient features of the collision dynamics. We consider the Knudsen numbers
 $Kn=10^{-2}$ (less dominant non-continuum lubrication interactions) and
 $Kn=10^{-1}$ (significantly dominant non-continuum lubrication interactions), and size ratios
 $\kappa =0.5$ (noticeably different in size) and
 $\kappa =0.9$ (nearly equal-sized). For any chosen
 $Kn$ and
 $\kappa$, we will span
 $Q$ from 0 (simple shear flow dominated regime) to 20 (differential sedimentation dominated regime).
We will now discuss the detailed procedure for determining the upstream interception area without van der Waals interactions. In the presence of gravity and shear, the determination of the upstream interception area using trajectory analysis is more complicated than in the previous cases, where gravity was absent. The path traced by a satellite sphere that starts far upstream and collides with the test sphere located at the origin is classified as a collision trajectory. A set of such collision trajectories will constitute the upstream interception area. The computational cost of trajectory evolution would be immense if we set the initial conditions on the spherical shell at  $r_{\infty }$. Most trajectories starting from the surface at
 $r_{\infty }$ would never reach the collision sphere. Instead, we start the satellite spheres from the collision surface and evolve them according to their time-reversed motion. This is possible because of the quasi-steady nature of the relative trajectory equations. The radial relative velocity of a colliding satellite sphere must be inwards at the collision sphere. Thus we further reduce the computation by selecting only those points on the collision sphere where the sign of the radial relative velocity is negative. However, exactly at
 $r=2$,
 $v_r =0$ because even in the presence of non-continuum lubrication interactions,
 $A=1$,
 $L=0$ and
 $G=0$ at
 $r=2$. For this reason, we consider small separations (
 $\xi \ll 1$) from the collision sphere. We will show converged results without too much computational load at offset
 $\xi = 10^{-6}$. Therefore, we evaluate relevant hydrodynamic mobilities and radial relative velocity from (2.6) at
 $r=2+10^{-6}$. The regions where
 $v_r$ is negative are called influx regions, and the regions where
 $v_r$ is positive are called efflux regions. Only influx regions contribute to the collision rate.
Figure 13 shows the influx–efflux regions on the collision sphere for four different values of  $Q$ when
 $Kn=10^{-2}$,
 $\kappa =0.5$ and
 $N_F=\infty$. The collision sphere is coloured blue. The regions bounded by the black or red lines are the influx regions, and the remaining regions are the efflux regions. For
 $Q=0$, two distinct but identical influx regions exist on the collision sphere, corresponding to the simple shear flow. In both the regions,
 $\theta$ varies from
 $0$ to
 ${\rm \pi}$, whereas
 $\phi \in [{\rm \pi} /2, {\rm \pi}]$ in one region (bounded by black lines) and
 $\phi \in [3{\rm \pi} /2, 2{\rm \pi} ]$ in the other (bounded by red lines). With increasing
 $Q$, the influx region towards the gravity direction (i.e.
 $\bar {x}_1>0$ side) increases, and the influx region opposite to the gravity direction (i.e.
 $\bar {x}_1<0$ side) decreases. The influx regions approach each other with increasing
 $Q$. Eventually, at high enough
 $Q$, they merge. We found that for the above value of
 $Kn$ and
 $\kappa$, these two regions merge when
 $Q>10.2$, and the entire region lies within the hemisphere in the gravity direction. The influence of the simple shear flow becomes negligible with a further increase in
 $Q$, and gravity alone governs the collision dynamics. The bifurcation in the pair trajectory topology with increasing
 $Q$ has also been observed for particles settling in a uniaxial compressional flow by Dhanasekaran et al. (Reference Dhanasekaran, Roy and Koch2021a) and Dubey et al. (Reference Dubey, Gustavsson, Bewley and Mehlig2022).
The influx–efflux regions on the collision sphere for  $Kn=10^{-2}$,
 $\kappa = 0.5$ and
 $N_F=\infty$, for various values of
 $Q$. The influx regions satisfy
 $\boldsymbol {v}\boldsymbol {\cdot }{\boldsymbol {n}}<0$, and the efflux regions satisfy
 $\boldsymbol {v}\boldsymbol {\cdot }{\boldsymbol {n}}>0$. Influx regions are bounded either by black lines or by red lines. In (a), with
 $Q=0$ (i.e. pure simple shear flow), two distinct but identical influx regions exist on the collision sphere. One region lies on the
 $\bar {x}_1<0$ side (opposite to the gravity direction), and the other region lies on the
 $\bar {x}_1>0$ side (gravity direction). In (b), with
 $Q=4$, there are also two influx regions but the region on the
 $\bar {x}_1<0$ side decreases, and the region on the
 $\bar {x}_1>0$ side increases. In (c), with
 $Q=8$, the two influx regions are close to each other. In (d), with
 $Q=12$, only one influx region exist and it lies in the gravity direction.

We integrate (2.12), (2.13) and (2.14) backwards in time to obtain relative trajectories. Not all the trajectories starting from the influx region will be colliding trajectories. They may also include semi-closed trajectories that start and end on the collision sphere and do not contribute to the collision rate. We identify the colliding trajectories by applying the condition that they depart to infinity. All these collision trajectories that go to infinity become parallel to the flow axis. Thus we determine the upstream interception area formed by these collision trajectories. Figure 14 shows the boundaries of the collection of collision trajectories constituting  $A_c$ when
 $\kappa =0.5$,
 $Kn=10^{-2}$ and
 $N_F=\infty$. Two distinct boundaries exist for smaller values of
 $Q$. One of them lies in the gravity direction, where
 $\bar {x}_1>0$ (see figure 14b), and the other lies in the direction opposite to gravity, where
 $\bar {x}_1<0$ (see figure 14a). For
 $Q=0$, the upstream interception area is a circle (a sum of two identical semicircles) corresponding to simple shear flow alone. As expected, the area on the
 $\bar {x}_1<0$ side becomes thinner with increasing
 $Q$, and it disappears for
 $Q>5.3$ (see figure 14a); whereas the area on the
 $\bar {x}_1>0$ side becomes circular as
 $Q$ increases, corresponding to pure differential sedimentation. It is notable from figure 14(a) that with increasing Q, the entire area stretches significantly in the vorticity direction, and narrows in the gradient direction.
The upstream interception areas for various values of  $Q$ when
 $Kn=10^{-2}$,
 $\kappa =0.5$ and
 $N_F=\infty$. For
 $0 \leq Q<5.3$, one area lies in the direction opposite to gravity (a), and the other lies in the gravity direction (b). For
 $Q=0$, each of them is a semicircle. With increasing
 $Q$, the area in the direction opposite to gravity decreases, and it vanishes for
 $Q > 5.3$. On the other side, as
 $Q$ increases, the area becomes a circle, corresponding to pure differential sedimentation.

The collision rates are shown in figure 15(a) as functions of  $Q$ for
 $Kn=10^{-2},10^{-1}$ and
 $\kappa = 0.5,0.9$ when
 $N_F = \infty$. The qualitative behaviours of collision rates for various combinations of
 $Kn$ and
 $\kappa$ are similar. The background shear contributes significantly to the collision rate when
 $Q$ is quite small, and gravity almost exclusively contributes to the collision rate when
 $Q$ is high. It is evident from figure 15(a) that the collision rate due to the combined effect of gravity and shear is not a linear superposition of the collision rates resulting from them individually. We find that the collision rate increases with
 $Q$ for given
 $Kn$ and
 $\kappa$. However, we see a slight decrease in the collision rate for
 $4.7< Q<5.3$ since the collisional area that lies in the direction opposite to gravity disappears around these
 $Q$ values. Therefore, the small bumps that appear around
 $Q=5.3$ in the collision rate curves are physical. Dhanasekaran et al. (Reference Dhanasekaran, Roy and Koch2021a) and Dubey et al. (Reference Dubey, Gustavsson, Bewley and Mehlig2022) reported similar trends for the collision rate of settling spheres in a uniaxial compressional flow with non-continuum hydrodynamics.
Collision rates and efficiencies as functions of the strength of gravity relative to simple shear flow for  $\kappa = 0.5, 0.9$ and
 $Kn=10^{-2},10^{-1}$ in the absence of van der Waals interactions (i.e.
 $N_F=N_g=\infty$). For all
 $Kn$ and
 $\kappa$, the collision rate increases, and the collision efficiency monotonically decreases with increasing
 $Q$.

The collision rate with interactions is smaller than the ideal collision rate evaluated in § 3. The collision efficiency, which measures the extent of this retardation and manifests interesting insights into hydrodynamic interactions, is obtained by dividing the rate with interactions (from figure 15a) by the ideal rate. Figure 15(b) shows the variation of the collision efficiency with  $Q$. In the absence of van der Waals forces, the collision efficiency decreases monotonically with increasing
 $Q$. Like the collision rate curves, the collision efficiency curves exhibit small bumps around
 $Q=5.3$. For
 $Q\rightarrow 0$, the collision efficiency curve approaches asymptotically the value corresponding to the collision efficiency due to simple shear flow alone. At large
 $Q$, the asymptotic behaviour of the collision efficiency indicates the sedimentation-dominated regime. The asymptotic value for
 $Q\rightarrow \infty$ is significantly lower than the
 $Q\rightarrow 0$ result for both
 $\kappa =0.5$ and
 $\kappa =0.9$.
The divergent nature of the van der Waals attraction force near contact makes the radial relative velocity negative over the entire collision surface. Therefore, the entire collision sphere becomes the influx region in the presence of van der Waals forces. We determine the upstream interception area using the numerical technique discussed earlier in this section, with the initial conditions spreading over the entire collision sphere. The parameter  $N_g\ (=QN_F)$, which measures the strength of gravity relative to van der Waals forces, is finite in this case. Figure 16(a) shows how the collision efficiency varies with
 $Q^{-1}$ for
 $N_g=1, 10, 10^2, \infty$ when
 $Kn=10^{-2}$,
 $\kappa =0.5$ and
 $N_L = 500$. A motivation for plotting
 $E_{12}$ with
 $Q^{-1}$ is to allow comparisons with a possible experimental study where the shear rate varies while the parameters describing the particle and medium properties are kept fixed. The collision efficiency with van der Waals forces is always higher than that without, for given values of
 $Kn$ and
 $\kappa$. The collision efficiency increases monotonically with
 $Q^{-1}$ when only non-continuum hydrodynamics is present in the problem (
 $N_g=\infty$ curve in figure 16a). For a fixed
 $N_g$ (other than
 $\infty$), as
 $Q^{-1}$ increases, the strength of van der Waals attractions relative to shear-induced viscous forces decreases since
 $N_F\ (=Q^{-1}N_g)$ increases. Therefore, with increasing
 $Q^{-1}$ (increasing shearing rate),
 $E_{12}$ increases up to a maximum value and then starts decreasing, and finally asymptotes to the value corresponding to the collision efficiency of particles in a simple shear flow in the presence of van der Waals forces and non-continuum hydrodynamics. The trend of
 $Q^{-1}$ versus
 $E_{12}$ curves for different
 $Kn$ are similar qualitatively (see figure 16b). For a given
 $Kn$,
 $E_{12}$ is higher for a smaller
 $N_g$, and for a given
 $N_g$,
 $E_{12}$ is higher for a higher
 $Kn$. The collision efficiencies due to the combined effects of gravity, background shear flow and van der Waals attractions are shown in figure 17 for various combinations of
 $\dot {\gamma }$ and
 $\kappa$ when
 $a_1=10$ and
 $20\,\mathrm {\mu }{\rm m}$. Like the
 $Q=0$ result given in figure 12, the collision process becomes more efficient as
 $\kappa$ increases. However, contrary to the
 $Q=0$ result, the collision efficiency is larger for a higher shearing rate (or higher
 $Q^{-1}$) because the van der Waals force accelerates the collision dynamics in the parameter space considered here.
(a) Collision efficiencies as functions of  $Q^{-1}$ for
 $\kappa = 0.5$ and
 $Kn=10^{-2}$ when
 $N_g=1, 10, 10^2, \infty$ and
 $N_L = 500$. (b) Collision efficiencies for
 $Kn=10^{-1}, 10^{-2}, 10^{-3}$ when
 $N_g=10$. It is important to note that unlike the
 $N_g=\infty$ case, the variation of the collision efficiency with
 $Q^{-1}$ is non-monotonic for small and moderate values of
 $N_g$.

Collision efficiency due to the combined effects of gravity, shear and van der Waals force (retarded) as functions of size ratio  $\kappa$ and shear rate
 $\dot {\gamma }$ when (a)
 $a_1=10\,\mathrm {\mu }{\rm m}$, and (b)
 $a_1=20\,\mathrm {\mu }{\rm m}$. For a water droplet in air,
 $A_H\approx 5\times 10^{-20}$ J, and the dynamic viscosity of air is
 $\mu _f\approx 1.8\times 10^{-5}\,{\rm Pa}\,{\rm s}$. The values of the parameters
 $Kn$,
 $N_L$,
 $N_F$,
 $Q$ and
 $N_g$ for given values of
 $\kappa$,
 $\dot {\gamma }$ and
 $a_1$ can be calculated from their expressions stated earlier.

5. Effects of weak particle inertia on collisions ($St \ll 1$)

The physics of particle inertia can also influence the collisions of particulate matter in a gaseous medium. When the effect of particle inertia is significantly large, the particle trajectories are predominantly ballistic. Tsao & Koch (Reference Tsao and Koch1995) showed that dilute particle suspensions in a simple shear flow with a Stokes number exceeding a critical value  $St_c \approx 5$ can exhibit an ignited state with a Maxwellian particle velocity distribution and nearly ballistic motion when their collisions are elastic. However, at smaller Stokes numbers, such as those considered here, particle velocities return to following the simple shear field between subsequent particle–particle encounters.
Particle inertia, non-continuum hydrodynamics, van der Waals force, gravity and size ratio constitute a formidable five-dimensional parameter space for studying particle collision dynamics. In the previous sections, we studied the combined effects of van der Waals force, gravity and size ratio. This section aims to study the first effect of particle inertia on relative trajectories and collision efficiencies for two equal-sized spheres in a simple shear flow while interacting through non-continuum hydrodynamics, neglecting the effects of the van der Waals force and gravity.
The force-free and torque-free conditions will no longer hold for  $St\neq 0$, thus we cannot formulate the problem solely in terms of hydrodynamic mobilities. Subramanian & Brady (Reference Subramanian and Brady2006) derived the equations governing the dynamics of a pair of spheres in simple shear flow in terms of the relevant hydrodynamic resistance functions representing both relative translation and rotation between the pair. To investigate the effects of weak particle inertia, they obtained the
 $O(St)$ correction to the relative velocity via a regular perturbation expansion. The relative trajectory equations inclusive of
 $O(St)$ terms are (see Subramanian & Brady Reference Subramanian and Brady2006)
 \begin{equation} \frac{{\rm d}{\boldsymbol{r}}}{{\rm d}t} = \boldsymbol{v}^{(0)}({\boldsymbol{r}}) + St \, \boldsymbol{v}^{(1)}({\boldsymbol{r}}), \end{equation}
where
 \begin{align} v_i^{(0)} &= \varGamma^{\infty}_{ij}r_j - \left\{A\,\frac{r_ir_j}{r^2}+B\left(\delta_{ij}- \frac{r_ir_j}{r^2}\right) \right\}E^{\infty}_{jk}r_k, \end{align}
 \begin{align} v_i^{(1)} &= \left(E^{\infty}_{jk}r_jr_k\right)^2r_i\left[(G-H)\left\{\frac{(A-B )^2}{r^4} - \frac{1-A}{r^3}\,\frac{{\rm d}A}{{\rm d}r}\right\}\right. \nonumber\\ &\left.\quad {}+ H\left\{\frac{(A-3B+2)(A-B)}{r^4} -\frac{1-A}{r^3}\left(\frac{{\rm d}A}{{\rm d}r}-\frac{{\rm d}B}{{\rm d}r}\right)\right\}\right] \nonumber\\ &\quad + Hr_j\left[\varGamma^{\infty}_{il} \varGamma^{\infty}_{lj} - B \varGamma^{\infty}_{il}E^{\infty}_{lj} - B E^{\infty}_{il}\varGamma^{\infty}_{lj} - B^2 E^{\infty}_{il}E^{\infty}_{lj}\right] \nonumber\\ &\quad + \frac{r_ir_jr_k}{r^2}\left[(G-H)\left\{\varGamma^{\infty}_{jl} \varGamma^{\infty}_{lk} - B \varGamma^{\infty}_{jl}E^{\infty}_{lk} + (B-2A)E^{\infty}_{jl}\varGamma^{\infty}_{lk} \right.\right. \nonumber\\ &\left.\left.\quad {}- B(B-2A)E^{\infty}_{jl}E^{\infty}_{lk}\right\} + H\left\{2B(A-B)E^{\infty}_{jl}E^{\infty}_{lk} - 2(A-B)E^{\infty}_{jl}\varGamma^{\infty}_{lk} \right\}\right] \nonumber\\ &\quad + Hr_lr_jr_k\left[\left\{\frac{2B(A-B)}{r^2} -\frac{1-A}{r}\,\frac{{\rm d}B}{{\rm d}r}\right\} E^{\infty}_{il}E^{\infty}_{jk}-\frac{2(A-B)}{r^2}\,\varGamma^{\infty}_{il} E^{\infty}_{jk}\right]. \end{align}
In the above expressions,  $A$,
 $B$,
 $C$,
 $E$,
 $G$ and
 $H$ are hydrodynamic mobilities (functions of
 $r$ and
 $\kappa$), and
 $\varGamma ^{\infty }_{ij}$ is the velocity gradient tensor. In § 2, we explained the physical meaning of the mobilities
 $A$,
 $B$,
 $G$ and
 $H$. The mobility function
 $C$ characterizes the relative angular velocity on account of hydrodynamic interactions, and the mobility function
 $E$ represents the translation–rotation coupling. Now,
 $C=2(y_{11}^h+y_{12}^h)$ and
 $E=y_{11}^b-y_{12}^b$, where
 $y_{11}^h$,
 $y_{12}^h$ describe the stresslets of particle 1 due to the torques on particles 1 and 2, respectively, and
 $y_{11}^b$,
 $y_{12}^b$ describe angular velocities of particle 1 due to the torques on particles 1 and 2, respectively (for further details, see Jeffrey & Onishi Reference Jeffrey and Onishi1984; Kim & Mifflin Reference Kim and Mifflin1985). For a pair of equal-sized spheres (
 $\kappa =1$) in simple shear flow, the
 $O(St)$ dimensionless trajectory equations form the following autonomous system:
 \begin{align} \frac{{\rm d}r}{{\rm d}\phi} &= \frac{r(1-A) \sin^2\theta\sin\phi\cos\phi + St \,f_2(r,\theta,\phi)} {-\left[\sin^2\phi + \frac{1}{2} B \left(\cos^2\phi - \sin^2\phi \right) \right] + St\,f_1(r,\theta,\phi)/{\sin\theta}}, \end{align}
 \begin{align} \frac{{\rm d}\theta}{{\rm d}\phi} &= \frac{(1-B) \sin\theta\cos\theta\sin\phi\cos\phi + St \, f_3(r,\theta,\phi)}{-\left[\sin^2\phi + \frac{1}{2} B \left(\cos^2\phi - \sin^2\phi \right) \right] + St \, f_1(r,\theta,\phi)/{\sin\theta}}, \end{align}
where
 \begin{align} f_1(r,\theta,\phi) &={-}H
\sin^2\theta \sin\phi \cos\phi
\left[\left\{2B(A-B)-r(1-A)\,\frac{{\rm d}B}{{\rm
d}r}\right\} \sin\theta\,\frac{\cos^2\phi -
\sin^2\phi }{2} \right. \nonumber\\ &\left.\quad
{}+2(A-B)\sin\theta\sin^2\phi \vphantom{\left[\left\{2B(A-B)-r(1-A)\,\frac{{\rm d}B}{{\rm
d}r}\right\} \sin\theta\,\frac{\cos^2\phi -
\sin^2\phi }{2} \right.}\right] - \frac{6E}{5r}
\sin\theta \sin\phi \cos\phi
\left[\sin^2\theta\,\frac{\cos^2\phi -
\sin^2\phi }{2} \right. \nonumber\\ &\left.\quad {}\times
\left\{r(1-A)\,\frac{{\rm d}C}{{\rm d}r} + 2C(B-1)\right\}
+ \frac{C}{2}(1 +
\sin^2\theta)\vphantom{\left[\left\{2B(A-B)-r(1-A)\,\frac{{\rm d}B}{{\rm
d}r}\right\} \sin\theta\,\frac{\cos^2\phi -
\sin^2\phi }{2} \right.}\right],
\end{align}
 \begin{align} f_2(r,\theta,\phi) &={-}r G \left[\sin^4\theta \sin^2\phi \cos^2\phi \left\{(A-B)^2 - r(1-A)\,\frac{{\rm d}A}{{\rm d}r}\right\}\right. \nonumber\\ &\left.\quad {}+ \frac{B-2A}{2} \sin^2\theta\sin^2\phi - \frac{B}{2}\sin^2\theta\cos^2\phi - \frac{B(B-2A)}{4} \sin^2\theta \right], \end{align}
 \begin{align} f_3(r,\theta,\phi) &={-}H
\sin\theta \cos\theta \left[\frac{B(B-2)}{4} + \sin^2\theta
\sin^2\phi \cos^2\phi \left\{\vphantom{\left.\left. -r(1-A)\,\frac{{\rm
d}B}{{\rm d}r}\right\}\right]} 2(B-1)(A-B)\right. \right.
\nonumber\\ &\quad \left.\left. -r(1-A)\,\frac{{\rm
d}B}{{\rm d}r}\right\}\right] - \frac{6E}{5r} \sin\theta
\cos\theta \left[\vphantom{\left.\left. -r(1-A)\,\frac{{\rm
d}B}{{\rm d}r}\right\}\right]} \sin^2\theta \sin^2\phi \cos^2\phi\right.
\nonumber\\ &\left.\quad {}\times \left\{r(1-A)\,\frac{{\rm
d}C}{{\rm d}r} + 2C(B-1)\right\} +
\frac{C}{4}\,(2\sin^2\phi - B)\right].
\end{align}
Here,  $r \sin \theta \,f_1$ and
 $r\,f_3$, respectively, represent the
 $O(St)$ corrections of azimuthal and polar components of the angular velocity, while
 $f_2$ is the
 $O(St)$ correction to the radial velocity. Like the previous case, we calculate relative trajectories by integrating numerically the system (5.4)–(5.5).
The inertial modifications of  $St=0$ relative trajectories are discussed in detail by Subramanian & Brady (Reference Subramanian and Brady2006), who assumed continuum hydrodynamic interactions between the particles for all separations. They found that in-plane open trajectories with
 $St \neq 0$ suffer a net negative displacement in the gradient direction far downstream, leading to shear-induced diffusion. They also reported that
 $St=0$ closed trajectories give way to
 $St \neq 0$ spiralling trajectories, and there exists a stable limit cycle very close to the contact surface. The finite inertia pair trajectory topology is visible in figure 18(a), highlighting the presence of trajectories spiralling both outwards and inwards to the limit cycle. Figures 18(b,c) show the in-plane pair trajectories when both non-continuum hydrodynamic interactions and particle inertia act together. We have seen that there would exist no colliding trajectories for
 $St=0$ when
 $Kn< Kn_c$. We have also noted the presence of spiralling trajectories when we include the effects of particle inertia in continuum hydrodynamics,
 $St\neq 0$ and
 $Kn=0$. Though no collision trajectories exist in the above two situations treated individually, the combined scenario of non-continuum physics and particle inertia introduces spiralling colliding trajectories, as can be seen in figure 18(b). For
 $Kn>Kn_c$, the in-plane trajectories appear qualitatively similar to their
 $St=0$ counterpart – families of open, colliding and semi-closed trajectories as shown in figure 4(b).
In-plane relative trajectories for  $St=0.1$ and (a)
 $Kn=0$, (b)
 $Kn = 10^{-5}$, and (c)
 $Kn = 10^{-1}$. Colour schemes for the open, colliding and semi-closed trajectories are the same as earlier. In (a), green and grey lines are inward and outward spiraling trajectories, and the yellow line is the limit cycle.

The inertial off-plane continuum trajectories are fore–aft asymmetric, like their in-plane counterparts, and suffer net transverse displacements in the gradient ( $\bar {x}_2$) and vorticity (
 $\bar {x}_3$) directions. The off-plane closed trajectories can undergo two finite inertia modifications, either spiralling outwards to infinity (
 $\bar {x}_1\rightarrow \infty$) in a plane parallel to the shearing plane, or spiralling inwards and approaching the in-plane limit cycle. In figure 19, we show the fate of an off-plane inward spiralling trajectory with the inclusion of non-continuum lubrication effects. For
 $Kn< Kn_c$, the first few circuits around the collision sphere are identical to the continuum trajectory. Once the spiral approaches the lubrication region, non-continuum effects induce a collision (see figure 19b). For larger values of
 $Kn$, the off-plane trajectory collides before spiralling can occur (see figure 19c).
An off-plane spiralling trajectory for  $St=0.1$ and (a)
 $Kn=0$, (b)
 $Kn=10^{-5}$, and (c)
 $Kn=10^{-1}$.

Our objective is to calculate the collision efficiency, thus we determine the upstream interception area using a methodology identical to that described in earlier sections. In the absence of interparticle forces, collisions can occur only on the front side of the hemisphere. We calculate the limiting trajectories by backward integration starting from an initial condition very close to  $r=2$ and
 $\phi ={\rm \pi} /2$, and by varying the initial condition of
 $\theta$ from
 $0$ to
 ${\rm \pi} /2$. As in the inertialess non-continuum case, the upstream interception area for
 $St \neq 0$ is also a circle. For
 $Kn=0$, Subramanian & Brady (Reference Subramanian and Brady2006) found that the zero Stokes in-plane separatrix suffers negative displacement in the gradient direction – it has zero offset as
 $\bar {x}_1\rightarrow \infty$, and has an
 $O(St^{1/2})$ offset as
 $\bar {x}_1\rightarrow -\infty$. Our numerical calculations with non-continuum hydrodynamics show that the limiting colliding trajectory gets displaced by
 $O(St^{1/2})$. Thus the enhancement due to particle inertia should be
 $O(St)$, which is visible in figure 20(a). Figure 20(b) confirms our earlier observations from trajectory analysis that collisions can occur for
 $Kn< Kn_c$ for
 $St\neq 0$.
Variation of collision efficiency with (a)  $St$ and (b)
 $Kn$.

The above analysis revealed that the first effect of particle inertia is to enhance the collision efficiency of a pair of spheres in simple shear flow, interacting via non-continuum hydrodynamics. Similar enhancement of collisions due to particle inertia has also been seen in differentially sedimenting spheres in a quiescent fluid with van der Waals interactions (see Davis Reference Davis1984). The current analysis is valid in the  $St \ll 1$ regime, and a detailed collision study with the arbitrary
 $St$ equations will be conducted in a future study where we will need to include the non-continuum tangential lubrication forces derived recently by Li Sing How, Koch & Collins (Reference Li Sing How, Koch and Collins2021).
6. Summary and conclusions
In their pioneering study, Batchelor & Green (Reference Batchelor and Green1972a) provided a comprehensive picture of pair trajectories for inertialess spheres in the continuum limit. Our study revisited this classical study and explained the collision dynamics of small solid/liquid spherical particles in gaseous media subjected to a simple shear flow, incorporating various physics that enable collision. We confined our attention to dilute suspensions, thus pairwise interactions between the particles served the purpose. The continuum assumption of hydrodynamic interactions fails at close separations. The near-field non-continuum interactions become the dominant mechanism for particle collisions in media with long mean free paths, like low-pressure gases. The importance of non-continuum lubrication interactions on collisions in gaseous media has limited treatment in the existing literature. This study has considered the appropriate expressions for non-continuum lubrication forces between two spheres derived by Sundararajakumar & Koch (Reference Sundararajakumar and Koch1996). We have used the uniformly valid axisymmetric mobility functions that capture non-continuum lubrication at close separations, and full continuum hydrodynamic interactions at moderate to large separations. We have determined collision efficiencies in a simple shear field using trajectory analysis, both with and without van der Waals force. The present study is also the first to predict the collision efficiency for the coupled system, where gravity acts along the simple shear flow axis. We have also reported the role of small but finite particle inertia on collision efficiency for a particle pair interacting through non-continuum hydrodynamics in a simple shear flow.
In § 2, we have formulated the basic problem for systems with zero inertia (i.e.  $Re_p=0$ and
 $St=0$). The relative velocity between a pair of inertialess spheres due to the combined effects of background shear, van der Waals attractions, and differential sedimentation has been expressed through relevant mobility functions that capture the hydrodynamic and interparticle interactions. We have used the mean radius of the two spheres, the inverse of the shearing rate, and the mean radius times the shearing rate as the characteristic length, time and velocity scales to obtain the non-dimensional relative velocity and trajectory equations in spherical coordinates. These non-dimensional equations contain two dimensionless quantities called
 $Q$ and
 $N_F$. The parameter
 $Q$ represents the relative strength of gravity to the simple shear flow, and
 $N_F$ measures the relative importance of imposed shear to the van der Waals interactions. The non-dimensional collision rate equation is expressed as a surface integral over the collision sphere with the integrand involving relative velocity and the pair probability at contact. We have determined the collision rate by calculating the upstream interception area using trajectory analysis.
We have presented the variation of the ideal collision rates as a function of  $Q$ in figure 3. The collision rate asymptotes to the ideal collision rate due to simple shear flow alone and pure differential sedimentation in the
 $Q\ll 1$ and
 $\gg 1$ limits, respectively. For intermediate values of
 $Q$, the collision rate deviates from a linear combination of the collision rates resulting from these two driving forces. The ideal collision rate calculation for a non-zero angle between the flow axis and gravity might be a potential future work, and it will certainly reveal many interesting collision dynamics.
Sections 4.1 and 4.2 provide a map of pair trajectories and collision efficiencies for non-continuum lubrication interactions in a simple shear flow with and without van der Waals forces. We have seen that the collision efficiency between two spheres interacting through non-continuum hydrodynamics in a simple shear flow is non-zero, even without attractive forces. In the absence of van der Waals interactions, the collision efficiency decreases as  $Kn$ decreases, and it becomes zero when
 $Kn$ is less than a critical value
 $Kn_c$. This behaviour is in contrast to an earlier study (Dhanasekaran et al. Reference Dhanasekaran, Roy and Koch2021a) of particle pair interactions in a uniaxial compressional flow where the collision rate vanishes only in the
 $Kn\rightarrow 0$ limit. The absence of
 $Kn_c$ is due to the different pair trajectory topology in the continuum limit. Uniaxial compressional flow has open pair trajectories, while simple shear flow has open and closed pair trajectories. However, the collision efficiencies for either linear flow are non-zero for any
 $Kn$ in the presence of van der Waals forces. In fact, for a simple shear flow with
 $Kn< Kn_c$, van der Waals interactions predominantly drive the collision dynamics. As
 $Kn\rightarrow 0$, collision efficiency asymptotes to the value corresponding to the collision efficiency with van der Waals force while particles interact through continuum hydrodynamics. Figure 12 gives results in dimensional form for a case that one might consider experimentally.
Collision rates and collision efficiencies for gravity coupled with the simple shear flow are presented in § 4.3. We have seen in figure 15(a) that the normalized collision rate increases with  $Q$. At small values of
 $Q$, simple shear flow contributes almost singly to the collision rate, and gravity drives the collision dynamics at large values of
 $Q$. The transition from the simple shear flow dominated regime to the gravity dominated regime occurs at
 $Q \approx 6$, while the same for the ideal collision rate occurs at
 $Q \approx 2$. Collision efficiencies for the same sets of values of
 $Kn$ and
 $\kappa$ are shown in figure 15(b). For a given
 $Kn$ and
 $\kappa$, the collision efficiency approaches the highest value when
 $Q\rightarrow 0$, and then decreases monotonically with increasing
 $Q$. It is evident from figure 15(b) that the relative thickness of the non-continuum layer decreases as
 $Kn$ decreases, which leads to retardation in the collision process. We have also reported a few results for collision efficiencies when all four factors (background shear flow, gravity, non-continuum lubrication interactions and van der Waals force) are in play (see figures 16 and 17). The present study corresponds to vertical pipe flows of suspensions (such as in risers), where the angle between the simple shear flow axis and the gravity direction is zero. One can extend this study to inclined pipe flows to explore interesting collision dynamics for non-zero angles between the flow axis and gravity.
In § 5, we investigated the effects of small but finite particle inertia on collision efficiencies for particles interacting through non-continuum hydrodynamics in a simple shear flow. The  $O(St)$ modifications of the relative trajectories are presented in figures 18 and 19. Particle inertia breaks the fore–aft symmetry of relative trajectories, and open trajectories suffer a net displacement in the gradient direction. We determined the collision efficiency as a function of
 $St$ and
 $Kn$. We have seen that the efficiency increases linearly with Stokes number following the
 $O(St^{-1/2})$ displacement of the limiting colliding trajectory (see figure 20). The Stokes number
 $St$ based on sedimentation velocity is not small for
 $a_1>10\,\mathrm {\mu }{\rm m}$. Thus particle inertia will play an important role in particle collisions. To date, there are no theoretical predictions of collision efficiencies for inertial particles due to the coupled effect of background shear, gravity and interparticle interactions. Therefore, the current study will serve as an initial calculation against which to compare future analyses with inertial effects.
The outcomes of the present study will be helpful to the successful design of equipment where a simple shear flow drives collisions between particles interacting through non-continuum hydrodynamics. A better knowledge of the collision process might improve the prediction of the particle size distribution at the outlet of various pneumatic conveying devices operating at low pressure. The mean free paths for low-pressure gases are long; thus non-continuum lubrication forces will play a dominant role in collisions. An improved understanding of the collision dynamics in porous aerosol filters will aid in promoting the aggregation of pollutants to form larger aggregates that can be filtered easily. A better understanding of the collision process can reduce errors in measuring aerosol size distribution in aerosol impactors. Our study is also applicable where collisions are driven by the combined effects of gravity and a simple shearing flow, for example, in laminar flows of suspensions through vertical pipes or channels. Another application of the simple shear calculation might be coalescence or coagulation in turbulent pipe or channel flows at a moderate Reynolds number where the mean shear rate is higher than the Kolmogorov shear rate. Some of the subtle features of the simple shear flow, like the perfectly closed trajectories, would be lost in the turbulent flow. Still, some general trends and rough estimates are probably applicable. To compare our results, one could estimate the coalescence rate in a turbulent pipe or channel flow from experimental measurements or direct numerical simulations.
Acknowledgements
P.P. would like to thank Dr J. Dhanasekaran for providing valuable assistance with his calculations. The authors acknowledge support from IIT Madras for its support of the ‘Laboratory for Atmospheric and Climate Sciences’ research initiative under the Institute of Eminence framework.
Funding
P.P. would like to acknowledge the financial support from the Prime Minister's Research Fellows (PMRF) scheme, Ministry of Education, Government of India (project no. SB22230184AMPMRF008746).
Declaration of interests
The authors report no conflict of interest.


 Open access

