INTRODUCTION
Maximizing the efficiency and productivity of dairy production systems is no longer the only aim of dairy systems at the farm scale: limiting farming impacts on the environment (Rotz et al. Reference Rotz, Mertens, Buckmaster, Allen and Harrison1999), reducing production costs and achieving better feed self-sufficiency (Bocquier & González-García Reference Bocquier and González-García2009; Delaby et al. Reference Delaby, Faverdin, Michel, Disenhaus and Peyraud2009), and improving farmer working conditions (Bernuès et al. Reference Bernuès, Ruiz, Olaizola, Villalba and Casasus2011) are further goals. Diet composition recommendations must fit these different objectives, and animal responses to different diets must be known (milk yields, body condition score and live weight evolution, etc.). In addition, feed supply management is a major component of the farming system, but it depends on the farmer's strategies, and on the production capacities of other elements of the farming system, such as grassland and forage systems. The quality of harvested forages varies from 1 year to another, and grass availability and quality fluctuate during the grazing season. As a result, the energy supply from diets during the winter or grazing periods does not always match animal requirements. These requirements depend on the physiological status of the dairy cows (lactation stage, growth and pregnancy), potential milk yield, and calving period and its distribution. For example, some farming systems, such as dairy systems based only on grazed grass, rely on optimized conversion of grass to milk by matching the period of high requirements with the grass-growing season through early spring calving (Dillon et al. Reference Dillon, Crosse, Stakelum and Flynn1995; McCall & Clark Reference McCall and Clark1999; García & Holmes Reference García and Holmes2001).
A modelling approach can give a representation of the complex relationships between cattle, pasture and farmers’ strategies within dairy production systems. They can also provide an assessment of the impacts of changes of farming system components, especially on animal performance. Models cited in the literature predict feed intake and animal performance for dairy cattle according to their requirements (Rotz et al. Reference Rotz, Mertens, Buckmaster, Allen and Harrison1999) or assess the farming system with technical, environmental and financial variables such as milk production, concentrate intakes and nutrient cycling (Schils et al. Reference Schils, de Haan, Hemmer, van den Pol-van Dasselaar, De Boer, Evers, Holshof, van Middelkoop and Zom2007; Vayssières et al. Reference Vayssières, Guerrin, Paillat and Lecomte2009). Many models focus on dairy production in grazing systems to study different farmer's strategies (Cros et al. Reference Cros, Duru, Garcia, Grasset, Legall, Martin-Clouaire, Peyre, Delaby, Fiorelli and Peyraud2000) to help decision support systems (Delaby et al. Reference Delaby, Peyraud and Faverdin2001). Other grazing system models predict herbage intake and milk production (Delagarde et al. Reference Delagarde, Faverdin, Baratte and Peyraud2011a, Reference Delagarde, Valk, Mayne, Rook, González-Rodríguez, Baratte, Faverdin and Peyraudb; Faverdin et al. Reference Faverdin, Baratte, Delagarde and Peyraud2011; Baudracco et al. Reference Baudracco, Lopez-Villalobos, Holmes, Comeron, Macdonald, Barry and Friggens2012), or variation of live weight and body condition score of dairy cows at the end of the grazing season (Beukes et al. Reference Beukes, Palliser, Macdonald, Lancaster, Levy, Thorrold and Wastney2008; Baudracco et al. Reference Baudracco, Lopez-Villalobos, Holmes, Comeron, Macdonald, Barry and Friggens2012). A few models integrate, at the animal scale, animal responses over the indoor (or winter) and grazing periods according to variations in feeds offered (harvested forages, grass growth or supplementation) such as the MELODIE model (Chardon et al. Reference Chardon, Rigolot, Baratte, Espagnol, Raison, Martin-Clouaire, Rellier, Le Gall, Dourmad, Piquemal, Leterme, Paillat, Delaby, Garcia, Peyraud, Poupa, Morvan and Faverdin2012), which focuses on the dynamics of nutrient flow in dairy farms with crops. Nonetheless, the MELODIE model does not take into account day-to-day variation in energy supplied by the diet to predict milk production since MELODIE gives an average prediction of milk yield per day for a paddock.
The current study presents a dynamic model of intake and milk production, capable of modelling the response to variations in a grass-based diet during grazing periods as well as indoors. The objective was to develop a model capable of coping with day-to-day variations in grass availability and quality at pasture as well as with a constant feeding regime offered indoors based on grass forages in winter. This new model is a centrepiece of a whole grass-based dairy farm simulator, Dynamilk (Jacquot et al. Reference Jacquot, Baumont and Brunschwig2012) which represents the interaction between sward structure and animal intake at the herd-scale. The model is simple and connectable to the outputs of a grass growth model (Jouven et al. Reference Jouven, Carrère and Baumont2006a), dairy herd demographic model and a farmer's management model (Jacquot et al. Reference Jacquot, Baumont and Brunschwig2012). The current paper presents and discusses the conceptual basis and the equations of the model, and its evaluation, including validation against experimental data and analysis of response to the main inputs, namely the milk potential of the cows, forage quality, supply of concentrate and stocking rate at grazing.
MATERIALS AND METHODS
Model description
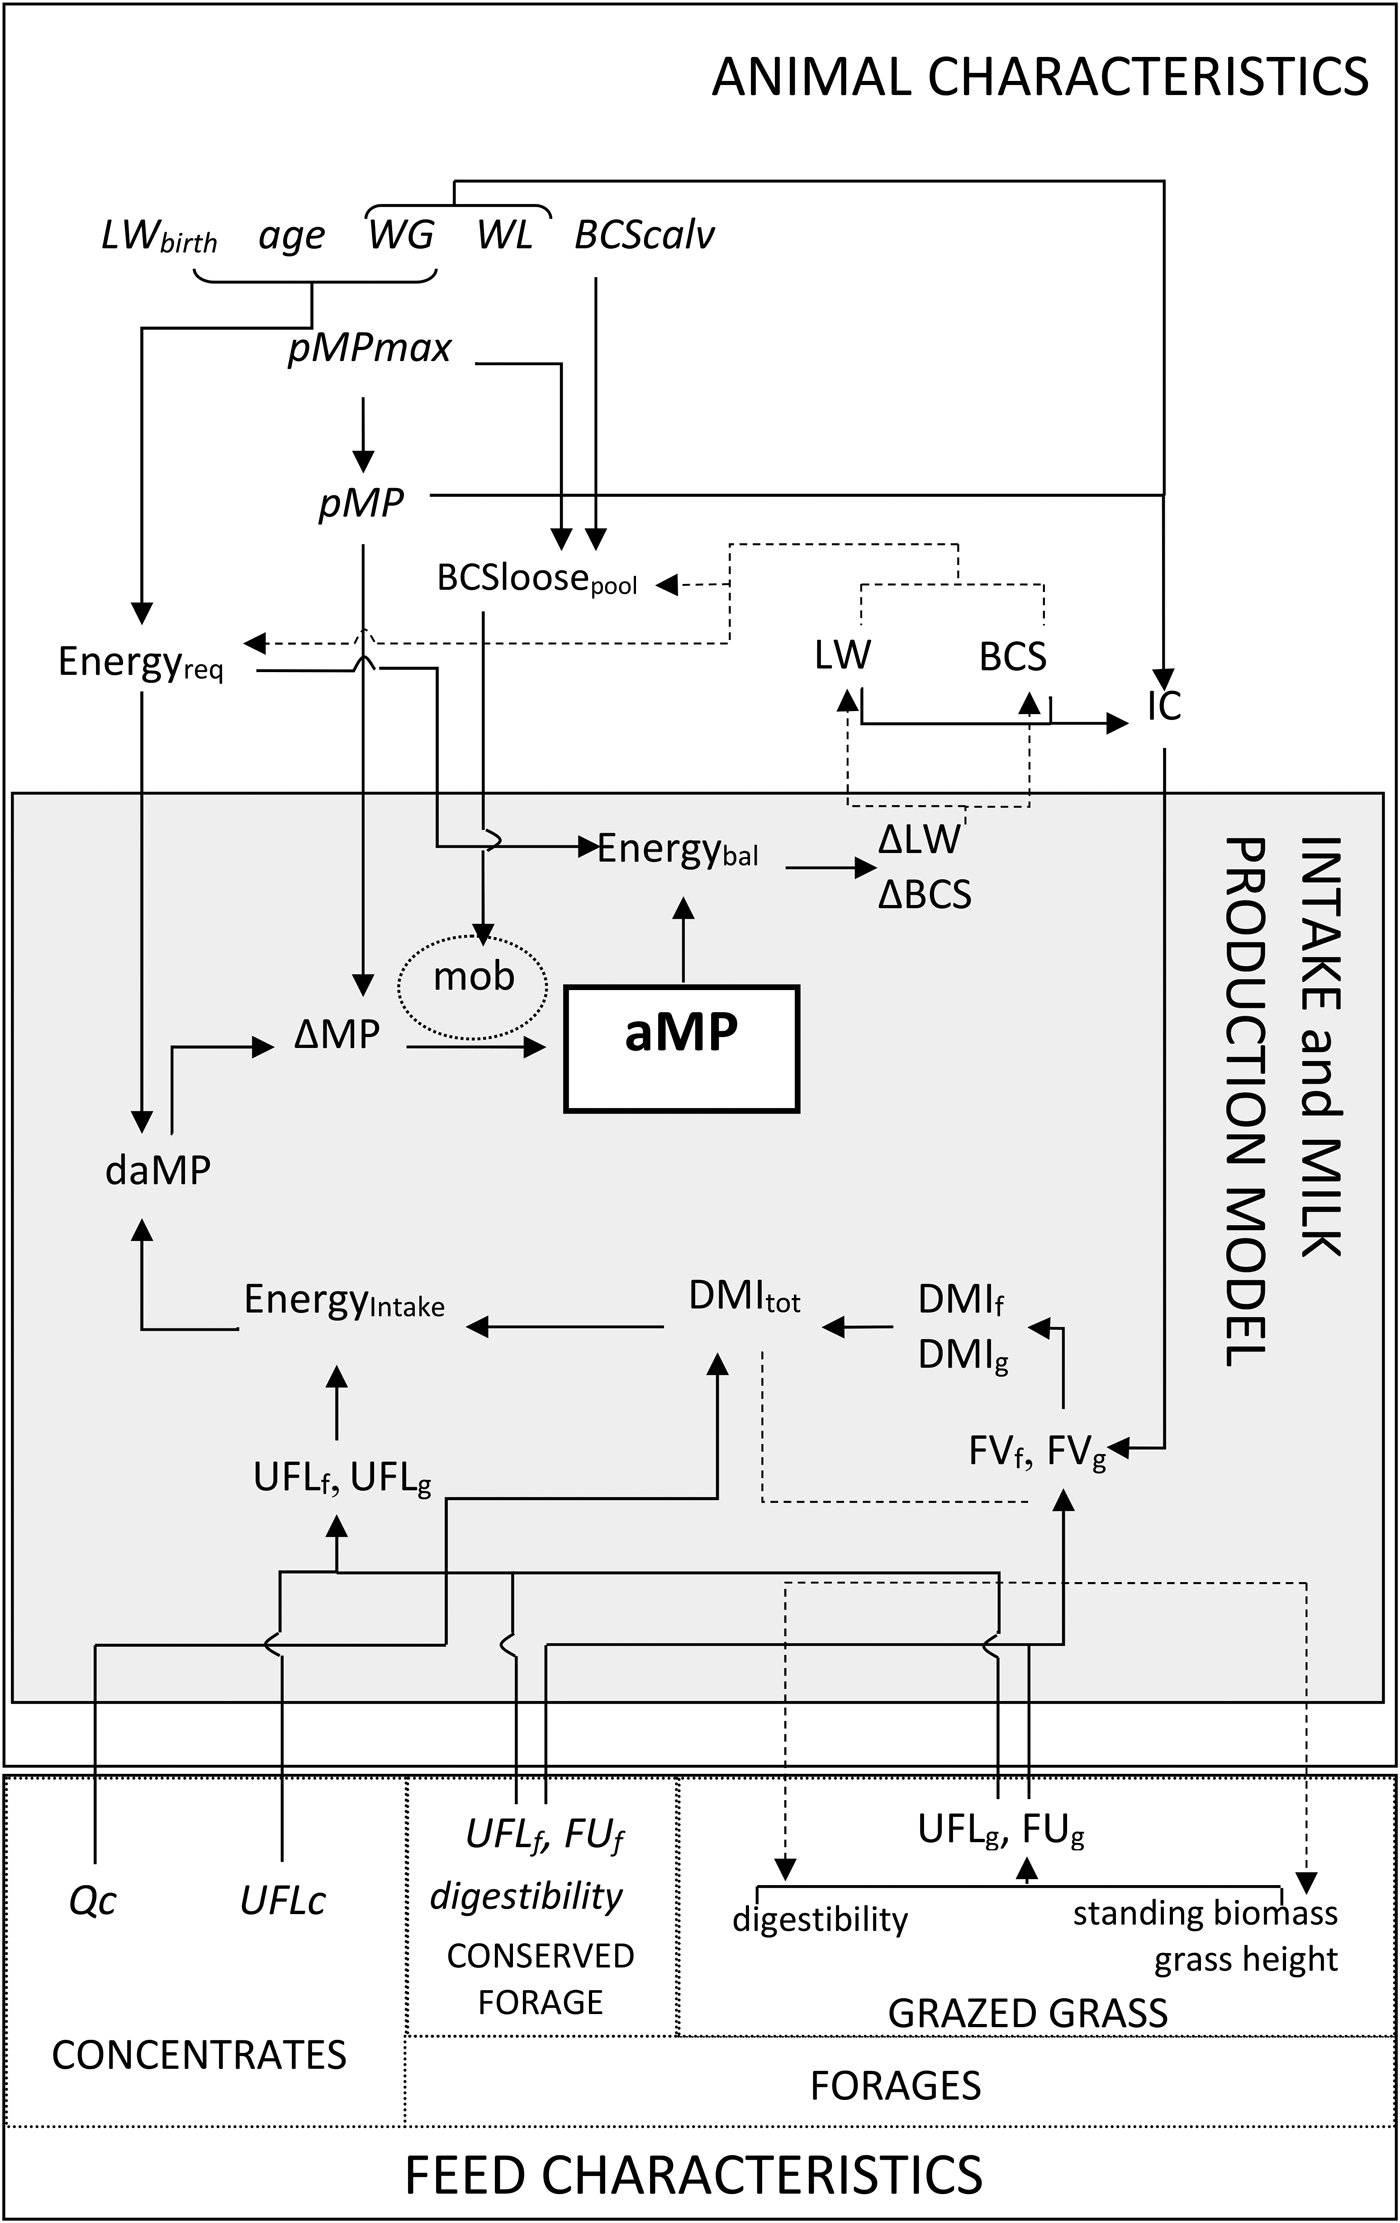
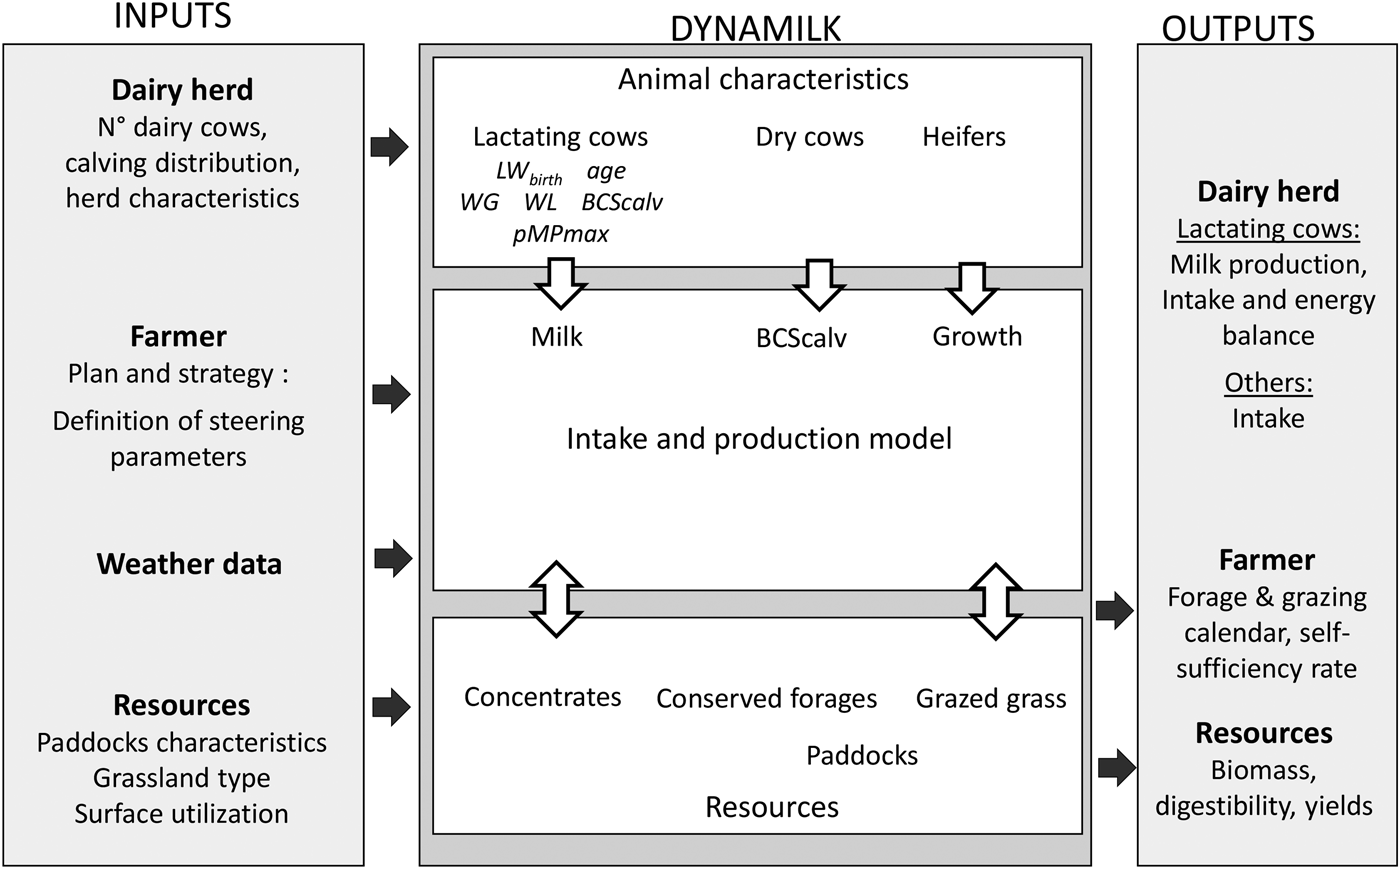
The dynamic intake and milk production model (Fig. 1, Table 1) is part of a dynamic farm model (Fig. 2), Dynamilk (Jacquot et al. Reference Jacquot, Baumont and Brunschwig2012), which also includes (i) a dairy herd demographic structure sub-model, which generates the demographic structure of dairy cattle through a preset calving distribution; (ii) a grass growth sub-model already published and validated (Jouven et al. Reference Jouven, Carrère and Baumont2006a, Reference Jouven, Carrère and Baumontb), which simulates biomass and its digestibility according to sward botanical composition, weather conditions and practices on paddocks (cutting or grazing, the amount of grass ingested by animals linked to their needs and their production); and (iii) farmer's management and decision sub-model, which governs the main practices with mowing, forage stores, diet composition at grazing and wintering and grazing management. Grazing is managed according to a simplified rotational grazing technique (Hoden et al. Reference Hoden, Peyraud, Muller, Delaby, Faverdin, Peccatte and Fargetton1991) which consists of sub-dividing grazing parcels into small paddocks. Animals graze with a high-density rate for a short duration on a paddock before being moved on to another paddock. The date of change of paddock corresponds to a drop of 10% in milk output compared to the peak reached on a paddock.
Architecture and functioning of dynamic intake and milk production model interacting with herd and feed characteristics. Solid arrows show interactions between variables to calculate biomass and energy flows on Day d, and dotted arrows show feedback effects on sward and animal characteristics on Day d + 1. Mob component indicates body reserve mobilization mechanisms during the first part of lactation.

Architecture of Dynamilk model Jacquot et al. (Reference Jacquot, Baumont and Brunschwig2012) with inputs and outputs.
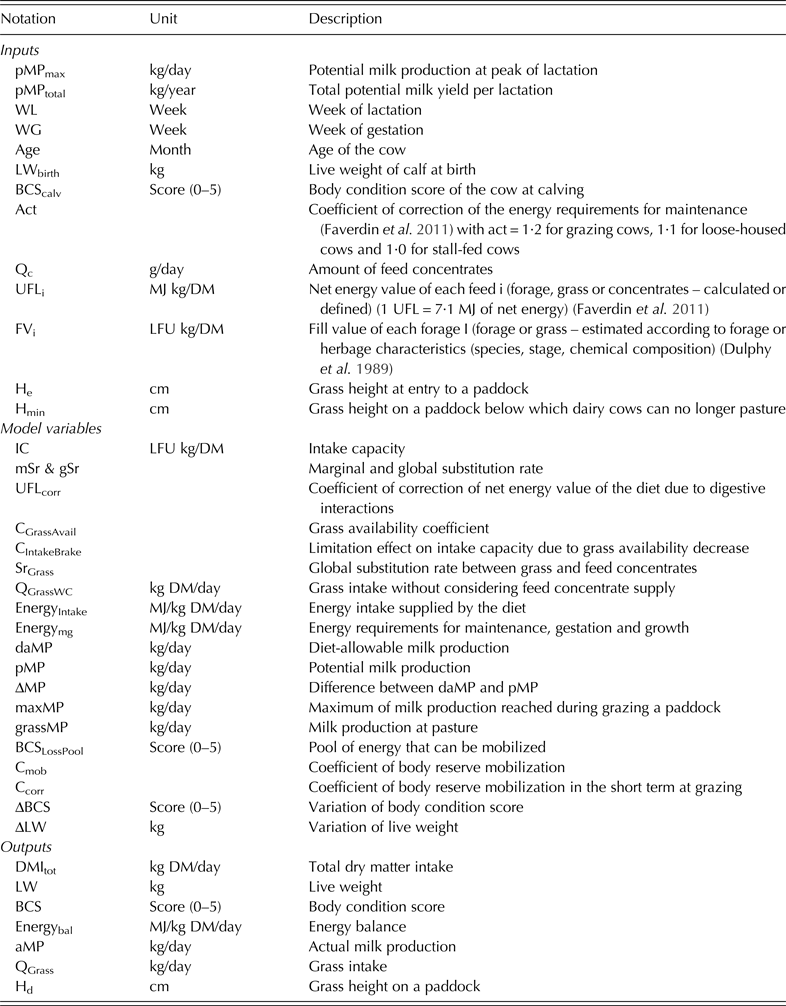
Definition of the variables used in the intake and milk production model
As shown in Fig. 2, the dynamic model of intake and milk production enables the three sub-models to be linked by calculating, at a daily time step, animal intake depending on animal intake capacity and feed offered during indoor or grazing feeding periods. Intake capacity of the lactating cow is determined by its characteristics (live weight, body condition score), its potential milk production and its week of lactation. Feed offered depends on feed characteristics (available amounts and digestibility) related to forage management and feeding strategy.
Conceptual framework
In order to take into account day-to-day variations of feed offer, the entire conceptual framework of this model relies on the theory that milk production is modelled as a result of the energy requirements defined by potential milk production, the variation of energy supplied by the diet, and the ability of dairy cows to mobilize or store body reserves (Coulon & Rémond Reference Coulon and Rémond1991; Friggens & Newbold Reference Friggens and Newbold2007; Martin & Sauvant Reference Martin and Sauvant2010a, Reference Martin and Sauvantb). The mathematical description of major mechanisms of intake is mainly built according to the model developed by INRA (Delagarde et al. Reference Delagarde, Faverdin, Baratte and Peyraud2011a; Faverdin et al. Reference Faverdin, Baratte, Delagarde and Peyraud2011). However, in contrast to the INRA model used for diet composition recommendations, dairy cows are fed in the current model according to the feed supply provided from the farm. In other words, the energy supply does not necessarily meet potential requirements. As a consequence, the milk production model includes mechanisms of body reserve mobilization during the first weeks of lactation. During the first week post-partum, even if the energy offered by the diet is sufficient, the intake capacity of animals does not allow energy intake to reach animal requirements, owing to intense milk production (Chilliard et al. Reference Chilliard, Remond, Agabriel, Robelin and Verite1987; Reist et al. Reference Reist, Erdin, von Euw, Tschuemperlin, Leuenberger, Chilliard, Hammon, Morel, Philipona, Zbinden, Kuenzi and Blum2002). The energy deficit is covered by body reserve mobilization triggered by homeorhetic regulation, dispatching energy towards mammary tissue to sustain milk yield (Coulon & Rémond Reference Coulon and Rémond1991; Friggens & Newbold Reference Friggens and Newbold2007; Gross et al. Reference Gross, van Dorland, Bruckmaier and Schwarz2011). At the same time as a gradual increase in intake capacity (Chilliard et al. Reference Chilliard, Remond, Agabriel, Robelin and Verite1987), the ability to mobilize body reserves decreases over the weeks of lactation and metabolic priority towards mammary tissue fades out to restore homeostatic balance (Coulon & Rémond Reference Coulon and Rémond1991; Gross et al. Reference Gross, van Dorland, Bruckmaier and Schwarz2011). This transition occurs between 1·5 and 3 months post-partum (Buttchereit et al. Reference Buttchereit, Stamer, Junge and Thaller2010; Gross et al. Reference Gross, van Dorland, Bruckmaier and Schwarz2011). During the second part of lactation, defined as after the 12th week of lactation, the model assumes that animals can no longer mobilize their body reserves. In the case of energy deficit due to a poor quality diet (shortage of grass at grazing for example), dairy cows adapt in the short term to maintain their homoeostatic equilibrium by decreasing milk yield and by varying body condition (Coulon & Rémond Reference Coulon and Rémond1991; Delaby et al. Reference Delaby, Faverdin, Michel, Disenhaus and Peyraud2009; Gross et al. Reference Gross, van Dorland, Bruckmaier and Schwarz2011) the opposite is the case when a high-quality diet is offered.
Unlike indoor feeding, which is characterized by a constant diet fed day to day, intake at grazing fluctuates from 1 day to the next. This fluctuation is due to grass growth and grazing management, in particular for a rotational grazing system during the depletion of a paddock as described by Hoden et al. (Reference Hoden, Peyraud, Muller, Delaby, Faverdin, Peccatte and Fargetton1991). Thus, herbage intake depends on the biomass offered and sward structure, and so energy intake varies from day to day and the animal's needs are not always met. As a result, dairy cows draw on their buffering capacity through mobilization and reconstitution of their body reserves in the short term. Despite this buffering action, a discrepancy between actual milk production and expected production may occur. To sum up, the current model relies on the idea that milk production depends on energy supplied from diets and body reserves.
Feed characteristics
Three types of feed are considered: grazed grass, harvested forages with grass silage and/or hay and concentrates. The diet is made up of (i) concentrate and forages, consisting of a mix of first and second cut grass silage or hay in a preset proportion (input of model) during the winter period; and (ii) concentrate and grazed grass during the grazing period.
Grazed grass and harvested forages are described by their feed digestibility, energy (feed unit for lactation, with 1 UFL equal to 7·106 MJ) and fill unit values (FV) (Dulphy et al. Reference Dulphy, Faverdin, Jarrige and Jarrige1989; Baumont et al. Reference Baumont, Dulphy, Sauvant, Meschy, Aufrère, Peyraud and Agabriel2007; Faverdin et al. Reference Faverdin, Baratte, Delagarde and Peyraud2011). The FV of each type of forage eaten depends on forage characteristics alone (species, stage of maturity and chemical composition) and is an inverse function of its voluntary intake (Faverdin et al. Reference Faverdin, Baratte, Delagarde and Peyraud2011). Calculation of the daily amount of concentrate fed depends on the lactation status of the animal with its week of lactation and its daily potential milk production all of which are driven by a preset total amount of concentrate per year and per animal (input of model). As shown in Figs 1 and 2, forages with varying yearly feed values and quantities are provided by another sub-model of Dynamilk. Grazed grass feed values are provided by a grass growth model and depend on sward structure, botanical composition, time and weather conditions, interaction with animals and grazing management.
Animal characteristics
It has been considered that dairy cows are defined by some characteristics representing their productive theoretical potential: potential milk production, intake capacity, energy requirements for maintenance, growth and pregnancy and the ability of the animal to mobilize body reserves in early lactation. These characteristics are dependent on when lactation starts (calving date), a conceptual genetic potential milk production, called total potential milk yield per lactation (pMPtotal, kg/year) and body condition score at calving (BCScalv).
Knowing pMPtotal and animal parity, potential milk production at the peak of lactation (pMPmax, kg/day) can be calculated:
 $$pM{P_{max}}\, = \,a \times pM{P_{total}}$$
with different parameters for primiparous or multiparous cows, a = 0·0038 for primiparous and a = 0·0045 for multiparous (Faverdin et al. Reference Faverdin, Delagarde, Delaby, Meschy and Agabriel2010).
From pMPmax, Faverdin et al. (Reference Faverdin, Delagarde, Delaby, Meschy and Agabriel2010) defined the calculation of the concept of potential milk production (pMP, kg/day). During lactation, pMP represents a potential or a theoretical milk production curve for a balanced diet. Week of lactation (WL) and week of gestation (WG) are determined from calving date.
Multiparous:
 $$pMP\, = \,pM{P_{max}} \times \{ 1 {\cdot} 047 - (0 {\cdot} 69 \times {e^{ - 0.90 \times WL}})\, - \,(0 {\cdot} 0127 \times WL)\, - \,(0 {\cdot} 50 \times {e^{ - 0.12 \times (45 - WG)}})\}$$
Primiparous:
 $$pMP\, = \,pM{P_{max}} \times \{ 1 {\cdot} 084 - (0 {\cdot} 7 \times {e^{ - 0.46 \times WL}})\, - \,(0 {\cdot} 009 \times WL) - (0 {\cdot} 69 \times {e^{ - 0.16 \times (45 - WG)}})\}$$
From the pMP curve, intake capacity of the animals can be calculated based on Faverdin et al. (Reference Faverdin, Baratte, Delagarde and Peyraud2011) who showed that the animal's IC depends on three main factors: animal's LW (kg) and BCS (score 0–5) and pMP (kg/day), corrected by three non-dimensional indices. These indices enable the user to consider changes in the IC due to the age (age, in months) and physiological state of the animal (week of lactation, WL and week of gestation, WG). For instance, IL facilitates the effect of digestive capacities and body reserve mobilization in early lactation to be modelled.
 $$\eqalign{IC &= \{13 \cdot 9 + (0 \cdot 015 \times (LW - 600)) \cr &\quad + (0 \cdot 15 \times pMP ) + (1 \cdot 5 \times (3 - BCS ))\} \cr &\quad \times IL \times IG \times IM}$$
The three indices IL, IG and IM, were defined by Faverdin et al. (Reference Faverdin, Baratte, Delagarde and Peyraud2011):
 $$IL\, = \,a + (1 - a) \times (1 - \; {e^{ - 0.22 \times WL}})$$
with a = 0·43 for primiparous and a = 0·6 for multiparous cows.
 $$IG\, = \,0 {\cdot} 8 + 0 {\cdot} 2\; \times (1 - {e^{ - 0.25 \times (40 - WG)}})$$
 $$IM\, = \,\; - 0 {\cdot} 1 + 1 {\cdot} 1\; \times (1 - \; {e^{ - 0.08 \times age}})$$
Energy requirements for maintenance, pregnancy and growth needs, since the animal is younger than 40 months (Energymg, MJ/day) were calculated with the following equation (Faverdin et al. Reference Faverdin, Baratte, Delagarde and Peyraud2011):
 $$Energ{y_{mg}}\, = \,\; [\{ (0 {\cdot} 041 \times L{W^{0.75}}) \times act\} + \{ 3 {\cdot} 25 - (0 {\cdot} 08 \times age)\} + (0 {\cdot} 00072 \times L{W_{birth}} \times {e^{0.116 \times WG}})] \times 7 {\cdot} 106$$
Maintenance requirements include consideration of whether animals are at pasture or are indoors through an activity coefficient (act). For instance, indoors, maintenance requirements are not changed in the case of a stanchion stable system, also called a tie-up cowshed, and are increased by 10% with a free-stall housing system (estimation made on experimental data, Konggaard Reference Konggaard1977), while the requirements are increased on average by 20% when cows graze a productive pasture of high-quality grass (Langlands & Sutherland Reference Langlands and Sutherland1968). The ability of the animal to mobilize body reserves in early lactation is linked to (i) the status of its body and lipid reserves at calving through its body condition score at calving, noted BCScalv; and (ii) its pMPmax, as described by Faverdin et al. (Reference Faverdin, Delaby and Delagarde2007a) and Brun-Lafleur et al. (Reference Brun-Lafleur, Cutullic, Faverdin, Delaby and Disenhaus2013). This ability is expressed by a pool of energy that can be mobilized (BCSlosspool score). This equation was built from another equation developed by Brun-Lafleur et al. (Reference Brun-Lafleur, Cutullic, Faverdin, Delaby and Disenhaus2013) adjusted on the basis of a large data set collected from the experimental farm of INRA Le Pin-au-Haras (Delaby et al. Reference Delaby, Leurent, Gallard and Schmitt2010).
 $$BCSlos{s_{\,pool}}\, = \,2 {\cdot} 20 - 0 {\cdot} 047 \times pM{P_{max}} - 0 {\cdot} 51 \times BC{S_{calv}} + \Delta$$
with Δ = −0·1 for primiparous and Δ = 0·1 for multiparous cows.
Intake
The intake model is based on the hypothesis that animals voluntarily ingest feedstuffs ad libitum until their intake capacity is met. The fill unit system considers that the intake capacity (IC, LFU kg/dry matter (DM)) is equal to the sum of the amounts of dry matter of each component of the diet multiplied by their fill value (Faverdin et al. Reference Faverdin, Baratte, Delagarde and Peyraud2011).
Daily dry matter forage intake can be calculated (DMIf) according to the equations developed by Faverdin et al. (Reference Faverdin, Baratte, Delagarde and Peyraud2011), taking into account intake capacity, fill value of forage (FVf), concentrate amount (Qc) and calculated substitution rate between concentrate and forages (mSR). The mSR depends on the proportion of concentrate in the diet and the net energy values of forages and concentrates and enables the model to consider metabolic regulation of concentrate intake. For a known ingested forage, mSR increases with a higher proportion of concentrate in the diet.
 $$DM{I_f}\, = \,{{\{ IC - (mSR \times {Q_c} \times F{V_f})\}} / {F{V_f}}}$$
At grazing, the intake model takes into account the evolution of sward structure and grazing management impinging on voluntary ingestion by animals (Delagarde et al. Reference Delagarde, Faverdin, Baratte and Peyraud2011a). The sward structure is described by total standing biomass (BM) and by the proportions (PR, kg DM/kg DM) in the available strata for grazing (>3 cm above ground level) and the organic matter digestibility (OMD) of four structural components: green leaves and sheath (GV), dead leaves and sheath (DV), green stems and flowers (GR) and dead stems and flowers (DR) (Jouven et al. Reference Jouven, Carrère and Baumont2006a).
Two interlocked coefficients mimic the fact that under a rotational grazing system, during animal time on a paddock, grass availability and voluntary ingestion both decrease according to the equations developed by Delaby et al. (Reference Delaby, Peyraud and Faverdin2001). Grass availability (CGrassAvail) depends on daily grass height (Hd), grass height at entry to the paddock (HE) and grass height below which animals can no longer graze (Hmin, > 3 cm above ground level) Delaby et al. (Reference Delaby, Peyraud and Faverdin2001).
 $${C_{GrassAvail}}\, = \,\; \displaystyle{{({H_d} - {H_{min}})} \over {({H_E} - {H_{min}})}}$$
with
 $${H_{min}}\, = \,3 - 0 {\cdot} 1\,{H_E} + H_E^2 $$
The second coefficient (CIntakeBrake) represents the limitation effect of the decrease in grass availability on grass intake.
 $${C_{IntakeBrake}}\, = \,{e^{( - 8 \times {C_{GrassAvail}})}}$$
Similarly to the grass ingestion model developed by Delagarde et al. (Reference Delagarde, Faverdin, Baratte and Peyraud2011a), grass intake is calculated in two steps. The first step (QGrassWC) includes the limitation effect, and takes into account intake capacity and fill value of grass (FVg), but does not consider any concentrate supply Delaby et al. (Reference Delaby, Peyraud and Faverdin2001).
 $${Q_{GrassWC}}\, = \,\{ (1 - {C_{IntakeBrake}}) \times IC\} /F{V_g}$$
In a second step, the daily amount of concentrate is taken into account through the calculated substitution rate (SrGrass) (Delagarde et al. Reference Delagarde, Faverdin, Baratte and Peyraud2011a).
 $${Q_{Grass}}\, = \,{Q_{GrassWC}} - S{r_{Grass}} \times Qc$$
Subsequently, energy intake (Energyintake; MJ/d) can be determined considering the digestive interactions (UFLcorr) and the non-additivity of UFL values knowing dry matter intake of concentrates, forages or grass and their energy value (Jarrige Reference Jarrige1989; Faverdin et al. Reference Faverdin, Baratte, Delagarde and Peyraud2011). UFLcorr is a coefficient due to the diet digestibility decrease linked to the increase in intake and in concentrate proportion in the diet (Faverdin et al. Reference Faverdin, Baratte, Delagarde and Peyraud2011).
During in-door feeding time:
 $$Energ{y_{intake}}\, = \,(UF{L_f} \times DM{I_f} + UF{L_c} \times {Q_c} - UF{L_{corr}}) \times 7 {\cdot} 106$$
During grazing time:
 $$Energ{y_{intake}}\, = \,(UF{L_{grass}} \times {Q_{grass}} + UF{L_c} \times {Q_c} - UF{L_{corr}}) \times 7 {\cdot} 106$$
Energy utilization for production of milk
Knowing energy intake (Energyintake; MJ/d) and energy requirements for maintenance and growth (Energymg; MJ/d), available energy for milk production can be calculated, considering that this energy is used only by the udder to produce milk. This energy can be converted into milk, called diet-allowable milk production (daMP) on the hypothesis that the energy necessary to synthesize 1 kg of standard milk with 4% of fat is 3·127 MJ (Faverdin et al. Reference Faverdin, Baratte, Delagarde and Peyraud2011).
 $$daMP\, = \,\; \displaystyle{{(Energ{y_{intake}} - Energ{y_{mg}})} \over {3 {\cdot} 127}}$$
The hypothesis is included that daily milk production is linked to the previous 2 days of energy intake. Moseley et al. (Reference Moseley, Coppock and Lake1976) and Faverdin et al. (Reference Faverdin, Delaby and Delagarde2007a) have shown that when diet composition abruptly changes, animals adapt almost immediately to this disturbance by modifying their ingestion. The effect on milk production occurs with a delay of a few days (Moseley et al. Reference Moseley, Coppock and Lake1976). This delay is due to the ability to mobilize body reserves in the short term (Faverdin et al. Reference Faverdin, Delaby and Delagarde2007a) to maintain homeostatic equilibrium (Coulon & Rémond Reference Coulon and Rémond1991; Gross et al. Reference Gross, van Dorland, Bruckmaier and Schwarz2011). To depict this effect, a moving average to calculate milk production from energy directly available for the udder on a day is calculated from the daMP value of the last 2 days. This mean allows a better simulation of the milk production curve at grazing with a simplified rotational management as described by Hoden et al. (Reference Hoden, Peyraud, Muller, Delaby, Faverdin, Peccatte and Fargetton1991).
 $$M{P_{udder}}\, = \,0 {\cdot} 70 \times daM{P_{d - 1}} + 0 {\cdot} 30 \times daM{P_{d - 2}}$$
MPudder is then compared with potential milk production, and the difference is noted ΔMP
 $$\Delta MP\, = \,M{P_{udder}} - pMP$$
In the case of a positive ΔMP, theoretical requirements of the animal, including pMP, are met; 25% of this extra energy is converted into extra milk. In other words, in this model, actual milk production (aMP) can exceed potential milk production defined by genetic potential for a balanced diet in the case of a better quality diet.
 $$aMP\, = \,0 {\cdot} 25 \times \Delta MP + pMP$$
In the case of a negative ΔMP, there is a shortfall of energy supplied by the diet to produce milk to the full extent of pMP. In early lactation, until the 12th week of lactation, mobilization of body reserves allows the cow to produce more milk than MPudder until the BCSlosspool is positive (Eqn (5)). This effect is modelled by a coefficient of mobilization, Cmob:
 $$aMP\, = \,M{P_{udder}} - (\Delta MP \times {C_{mob}})$$
where Cmob is a coefficient that describes energy mobilization (Coulon & Rémond Reference Coulon and Rémond1991; Buttchereit et al. Reference Buttchereit, Stamer, Junge and Thaller2010; Gross et al. Reference Gross, van Dorland, Bruckmaier and Schwarz2011) and decreases according to the animal's week of lactation.
 $${C_{mob}} \times 0 {\cdot} 7 \times (1 {\cdot} 2 - 0 {\cdot} 2 \times {e^{ - 0.6 \times WL}} - 0 {\cdot} 04 \times WL)$$
The link between Cmob and BCSlosspool is made through daily energy balance and daily body score variation (see the next section). In other words, Cmob works until there is enough energy available from BCSlosspool.
In mid- and late lactation, after the 12th week of lactation, it has been considered that the dairy cow can no longer mobilize reserves, and actual milk production equals that allowed by the energy supply of the diet. This case also occurs when the ability to mobilize body reserves is reduced to zero, in other words, when the point of exhaustion of a pool of energy to be mobilized is reached.
 $$aMP\, = \,M{P_{udder}}$$
In contrast to the winter situation, rotational grazing management implies a fluctuating intake level, and so a varying energy supply between the first and the last days on a paddock. Dairy cows have to adapt to these variations and switch in a short time from an excess to a deficit of energy. Milk production follows a curve with an increase in milk production and a peak after the first 2 days, which is noted maxMP (Hoden et al. Reference Hoden, Peyraud, Muller, Delaby, Faverdin, Peccatte and Fargetton1991). The low milk production in the first 2 days on a paddock results from a low-energy intake in the last 2 days on a preceding paddock. The peak represents the local potential milk production allowed by herbage offered in the paddock. A gradual decrease in milk production then occurs, linked to the decrease in grass availability and its quality at the end of the residency time on a paddock. However, mobilization of body reserves in the short term, and the buffering capacities of animals, allows actual milk production to exceed MPudder. This buffering capacity to offset energy supply variations in the short term is taken into account by a coefficient of correction (Ccorr) that minimizes the milk production drop at the end of residence time on a paddock. This has been adjusted on daily milk production data within a paddock (experimental data from L. Delaby, personal communication) to match with milk production curves as Hoden described in Hoden et al. (Reference Hoden, Peyraud, Muller, Delaby, Faverdin, Peccatte and Fargetton1991). Ccorr is equal to 0·50 at the beginning of lactation and 0·25 thereafter. Milk production allowed by the diet offered at grazing including the correction for energy mobilization (grassMP) is then compared with pMP as described in Eqn (14). If grassMP is lower than pMP, aMP is the same as grassMP. Conversely, if grassMP is higher than pMP, actual milk production can be calculated with Eqn (15). This is the case when significant quantities of high-quality herbage are offered at the beginning of the spring. Once grassMP exceeds pMP on a paddock, this correction is applied on the milk production calculation until the end of residence in order to keep the shape of the milk production curve on a paddock as defined by Hoden et al. (Reference Hoden, Peyraud, Muller, Delaby, Faverdin, Peccatte and Fargetton1991). Equation (19) considers that if maxMP exceeds pMP, then maxMP has to be considered as the potential milk production of the grazed paddock.
Finally, aMP at grazing is calculated by:
 $$aMP\, = \,M{P_{udder}} + {C_{corr}} \times (Max\{ maxMP{\rm ;}\ pMP\} - M{P_{udder}})$$
Energy balance and body condition score
Once aMP has been calculated, energy balance is calculated by:
 $$Energ{y_{bal}}\, = \,Energ{y_{intake}} - (Energ{y_{mg}} + aMP \times 3 {\cdot} 127)$$
In the case of a positive balance, the daily variation of BCS (score) and LW (kg) are estimated by the equations developed by Chilliard et al. (Reference Chilliard, Remond, Agabriel, Robelin and Verite1987). A positive daily variation of BCS or LW is written ΔBCS+ or ΔLW+, and a negative one is noted ΔBCS− or ΔLW−:
 $$\Delta BCS + = Energ{y_{bal}} \times 0 {\cdot} 00296$$
 $$\Delta LW + = Energ{y_{bal}} \times 1 {\cdot} 5791$$
In the case of a negative balance, other equations developed by Chilliard et al. (Reference Chilliard, Remond, Agabriel, Robelin and Verite1987) are used:
 $$\Delta BCS - = Energ{y_{bal}} \times 0 {\cdot} 03948$$
 $$\Delta LW - = Energ{y_{bal}} \times 2 {\cdot} 0303$$
When energy balance is negative, BCSlosspool is decreased by daily BCS variation until its exhaustion
 $$BCSlos{s_{\,pool{\kern 1pt} d}} = BCSlos{s_{\,pool{\kern 1pt} d - 1}} + \Delta BC{S_{ - d}}$$
Model validation
Because milk production is the main output of this model and the whole model, Dynamilk, the validation process has been focused on the validation of milk production predictions by testing the model against experimental data, and by exploring model behaviour in response to variation in key inputs.
Model predictions against experimental data
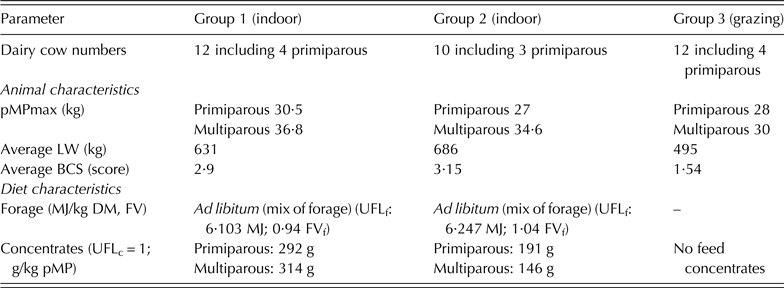
Data from two groups of cows subjected to control treatments (Pomiès et al. Reference Pomiès, Baumont, Egal and Rémond2008, Reference Pomiès, Caré and Veissier2010) were used to test the model's predictive accuracy during winter feeding with a diet based on conserved grass. The parameters used to simulate milk production are provided in Table 2. All the parameters were calibrated from experimental recorded data with average live weight and body condition score data of experimental animals, and average diet characteristics from each animal's intake during the trials. Potential milk production at peak of lactation was estimated by an average on observed milk production values between the 5th and the 8th week of lactation according to a method developed by Faverdin et al. (Reference Faverdin, Delagarde, Delaby, Meschy and Agabriel2007b). The first group was made up with 12 cows including 14 primiparous, with a pMPmax of 30·5 kg/day for primiparous and 36·8 for multiparous with an average LW of 631 kg and an average BCS of 2·9. They received a diet made up of ad libitum forage (6·103 MJ/kg DM, 0·94 FVf) and concentrate feed supplied with 292 g/kg of pMP for primiparous and 314 g/kg for multiparous cows. The second group was made up of 10 cows including 3 primiparous, with a pMPmax of 27 kg/day for primiparous and 34·6 for multiparous cows with an average LW of 686 kg and an average BCS of 3·15. They received a diet composed of ad libitum forage (6·247 MJ/kg DM, 1·04 FVf) and concentrate feeds of 191 g/kg of pMP for primiparous and 146 g/kg for multiparous cows.
Description of parameters to simulate the experimental trials
A third experimental group of cows was used to test milk production predictions at grazing. This trial was carried out on an INRA experimental farm (Marcenat, 1060 m a.s.l., Massif Central, France) (Farruggia et al. Reference Farruggia, Pomies, Bethier, Troquier, Le Bec, Paccard, Baumont, Pradel, Schnyder, Isselstein, Taube, Auerswald, Schellberg, Wachendorf, Herrmann, Gierus, Wrage and Hopkins2010). Twelve dairy cows including four primiparous, at the 19th week of lactation with an LW of 640 kg and a BCS of 1·54 on average, grazed fertilized temporary grasslands receiving 80 kg N/ha/year, managed under rotational grazing with a stocking rate of 1·8 livestock unit per ha (LU/ha) and with no concentrate supply. Potential milk production at the peak of lactation was estimated from milk production on days 4–6 after calving. Herbage biomass and quality was simulated according to the model of Jouven et al. (Reference Jouven, Carrère and Baumont2006a) using sward measurements completed during the experiment as inputs. A sequence of six paddocks grazed successively from 24 May to 11 July 2009 was simulated.
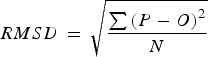
To measure the accuracy of the model predictions, the root-mean-squared deviation (RMSD) between the observed and the predicted values was calculated.
 $$RMSD\, = \,\sqrt {\displaystyle{{\mathop \sum \nolimits {{(P - O)}^2}} \over N}} $$
where P is a predicted value, O is an observed value and N is the number of observations.
To gain further insight into model performance, the three additive components of mean-squared deviation (MSD) described by Gauch et al. (Reference Gauch, Hwang and Fick2003) have also been calculated: the squared bias (SB), which measures translation of observed: predicted from the 1:1 line, the non-unity slope (NU), which measures rotation from the 1:1 line, and lack of correlation (LC), which measures dispersion.
 $$SB\, = \,{(\overline P - \overline O)^2}$$
where  $\overline P \;$ and
 $\overline O $ are the means of the predicted and observed values
 $$NU = {(1 - b)^2} \times \sum {({P_n}} - \overline P{)^2}/N$$
where b is the slope of the regression line O = a + b × P and summation over n = 1, …, N.
 $$LC = (1 - {r^2}) \times \sum {({O_n}} - \overline O{)^2}/N$$
where r 2 is the correlation coefficient of O = a + b × P
The best fit is obtained when SB, NU and LC are close to zero.
Model behaviour
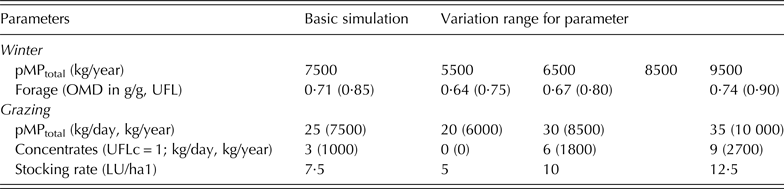
Sensitivity of the simulated milk production was tested on animals (i) for the winter period: including the potential milk production and forage digestibility; and (ii) for the grazing period: including the concentrate supply, potential milk production and stocking density (Table 3). To test model behaviour, simulations were carried out based on conceptual virtual data which were kept realistic. For simulations of winter feeding at the beginning of lactation, dairy cows were characterized by an average LW of 650 kg and a BCS of 3·14, and concentrate supply was fixed at 1200 kg/cow/year. For simulations at grazing, dairy cows were characterized by an average LW of 650 kg, a BCS of 3 and average week of lactation and week of gestation were respectively 18 and 10. Paddock and sward characteristics were set to run with the grass growth model developed by Jouven et al. (Reference Jouven, Carrère and Baumont2006a), with a standing biomass at a ground level of 2750 kg/ha, a vegetative sward growth of 60 kg/ha/day and a rate of ageing of 2%. The stocking density was fixed at 7·5 LU/ha.
Variation in the range of inputs for production parameters tested in winter and grazing simulations
OMD, organic matter digestibility.
RESULTS
Model predictions against experimental data
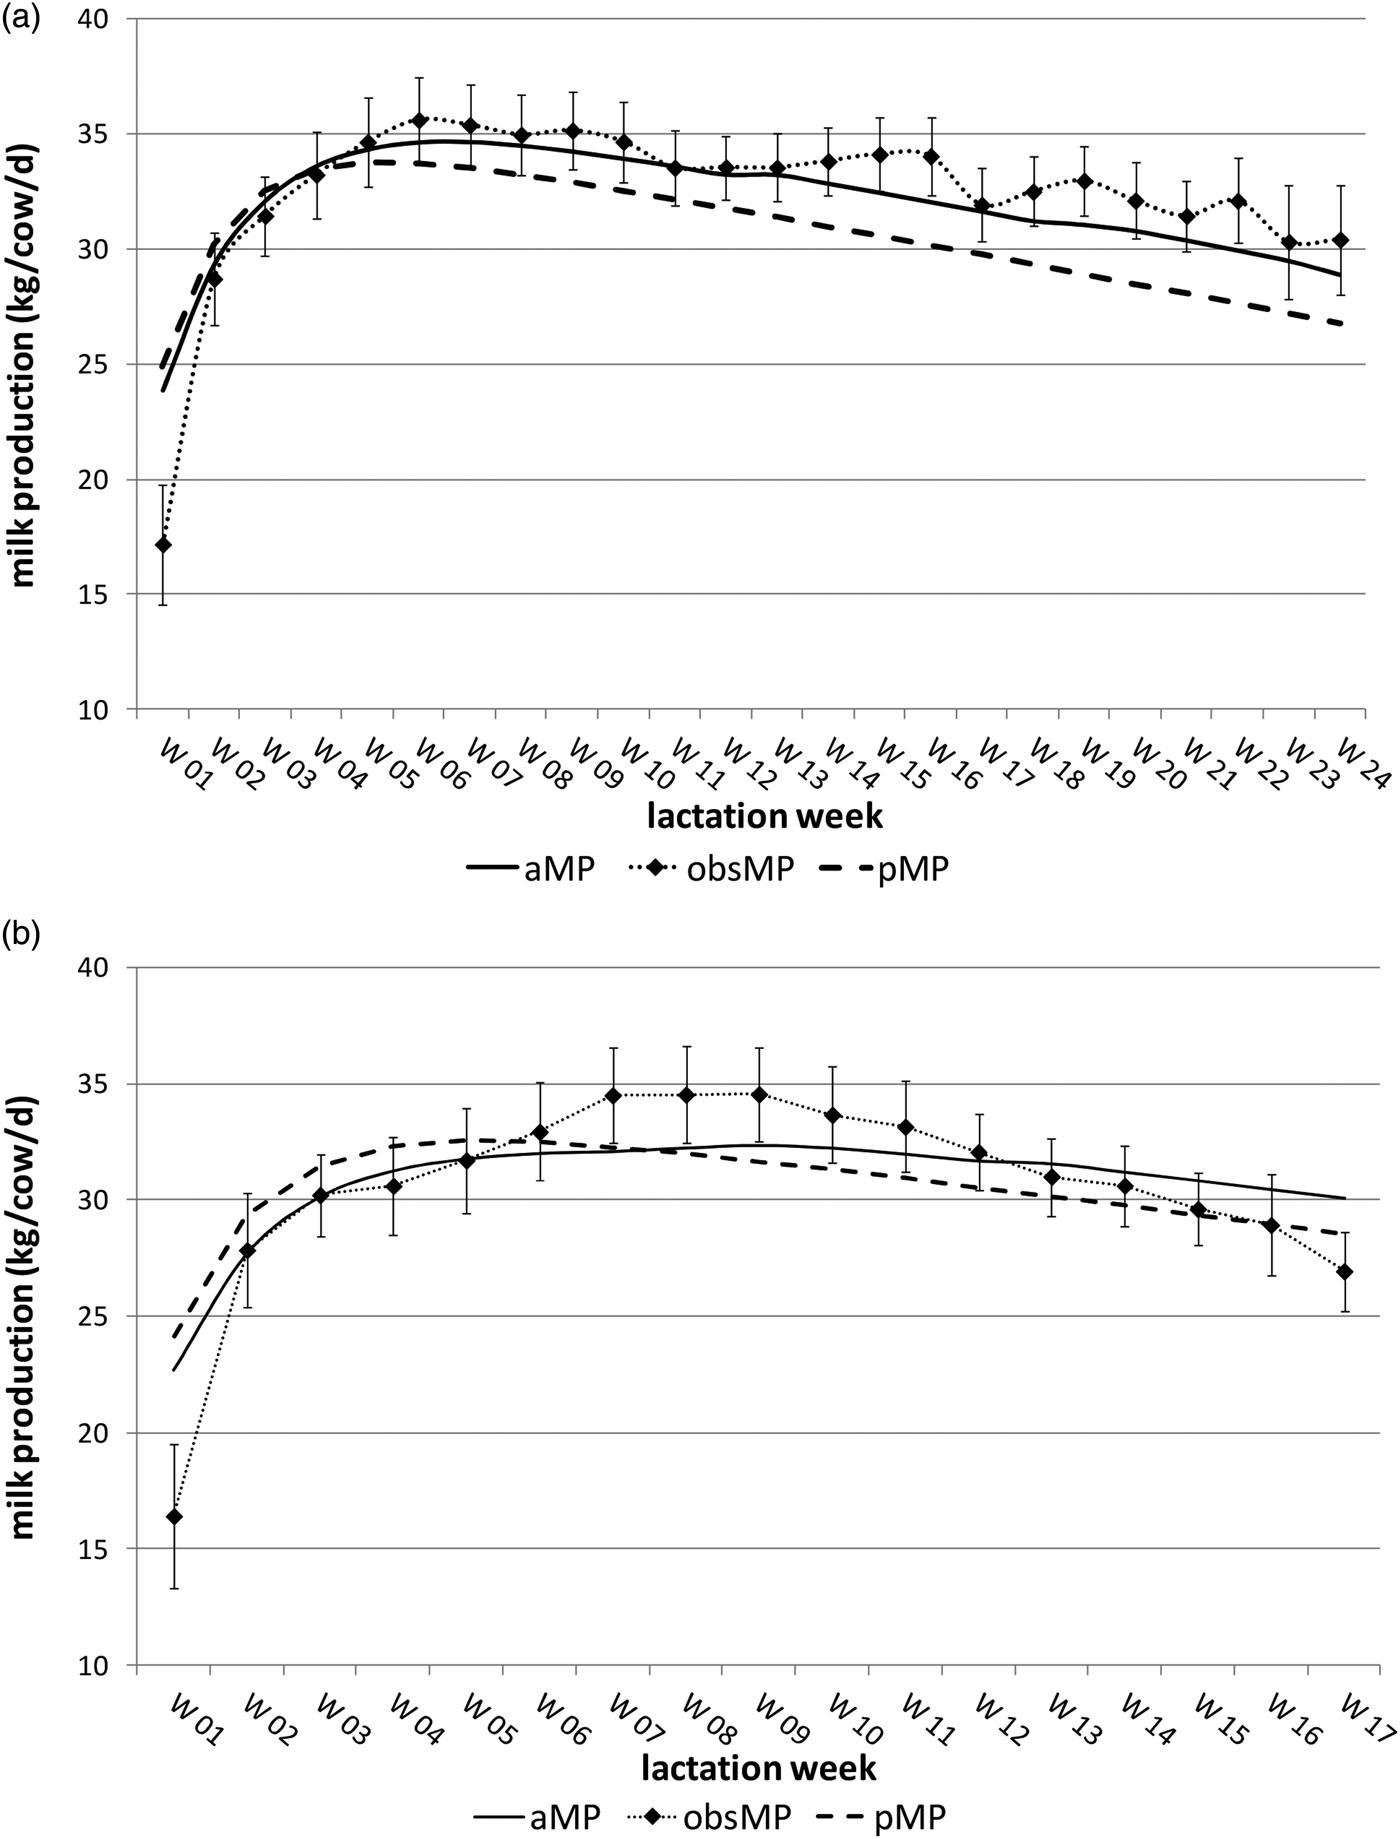
During the winter and indoor feeding period, the model successfully simulated the lactation curves of the two groups of cows (Fig. 3), with an increase in milk production over the first weeks of lactation, a peak milk yield between the 6th and the 8th week and then a gradual decrease after the 9th week of lactation. The predicted lactation curve fitted less well for Group 2 than for Group 1, especially from the 8th to the 12th week of lactation. In both simulated situations, the model struggled to predict daily milk production during the first week of lactation (23·8 v. 17·2 and 22·7 v. 16·4 kg/cow/day, respectively), but still remained close to the estimated potential milk production.
Comparison between predicted milk production (aMP,  ) and experimental milk production (obsMP,
 ) for Group 1 (a) on 24 weeks of lactation and Group 2 (b) on 17 weeks of lactation. Experimental data are presented with standard error of the mean (s.e.m.), and
 represents the estimated pMP values for the two studied batches.
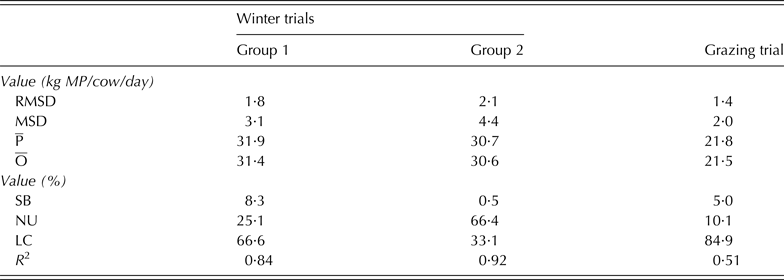
The RMSD of model prediction was 1·8 and 2·1 kg/cow/day respectively for Groups 1 and 2 (Table 4), which represents 5·7 and 6·8% of daily observed milk production. The mean bias ( $\overline{P} - \overline{O}$) between predicted and observed data was 0·5 and 0·1 kg/cow/day for Groups 1 and 2 during indoor feeding, respectively. This indicates that the model tended to slightly overestimate milk production, especially above 30 kg/cow/day. For the first group, the MSD breakdown indicates that the non-adjusted part of the model prediction was explained mainly by lack of correlation (67%) with a low bias (SB = 8%), which indicates a low translation of observed: predicted compared with the 1:1 line, and a moderate rotation of the linear line compared with the 1:1 line (NU = 25%). The MSD of Batch 2 is explained by a very low SB with 0·5%, a lack of correlation of 33·1% and a rotation of the linear line of observed: predicted compared with the 1:1 line of 66·4%. In both situations, the low bias indicates that the model structure was consistent.
Statistical analysis of the relationship between predicted and observed milk production for Groups 1 and 2 for the winter housing and grazing periods
RMSD, root-mean-squared error; MSD, mean-squared error;  $\overline{P}$, mean of the predicted value;
 $\overline{O}$, mean of the observed value; SB, squared bias; NU, non-unity slope; LC, lack of correlation; R 2, coefficient of determination.
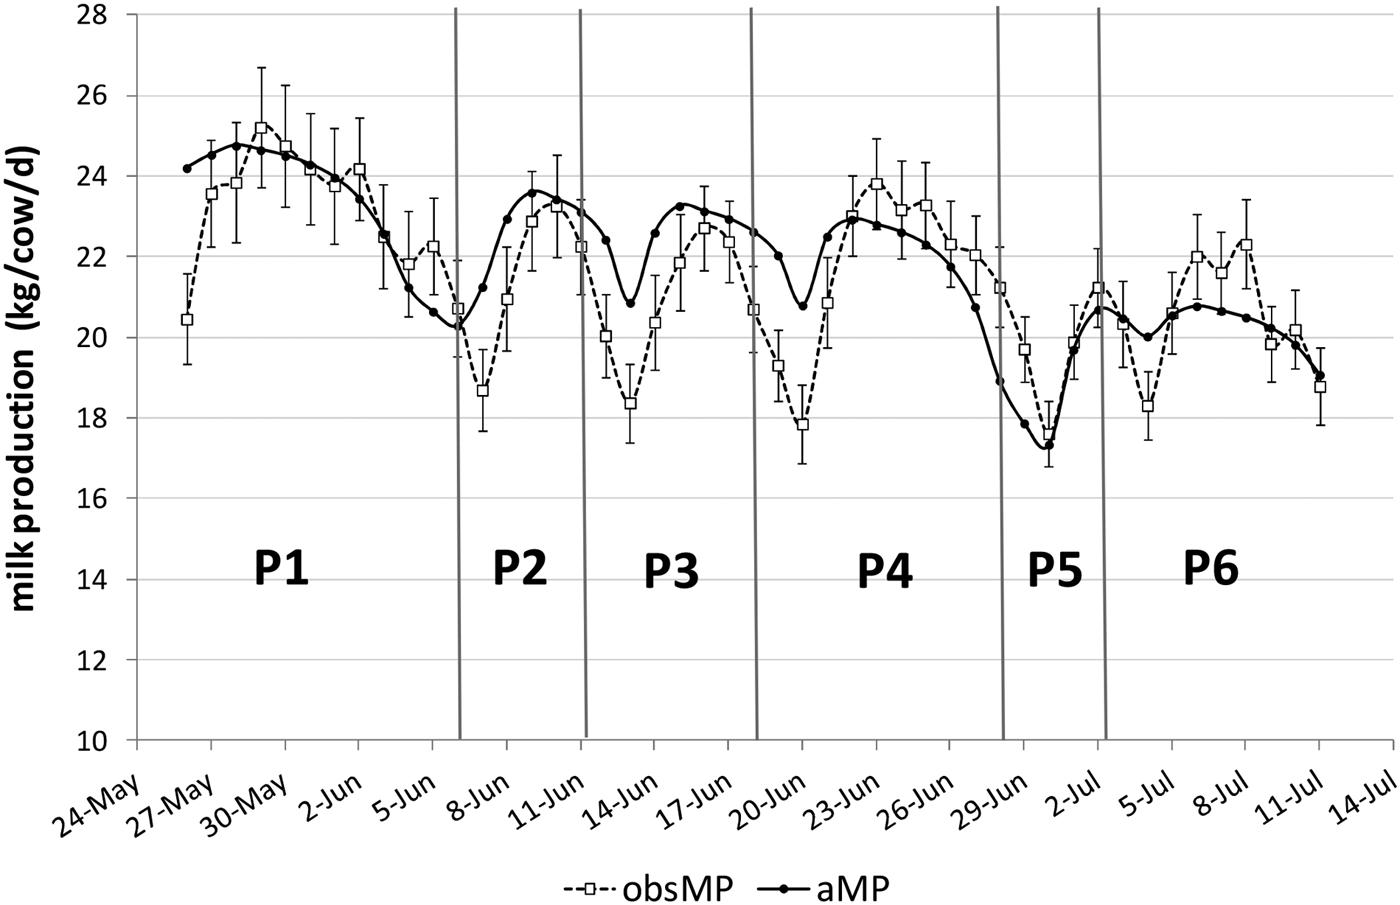
At grazing, the model successfully simulated the typical waves in the lactation curve under simplified rotational grazing management (Fig. 4). However, the model seemed to have some difficulty simulating the drop in milk production during the transition between the two paddocks. The RMSD of model prediction was 1·4 kg/cow/day (Table 4), representing 6·5% of daily observed milk production. The MSD breakdown (Table 4) indicates that the non-adjusted part of the model prediction was mainly due to a lack of correlation between observed: predicted (85% of MSD). Model predictions present a low bias (SB = 5%) and rotation of the linear line compared with the 1:1 line (NU = 10%). The high LC and the coefficient of determination of 0·51 (Table 4) can be related to the high variability of observed milk production on paddocks, which was very noticeable on paddocks 1, 4 and 6.
Comparison between predicted milk production (aMP,  ) and experimental milk production (obsMP,
 ) on a sequence of six paddocks grazed from 24 May to 11 July. Experimental data are presented with standard error of the mean (s.e.m.)
Model behaviour
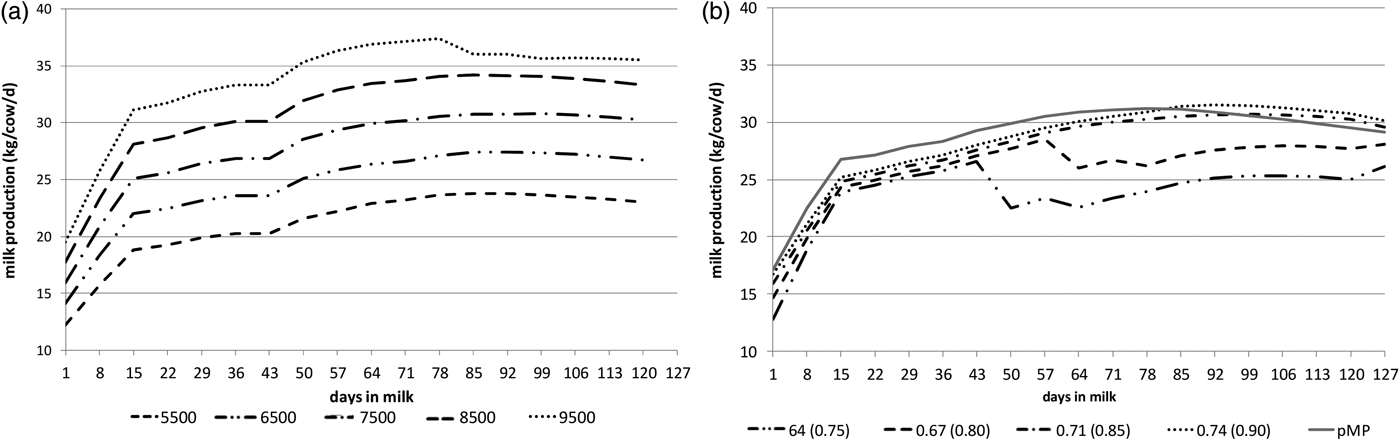
The milk production curve increased according to the increase in pMP (Fig. 5a). From Day 1 to Day 127, the shapes of all the simulated lactation curves were parallel, except for the 9500 kg/cow/year simulation. The average difference between the different simulations was stable, and estimated at 3·12 kg/cow/day (±0·30). The lactation curve corresponding to the 9500 kg/cow/year simulation presented a drop at Day 83. The energy supplied by the diet did not meet the energy needs of the dairy cows. Hence, this drop corresponds to the point of exhaustion of the pool of energy that can be mobilized. From this time onward, aMP was equivalent to diet-allowable milk production.
Model behaviour assessments at winter time: impacts on milk production (aMP, kg/cow/day) of (i) graph a: total potential milk yield per lactation (pMPtotal, kg/year); (ii) graph b: digestibility of basic diet forages (dmo g/g (UFL kg/DM)) compared with pMP of 7500 kg/cow/year ( ).
From the first days of lactation, aMP gradually increased, and the higher the digestibility of the basic diet, the higher the milk production (Fig. 5b). However, even for the higher digestibility basic diet (0·74 g/g and 6·462/kg DM), aMP did not reach pMP, consistent with a limited intake capacity during the first weeks of lactation (Chilliard et al. Reference Chilliard, Remond, Agabriel, Robelin and Verite1987; Reist et al. Reference Reist, Erdin, von Euw, Tschuemperlin, Leuenberger, Chilliard, Hammon, Morel, Philipona, Zbinden, Kuenzi and Blum2002; Faverdin et al. Reference Faverdin, Delaby and Delagarde2007a). For the two lowest basic diet digestibility situations (0·64, 0·67 g/g), a drop in milk production occurred during the 6th and the 8th week of lactation, respectively (Day 47 and Day 61). This drop was due to the shut-down of the processes mobilizing body reserves. The lower the basic diet digestibility, the quicker mobilization of body reserves reached its point of exhaustion. Milk production then gradually increased in relation to the increase in intake capacity. For the two highest digestibility diet situations, the same increase occurred, and the difference between aMP and pMP gradually decreased. For the highest digestibility basic diets, a return to energy equilibrium status, characterized by aMP exceeding pMP, was reached between the 11th and 13th weeks of lactation, respectively.
At grazing, the average milk production on the paddock with no concentrates was 21·5 kg/cow/day (pMP = 25 kg cow/day) (Fig. 6a). In this case, energy supply from grass only did not meet the animals’ needs, and potential milk production could not be reached. The higher the concentrate supply, the higher the milk production: increasing the amount of concentrates flattened the lactation curve shapes. With a stocking density of 7·5 LU/ha and for the 6 and 9 kg/cow/day of concentrate simulations, the gap between the peak of milk production and the first or last day on the paddock was small compared with the 0 and 3 kg/cow/day situations: the difference between the maxMP and the lowest production day on a paddock was 5·50 kg/cow/day for the simulation with no concentrates, and 3·24 kg/cow/day for the situation where there was 9 kg/cow/day of concentrate fed. Figure 6a shows a non-linear reduction of the response of milk production to an increase in concentrate feed, with an average increase of 1·81 kg/cow/day between the 0 and the 3 kg/cow/ day simulations, 1·26 kg/cow/day between 3 and 6 kg/cow/day, 0·95 kg/cow/day between 6 and 9 kg/cow/day situations. Increasing the concentrate supply at grazing caused a rise in the number of days spent on the paddock through a reduction of grass intake with 15·9 kg DM cow/day with no concentrates and 13·8 kg DM/cow/day with a supply of 9 kg/cow/day of concentrates.
Model behaviour assessment at grazing: impact on milk production (aMP, kg/cow/day) of (i) graph a: daily feed concentrate amount (Qc, kg/day); (ii) graph b: potential milk production (pMP, kg/cow/day); (iii) graph c: stocking density (LU/ha).
The aMP on the same paddock and with the same supplementation was higher with a higher pMP (Fig. 5b). The 20 kg/cow/day of pMP simulation presented a very flat shape compared with the other situations because the diet-allowable milk production was higher than pMP, with an average of 22·4 kg/cow/day. Dairy cows with a pMP of 25 kg/day managed to reach their potential at the peak on the paddock. In contrast, general grass offered on a paddock and 3 kg of supplementation did not allow a dairy cow with a pMP higher than 30 kg/day to produce as much as their pMP. Thus, high-producing cows could not stay on the paddock as long as lower producing ones, as shown by the decrease in the number of days spent on the paddock (Fig. 6b).
Figure 6c shows that average milk production on a paddock was not sensitive to an increase in the stocking density, with almost the same average milk production on the paddock (23·7 kg/cow/day, ±0·37). The peak of milk production on the paddock (maxMP) was identical for all situations (25·4 kg/cow/day, ±0·01): maxMP represents the potential milk production given by grass offered on the paddock for dairy cows with the same characteristics. The number of days spent on the paddock decreased along with a rise in the stocking density due to a greater amount of grass ingested per day at the herd scale.
DISCUSSION
The featured model, in line with the modelling objectives, succeeded in predicting milk responses according to (i) potential production of cattle and their characteristics; and (ii) herbage, forage and concentrate supply, depending on the farmer's management. Considering that dairy cows are not necessarily fed in relation to their energy requirements, the model manages to simulate milk responses to variations in energy offered at different time scales. The model integrates two different feeding systems: a winter period, characterized by a constant day-to-day diet offered, in quantity and quality, and a grazing period, determined by high variation in grass offered. This ability to predict milk responses in rotational grazing management is allowed by strong interactions between evolution of sward characteristics and grass intake, and the animal's ability to mobilize or restore body reserves in the short term.
Model validation
In validation tests on winter and on grazing periods, the model manages to predict milk responses with a satisfactory accuracy of 1·8 and 2·1 kg MP/cow/day for the in-door feeding period and 1·4 for the grazing period (RMSD, Table 4). The accuracy of prediction is in the same range as similar models. If our model's accuracy is expressed by the RPE defined by the positive square root of the mean square prediction and formulated as a percentage of the mean of actual values (Fuentes-Pila et al. Reference Fuentes-Pila, DeLorenzo, Beede, Staples and Holter1996; Baudracco et al. Reference Baudracco, Lopez-Villalobos, Holmes, Comeron, Macdonald, Barry and Friggens2012), the RPE values for the two winter trials are 5·7 and 6·9%, and 6·5% for grazing trials. Fuentes-Pila et al. (Reference Fuentes-Pila, DeLorenzo, Beede, Staples and Holter1996) considers that an RPE value lower than 10% is a good indication of satisfactory prediction. In comparison, models developed for formulated diets such as the NRC model (National Research Council Nutrient Requirements of Dairy Cattle) and the CNCPS model (Cornell Net Carbohydrate and Protein System) predict diet-allowable milk production with an accuracy of 5·42 and 4·77 kg/day, respectively (Tedeschi et al. Reference Tedeschi, Seo, Fox and Ruiz2006). For these two models, the coefficient of determination, R 2, is 0·90 and 0·85, respectively, compared with 0·84 and 0·92 for the two winter trials for the current model. Milk prediction models at grazing also have the same range of accuracy predictions as that considered in the present paper: for instance the e-Cow model, with an RPE of 15·4 and 18·0% for two trials on 300 days in milk (Baudracco et al. Reference Baudracco, Lopez-Villalobos, Holmes, Comeron, Macdonald, Barry and Friggens2012), and the Graz'In model on 206 experimental herds with an RPE of 3·12 kg/day or 13·7% (Delagarde et al. Reference Delagarde, Valk, Mayne, Rook, González-Rodríguez, Baratte, Faverdin and Peyraud2011b). The RPE value of the current model is lower than the others, certainly owing to a validation process carried out in a shorter time (127 days of lactation for winter trials and 47 days for the grazing trial) and on only three herds.
Concerning the MSD breakdown, the plot rotation is mainly due to the model's difficulty simulating milk production during the first week of lactation, with a difference between predicted and observed data of 6·6 kg/cow/day for the first in-door feeding trial and 5·5 kg/cow/day for the second one. However, these predicted values are close to the pMP values. These differences occur only during the first week of lactation, and disappear as soon as the second week of lactation is reached. If the first week of lactation is excluded from the statistical analysis, the REP of the current model is 3·4 and 4·6%, respectively, for the two winter trials. The rest of the non-adjusted part of the model predictions can be explained by (i) the per se inability of the model to simulate individual variability of milk production responses; and (ii) the difficulty estimating pMPmax from experimental milk production. Indeed, pMPmax is calculated from the animal's genetic potential which is estimated. The estimation was particularly difficult to carry out for the second in-door feeding trial when the dairy cows were not fed to the same level as their theoretical requirements. Hence, pMPmax and pMP are both key variables in the mechanisms of milk production response developed in the current model.
At grazing, the MSD breakdown indicates that the model prediction presents a low bias and a small rotation of the linear line compared with the 1:1 line. It indicates that the model structure seems coherent and consistent. The deviation between predicted and experimental values is mainly linked to a marked lack of correlation due to the close relationships between sward characteristics, intake and milk production. Difficult estimations and adjustments were carried out to define sward characteristic parameters from the available experimental data of the grazing trial, such as a reckoning of the standing biomass at ground level, and the density and growth rate of the sward. Another explanation of this discrepancy could be that the intake mechanisms described in the model do not take into account the interface between vegetation, animal behaviour mechanisms and animal diversity as described by Baumont et al. (Reference Baumont, Cohen-Salmon, Prache and Sauvant2004) for small ruminants or by Rook et al. (Reference Rook, Huckle and Penning1994) and Kondo (Reference Kondo2011). Despite the difficulty of predicting a satisfactory drop in milk yields during the transition between two paddocks, the model manages to simulate milk responses in relation to variable levels of grass offered and typical shapes of lactation curves in rotational grazing management, as described by Hoden et al. (Reference Hoden, Peyraud, Muller, Delaby, Faverdin, Peccatte and Fargetton1991), Delaby et al. (Reference Delaby, Peyraud, Foucher and Michel2003a) or Roca-Fernández et al. (Reference Roca-Fernández, González-Rodríguez, Leurent, López-Mosquera, Gallard, Delaby, Goliński, Warda and Stypiński2012).
Model behaviour and milk responses to constant diet
Results of simulations testing model behaviour by analysing the effect of potential milk yield per lactation and digestibility of the basic diet on milk production (Fig. 5) indicate that the model manages to predict and reproduce the lactation curve shape of dairy cattle, similar to the results of Olori et al. (Reference Olori, Brotherstone, Hill and McGuirk1999) and Grossman & Koops (Reference Grossman and Koops2003), including the beginning of lactation with mechanisms mobilizing body reserves.
Enhancing the potential milk yield per lactation implies an increase in actual milk production, for the same concentrate supply and the same quality forage offer (ad libitum), with an average of 35·5 kg/cow/day for the highest yield level against 22·5 kg/cow/day for the lowest, for 127 days of lactation. Hence the high-yield dairy cows are more productive even if they do not produce as much as their potential could allow and need to mobilize more body reserves than the lower producing cows. A higher level of mobilization of body reserves is attested by the drop in milk production at day 83 for the 9500 potential yield simulation, which represents the point of exhaustion of the energy pool that can be mobilized. These simulations indicate that for an average quality diet based on pasture-based forages (6·103 MJ/kg DM for basic diet and 1200 kg/cow/year, that is to say, c. 5·5 kg/cow/day), only dairy cows with a potential of 5500 kg/year exceed their potential yield, and those with a potential of 6500 and 7500 can produce almost as much as their potential yield (the average daily difference between aMP and pMP is respectively −0·3 and −0·76 kg/cow/day). This finding relies on a herbage-based diet with lower energy density than other forages such as maize silage (6·54 MJ/LFU for this basic herbage diet against 7·32 MJ/LFU of density for excellent maize silage). These results indicate that pasture-based forage characteristics imply a limitation to high milk production through a reduction of intake level compared with better forages.
Simulations testing the effect of forage diet digestibility on milk production, with all parameters of production and concentrate supply being equal, indicate that predicted milk responses are sensitive to forage quality. For all the tested digestibility values, even the excellent one (0·74 g/g OMD and 6·462 MJ/kg DM), dairy cows never manage to produce as much as their potential during the first weeks of lactation, as described by Reist et al. (Reference Reist, Erdin, von Euw, Tschuemperlin, Leuenberger, Chilliard, Hammon, Morel, Philipona, Zbinden, Kuenzi and Blum2002) and Remppis et al. (Reference Remppis, Steingass, Gruber and Schenkel2011). When forage digestibility is satisfactory, the end of body reserve mobilization and a return to a positive energy balance occur after the peak of lactation, which is at the beginning of the second part of lactation. These results agree with the findings of Buttchereit et al. (Reference Buttchereit, Stamer, Junge and Thaller2010) and Gross et al. (Reference Gross, van Dorland, Bruckmaier and Schwarz2011), where the transition from body reserve mobilization to restoration occurred between 1·5 and 3 months post-partum. Only the situation with a 0·74 g/g OMD (6·462 MJ/kg DM) basic diet enables dairy cows to produce as much as their potential with an average daily difference between aMP and pMP of 0·24 kg/cow/day and between energy intake and theoretical animal requirements of 0·0718 MJ/cow/day (theoretical animal requirements are an assessment of the energy required to produce the same amount of milk as pMP and to cover maintenance, growth and gestation needs). Increasing digestibility of the basic diet when all parameters are equal implies an increase in milk production with a linear relationship through a linear increase in energy intake. This relationship between milk production and forage digestibility is linear until the point where energy supply from the diet meets animal needs. Afterwards, this increase is attenuated. This model behaviour response agrees with the experimental results of Coulon & Rémond (Reference Coulon and Rémond1991) who found a curvilinear response between energy supply and milk production for long-term trials (up to 40 weeks of lactation). The same kind of curvilinear relationship was also found by Brun-Lafleur et al. (Reference Brun-Lafleur, Delaby, Husson and Faverdin2010) for a diet with a balanced supply between energy and protein. In the case of negative protein balance, they found that the response of milk yield to energy supply was zero.
Model behaviour and milk responses to variable diet
Results of simulations (Fig. 6) testing the model's behaviour at grazing indicates that the model is able to predict milk responses in cases of different productive characteristics of dairy cows and variable diets offered through the farmer's management.
Concerning the simulation studying the effects of stocking density on milk production, these indicate that the average of daily milk production hardly varies. This first conclusion contradicts the experimental results for the study of different stocking rate levels (Peyraud & Delaby Reference Peyraud and Delaby2005; McCarthy et al. Reference McCarthy, Delaby, Pierce, Journot and Horan2011). McCarthy et al. (Reference McCarthy, Delaby, Pierce, Journot and Horan2011) argue that the increasing stocking rate implies a decrease in grass offered with an increase in the quality of grass intake, and finally an effect on milk responses. Even so, the model steers the grazing according to simplified rotational management rules that trigger paddock changes to control grass offered in quantity and quality. According to this way of managing grazing, increasing stocking density on a paddock only affects the time spent on the paddock by decreasing it through a higher level of biomass ingested per day. Simulations indicate that increasing stocking density makes it possible to considerably intensify milk yields per hectare (119 kg/ha for 5 LU/ha and 302 kg/ha for 12·5 LU/ha treatments). This range of increase corroborates the results of McCarthy et al. (Reference McCarthy, Delaby, Pierce, Journot and Horan2011) and Hoden et al. (Reference Hoden, Peyraud, Muller, Delaby, Faverdin, Peccatte and Fargetton1991).
Simulations testing different potential milk production with the same concentrate supplementation indicate that milk production is sensitive to the pMP level. With 3 kg of supplementation, only dairy cows with a pMP lower than 25 kg/day can produce as much at the same level as their pMP. This result agrees with those of Peyraud & Delaby (Reference Peyraud and Delaby2005), who demonstrate that pasture with a very low supplementation does not enable dairy cows to produce as much as their pMP. These simulations have shown that increasing the pMP of dairy cows at grazing implies incurved lactation curves at the paddock scale. These results confirm the findings of Roca-Fernández et al. (Reference Roca-Fernández, González-Rodríguez, Leurent, López-Mosquera, Gallard, Delaby, Goliński, Warda and Stypiński2012) testing milk performance of two cow breeds, Holstein–Friesian v. Normande on the same paddocks. Holstein–Friesian cows, which produce significantly more than Normande cows, presented a greater difference between maxMP and the last-day milk production than Normande cows (−6·2 v. −4·7 kg/cow).
Simulations testing an increase in concentrate supplies at grazing show that a non-linear increase in milk responses with efficiencies of 0·60 kg extra milk per kg of concentrates between 0 and 3 kg of concentrates supply and 0·32 kg extra milk per kg of concentrates between 6 and 9 kg simulations. The non-linear relation between milk response and increase in concentrate supplementation agrees with further results that found a curvilinear relationship (Bargo et al. Reference Bargo, Muller, Kolver and Delahoy2003; Auldist et al. Reference Auldist, Marett, Greenwood, Hannah, Jacobs and Wales2013). The efficiency of 0·60 kg of extra milk per kg of concentrate is lower than the data given by a review carried out by Delaby et al. (Reference Delaby, Peyraud and Delagarde2003b) (0·74 kg extra milk per kg of concentrates), higher than the results of Dillon et al. (Reference Dillon, Crosse and O'Brien1997) and consistent with the results of Hoden et al. (Reference Hoden, Peyraud, Muller, Delaby, Faverdin, Peccatte and Fargetton1991) (0·6 kg milk per kg concentrates) for similar productive characteristics of dairy cows. The low efficiency and the small difference in milk production of 0·95 kg/cow/day between the 6 and the 9 kg/cow/day of concentrate situation is due to a considerably higher diet-allowable milk production than the pMP (30·4 v. 25 kg/cow/day); extra energy is then used to restore body reserves. This agreed with the relationship between concentrate efficiency and potential milk production (Hoden et al. Reference Hoden, Peyraud, Muller, Delaby, Faverdin, Peccatte and Fargetton1991; Bargo et al. Reference Bargo, Muller, Kolver and Delahoy2003). Regarding the different shapes of milk production lines on a paddock, their flattening linked to the increase in the supplementation is due to the fact that increasing concentrate supply at grazing implies an increase in total dry matter intake and a decrease in grass intake considering the substitution rate between grass and concentrates (Delaby et al. Reference Delaby, Peyraud and Delagarde2003b; McEvoy et al. Reference McEvoy, Kennedy, Murphy, Boland, Delaby and O'Donovan2008). Roca-Fernández et al. (Reference Roca-Fernández, González-Rodríguez, Leurent, López-Mosquera, Gallard, Delaby, Goliński, Warda and Stypiński2012) in an experimental trial studying two levels of supplementation under simplified rotational grazing system conditions showed that the difference between milk production for the last day in the paddock and the maxMP was significantly lower for the group of cows fed concentrate (4 kg/cow/day) than for the non-supplemented ones. Hence raising the supplementation reduces the sensitivity of milk production response to the variation of grass offer from one day to another.
CONCLUSIONS
The current results show that the model manages to predict milk production in the context for which it was designed, i.e. intake and milk production of dairy cows in relation to the diet offered in the grass-based systems. The model shows a satisfactory accuracy, considering that diet composition is balanced between energy and protein supplies. Further development of the model could focus on the ‘protein path’ through a consideration of protein supply in grass, forage and concentrate feed, and interactions between energy and protein supplies on milk yield. These developments could also allow prediction of milk composition. Considering the original construction of this model, which takes into account (i) the differences between primiparous and multiparous and the lactating status of dairy cows (beginning v. second part of lactation); and (ii) the fact that milk production is sensitive to variation in feed and herbage offered, the model is able to predict lactation curves at the herd scale under a wide range of different feeding situations. Dynamilk, a model at the farm scale, in addition to the present animal model, includes a dairy herd demographic and a farmer's management sub-model. Dynamilk offers a relevant tool for applied research and extension purposes to assess the possible trade-offs between milk production, feed and forage self-sufficiency and grassland use.
This work was financed by VetAgro Sup and INRA Animal Physiology and Livestock Systems division. The authors thank the referees for their valuable comments that allowed the manuscript to be improved and Wendy Brand-Williams for the final revision of English.