Introduction
Although most of the bark beetle species (Coleoptera: Curculionidae: Scolytinae) found in temperate and boreal forests are innocuous, the activity of aggressive bark beetles results in the destruction of millions of cubic meters of conifer trees per year in production forests around the world (Lieutier et al., Reference Lieutier, Day, Battisti, Grégoire and Evans2004; Blomquist et al., Reference Blomquist, Figueroa-Teran, Aw, Song, Gorzalski, Abbott, Chang and Tittiger2010; Bussler et al., Reference Bussler, Bouget, Brustel, Brandle, Riedinger, Brandl and Muller2011). Given the right conditions, such as increased mature host stands, favorable climate (Carroll et al., Reference Carroll, Taylor, Régniére and Safranyik2004), or increased host availability through thinning operations, forest fires (Santolamazza-Carbone et al., Reference Santolamazza-Carbone, Pestaña and Vega2011; Etxebeste et al., Reference Etxebeste, Álvarez, Pérez and Pajares2012) natural windthrows (Wermelinger, Reference Wermelinger2004), populations boost to epidemic levels and attack is shifted toward healthy trees. Alternatively, those human-competitor bark beetles constitute keystone species in natural ecosystems as they initiate break-down of trees contributing significantly to the foundation of saproxylic habitats (Grove, Reference Grove2002; Foit, Reference Foit2010; Santolamazza-Carbone et al., Reference Santolamazza-Carbone, Pestaña and Vega2011).
Aggregation pheromones are used by some bark beetles to coordinate mass attack on host conifers (Wood, Reference Wood1982; Seybold et al., Reference Seybold, Huber, Lee, Graves and Bohlmann2006). Many of these pheromones are composed of monoterpenoids that are synthesized de novo once colonizing beetles initiate boring through host bark (Blomquist et al., Reference Blomquist, Figueroa-Teran, Aw, Song, Gorzalski, Abbott, Chang and Tittiger2010). In most monogamous bark beetle species, the female begins releasing long-range aggregation pheromones (e.g., Dendroctonus spp.), whereas it is the male that does so in polygamous species (e.g., Ips spp.; Wood, Reference Wood1982). Once nuptial chambers are carved out under the bark, eggs are laid along maternal galleries. Larvae mine the phloem after hatching, and pupate in oval chambers. New adults then chew through the bark and disperse in search of new hosts. Aggregation pheromones seem to benefit bark beetles in a number of ways, e.g. overcoming tree defenses by increasing the number of attacking beetles (Raffa & Berryman, Reference Raffa and Berryman1983), interspecific resource partitioning (Poland & Borden, Reference Poland and Borden1994) or diluting predation (Aukema & Raffa, Reference Aukema and Raffa2004a), but as fellow colonists are attracted, competition increases, especially among non-aggressive bark beetles (Latty, et al., Reference Latty, Magrath and Symonds2009). Besides communication with conspecifics, location of foraging grounds by a diverse guild of eavesdroppers occurs through kairomonal attraction: habitat-specialist predators, host-specific parasitoids and competing subcortical herbivores follow bark beetle infochemicals, endangering their reproductive success (Wood, Reference Wood1982; Poland & Borden, Reference Poland and Borden1994; Ross & Daterman, Reference Ross and Daterman1995; Raffa, Reference Raffa2001). In fact, accumulated evidence suggests that competitors, predators and parasites strongly influence the population and behavioral ecology of bark beetles (Schroeder & Weslien, Reference Schroeder and Weslien1994a, Reference Schroeder and Weslienb; Weslien, Reference Weslien1994; Herard & Mercadier, Reference Herard and Mercadier1996; Reeve, Reference Reeve1997; Boone et al., Reference Boone, Six and Raffa2008). Even if other sensorial cues might be involved (e.g. visual cues; Strom et al., Reference Strom, Roton, Goyer and Meeker1999), subtle nuances of the pheromonal blend composition may allow bark beetles to avoid eavesdropping. For example, different populations of a bark beetle may display geographical or seasonal variations in chiral production and response, as is the case of Ips pini (Vité et al., Reference Vité, Ohloff and Billings1978; Teale & Lanier, Reference Teale and Lanier1991), but more remarkably, this species has been found to escape predators by having divergent chiral preferences (Raffa & Klepzig, Reference Raffa and Klepzig1989). Exploitation of these differences through selective pest removal, enemy augmentation strategies and improved monitoring has been proposed (Aukema et al., Reference Aukema, Dahlsten and Raffa2000a, Reference Aukema, Dahlsten and Raffab; Aukema & Raffa, Reference Aukema and Raffa2005). Minor components of bark beetle aggregation pheromones have also been shown to modify the response of associated species (Seybold et al., Reference Seybold, Teale, Wood, Zhang, Webster, Lindahl and Kubo1992; Allison et al., Reference Allison, Borden, McIntosh, de Groot and Gries2001; Pajares et al., Reference Pajares, Ibeas, Diez and Gallego2004; Etxebeste et al., Reference Etxebeste, Álvarez, Pérez and Pajares2012), but responses of associate species assemblages to common chemical signals, as well as the interactions among those insects, have rarely been studied (Aukema & Raffa, Reference Aukema and Raffa2004a). Although the importance of the variation of pheromone component ratios has long been appreciated (Roelofs, Reference Roelofs1978; Teale et al., Reference Teale, Hager and Webster1994), only a few studies have tried to model coleopteran responses to these gradients. Besides, although many of the infochemicals involved in the communication of several bark beetles have been described, information on the natural proportions among components of the infochemical blends is missing or could be strongly biased by the methodology, which could result in misleading conclusions on behavioral responses to synthetic infochemicals (Pureswaran & Sullivan, Reference Pureswaran and Sullivan2012). A Gaussian curve model has been proposed as a method for measuring the peak width of the response window, and hence describing the stability and variation of the pheromone signal (Schlyter et al., Reference Schlyter, Svensson, Zhang, Knizek, Krokene, Ivarsson and Birgersson2001). This methodology could provide information for the refinement of pheromone formulations, facilitating useful information for enhanced control programs, while allowing the comparison and description of the response profiles of associated species and trophic guilds.
The six-toothed pine bark beetle (Ips sexdentatus Boern.), is a widely distributed species through the Eurasian continent, where it commonly behaves as a secondary pest (Gil & Pajares, Reference Gil and Pajares1986). Nevertheless, outbreaks may occur if suitable conditions are given, as happened after Klaus, a extratropical cyclone that struck south-western France in 2009. A large amount of felled trees prompted an increase in I. sexdentatus population resulting in about additional 3.9 million cubic meters of Pinus pinaster Aiton lost by the end of 2010 caused by the activity of this bark beetle (EFI, 2010). Pioneering works within Ips genus established ipsdienol (Id; 2-methyl-6-methylene-2, 7-octadien-4-ol) as the main pheromonal component regulating I. sexdentatus aggregation (Vité et al., Reference Vité, Bakke and Renwick1972, Reference Vité, Bakke and Hughes1974), thereafter its attractiveness has been confirmed in several field experiments (Vité et al., Reference Vité, Bakke and Hughes1974; Klimetzek & Vité, Reference Klimetzek and Vité1986; Etxebeste et al., Reference Etxebeste, Álvarez, Pérez and Pajares2012). Even if racemic ipsenol (Ie; 2-methyl-6-methylene-7-octen-4-ol) has been detected in hindgut and frass extracts of this species (Vité et al., Reference Vité, Bakke and Renwick1972; Francke et al., Reference Francke, Pan, Bartels, Konig, Vité, Krawielitzki and Kohnle1986; Kohnle, Reference Kohnle1991), its synergic effect on the aggregation power of Id has not been shown until recently (Etxebeste et al., Reference Etxebeste, Álvarez, Pérez and Pajares2012). Absolute figures for I. sexdentatus sex-ratios responding to aggregation pheromones have been provided (e.g. Klimetzek & Vité, Reference Klimetzek and Vité1986), but detailed studies are missing. Even if the response to certain infochemicals of some predators and other species associated with I. sexdentatus has been described (Pajares et al., Reference Pajares, Ibeas, Diez and Gallego2004; Ibeas et al., Reference Ibeas, Gallego, Diez and Pajares2007; Etxebeste & Pajares, Reference Etxebeste and Pajares2011; Etxebeste et al., Reference Etxebeste, Álvarez, Pérez and Pajares2012), information of additional associated saproxylic beetles is also missing.
Thus, an experiment evaluating multiple funnel trap-catches of I. sexdentatus and associated beetles was conducted in order to study the response to experimental lures with varying components of the I. sexdentatus pheromone complex at community, guild and species levels. In other words, the objectives of this research were to (i) characterize the intra-specific response of I. sexdentatus, describing response maxima and variations in the sex ratio; (ii) characterize the inter-specific response of saproxylic beetle species; (iii) determine changes in the guild structure; and (iv) study the species assemblage change through the evaluated compound gradient.
Materials and methods
Study area and experimental design
The experiment took place between 6 August and 20 September 2008, and was carried out at a site in northwestern Spain, approximately enclosed within the square defined by the 29T 7390 4729 coordinates of the Universal Transverse Mercator system, ranging in elevation from 1050 to 1130 m. a.s.l. The area was mainly composed of reforested stands of about 30-year-old Pinus nigra salzmannii J. F. Arnold, although a few ca. 50-year-old P. pinaster stands could also be found among patches of Quercus pyrenaica Willd. A large fire burned across the area 2 years before, providing large amount of breeding material for I. sexdentatus, and hence its population level was still high at the onset of the experiment, reflected on a few bark beetle infestation foci present in the area. The mean day temperature through the experimental period averaged 17.5 °C, while minimum and maximum temperatures averaged 10.5 and 24.5 °C, respectively (Leon Airport, Castile and Leon, Spain).
A total of seven experimental blocks were located along firebreaks and dirt roads that held uniform conditions across the experimental sites. Within each block, seven 12-unit multiple funnel traps (Former Phero Tech Inc., now Contech Enterprises Inc., British Columbia, Canada; Lindgren, Reference Lindgren1983), suspended 2 m above ground from metal poles and spaced >75 m apart, comprised the sampling units of the study. In order to test for the effects of the temporal variation in pheromone composition, lures containing increasing percentages of racemic Ie in relation to the total blend of Ie and racemic Id were designed together with chemists at SEDQ LLC (Barcelona, Spain). Selected percentage levels were defined after the natural evolution of the emission of these compounds from logs colonized by I. sexdentatus (Kohnle, Reference Kohnle1991; Etxebeste et al., unpublished data), and previous results that defined a pheromonal lure of I. sexdentatus (Etxebeste et al., Reference Etxebeste, Álvarez, Pérez and Pajares2012). In order to avoid a confounding effect on the response of I. sexdentatus, the main pheromonal compound (Id; Vité et al., Reference Vité, Bakke and Hughes1974) was kept at a constant dosage through tested blend percentages (95 mg per lure sachet, resulting in ca. 1.1 mg day−1 release rate). The first 0% level carried no Ie, while increasing Ie amounts released from separate devices helped obtain the selected remaining 1, 5, 10, 50, 90 and 95% Ie levels. For the 1, 5 and 10% Ie levels, closed 250 μl polyethylene (PE) vials were loaded with 1, 5 and 10.5 mg of Ie. Remaining levels were prepared loading Ie into aluminum sachets with PE windows varying in size: for the 50% level 95 mg of Ie were loaded in a sachet with the same window size as in the design used for Id; for the 90 and 95% Ie levels 440 mg of Ie were loaded into two and four sachets with larger PE windows, respectively. The performance of the release devices had been tested during previous works carried in the same experimental area (Etxebeste et al., Reference Etxebeste, Álvarez, Pérez and Pajares2012.). All infochemical purities were reported to be above 95% (SEDQ LLC.). The resulting seven treatment levels were then randomly assigned to each sampling unit. To provide a blank control, traps were not baited until the second week of the experimental period. To reduce positional effects, re-randomizations of the assigned sampling units to treatments were implemented every week, and both, traps and lures, were moved to the resulting new positions within experimental blocks. Sample collection was conducted on a weekly basis, and these were preserved in 70% ethanol until identification and counting.
Taxonomic classification was undertaken by specialists, and beetles were identified to species level according to the nomenclature of the Fauna Europaea Web Service (2010). In addition, all I. sexdentatus individuals were sexed under the stereo microscope by checking the elytral spine structure (Gil & Pajares, Reference Gil and Pajares1986). Saproxylic and non-saproxylic beetles were distinguished using different resources (e.g., Dajoz, Reference Dajoz2000; Kenis & Hilszczanski, Reference Kenis, Hilszczanski, Lieutier, Day, Battisti, Grégoire and Evans2004; Nieto & Alexander, Reference Nieto and Alexander2010). Each species was assigned to a trophic group (guild) according to those proposed by Bouget et al. (Reference Bouget, Brustel and Nageleisen2005), and thus falling into one of four main guilds: saproxylophages, xylofungivores, xylophages, and predators. Xylophages in turn, were further classified as intraguild competitors or intraguild predators, based on the potential ability of certain xylophage larvae to act as facultative predators of other phloem inhabiting species (e.g., Dodds et al., Reference Dodds, Graber and Stephen2001). As many species might switch between guilds depending on their life stage, categorization was made regarding the closest linkage to I. sexdentatus (e.g., if the adult of a certain Buprestidae species is known to feed on pollen, but larvae grow on woody cambium, the species was assigned to the xylophage guild). However, because both larval and adult ecology for many captured species are largely unknown, the description of anatomical structures of collected taxa and the ecology of closely related species were also used in guild classification. Voucher specimens have been deposited at the Entomology Collection of the Department of Plant Production and Forest Resources of the University of Valladolid.
Statistical analysis
Data from the multiple funnel traps were pooled for the experimental period and insect count sums per treatment and experimental block were used as the response variable in a series analysis aimed at studying the effect of varying Ie percentages in the pheromonal blend at the species, trophic guild and species assemblage level. All calculations and analyses were carried out under the R statistical environment and language (The R Development Core Team, 2011).
Species response
Statistical analyses at the species level were only conducted on those taxa with a minimum of 20 specimens caught over the experimental period. Differences in mean number of accumulated individuals between Ie percentage levels were tested with multiple comparison of means (Tukey HSD), applying the Bonferroni correction to the value of α for the confidence intervals (Reeve & Strom, Reference Reeve and Strom2004) in a generalized linear model (GLM) using the log-link function to account for the Poisson error structure. In the case of I. sexdentatus sex-ratio analysis, data were fitted in a GLM using logit-link function to account for a binomial error structure (Crawley, Reference Crawley2007). Species (and I. sexdentatus sex-ratio) data were additionally fitted to the Gaussian model described by Schlyter et al. (Reference Schlyter, Svensson, Zhang, Knizek, Krokene, Ivarsson and Birgersson2001) through non-linear regression. Such a model allows for the location of peaks (μr) and widths (2σr) of the response window of analyzed species. In order to allow fitted models to be comparable across different species, raw data were scaled dividing the response variable by the maximum empirical value within each experimental block. Modeling of I. sexdentatus sex-ratio was performed with the raw male-to-female catch ratio. As the explanatory variable, proportion (p) of Ie in the lure, did not meet with the assumption of normality, it was transformed taking the arcsin of the square root of p. Modeling was performed following the non-linear least squares (NLS) method using the Gauss–Newton algorithm. Prior to the analysis, dot-plots aided at setting the starting parameters for the non-linear regression and discarding species that did not show a Gaussian response, which in turn were analyzed through linear regression with the aim of describing dose–response relationships.
Guild structure
Accumulated catches per defined guild were analyzed following the same methodology described for species. Equivalently, their response toward increasing percentages of Ie, was modeled according to the described procedure for intraguild competitors, intraguild predators and predator guilds. In order to allow comparison with the described response for I. sexdentatus, it has to be noted that the intraguild competitors group did not include this species. Detritivore, saproxylophage, and xylofungivore guild response modeling have not been included because of low accumulated catch data, and lack of apparent differentiated response to the tested Ie gradient. In addition, the effect of varying Ie percentage in lures on diversity within guilds was estimated using the Shannon index, evaluated through GLM and Tukey HSD, as in previous analyses.
Species assemblages
Singletons and doubletons (species captured only once or twice) were removed from the set of tallied saproxylic beetle species prior to the analysis. Treatment effect on assemblage composition was analyzed using Adonis. This type of analysis, analogous to MANOVA multivariate analysis of variance, allows for a multivariate permutational analysis of the assemblage variation attributed to experimental treatments (Oksanen et al., Reference Oksanen, Roeland, Legendre, O'Hara, Simpson, Solymos, Stevens and Wagner2008). In order to create the required dissimilarity matrix, Arrhenius z beta-diversity was calculated for all pairwise comparisons of the treatment level, which was further analyzed using Adonis set to 999 permutations. Beta-diversity was chosen as the measure for dissimilarity, as it accounts for the differentiation in composition among habitats. An ordination plot using no-metric multidimensional scaling (NMDS) of the Bray–Curtis dissimilarity index of Wisconsin transformed data was also produced (Oksanen et al., Reference Oksanen, Roeland, Legendre, O'Hara, Simpson, Solymos, Stevens and Wagner2008). To this ordination, ellipses representing factor class standard error areas at 95% confidence intervals were added. Ipsenol percentage in the lure was also fitted to distance matrix using the envfit function of the vegan package (Oksanen et al., Reference Oksanen, Roeland, Legendre, O'Hara, Simpson, Solymos, Stevens and Wagner2008).
Results
Species response
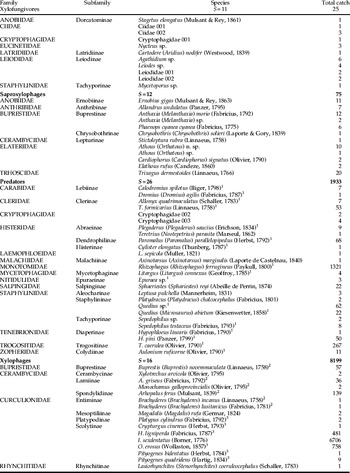
Traps caught virtually no beetles during the initial week of the experiment, when no lures were attached to traps. During the remaining experimental period, 101 beetle species (10,533 specimens) were captured, 10,232 of which (97%) were classified as saproxylics, pooled into 65 distinct taxa (table A.1). Although for 24 differentiated taxa the species could not be established, at least one new elaterid species was identified among trapped beetles (Athous (Orthatous) n. sp.; Sáez Bolaño J. A., personal communication). As could be expected from using its major pheromonal compounds, I. sexdentatus comprised 63% of all captured beetles, whereas those species with capture levels above 20 individuals made up 98% of the total of trapped specimens.
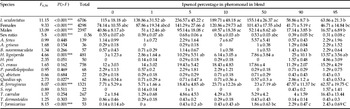
Significant treatment effects could be detected for I. sexdentatus catches (table 1). Total male and female catches were found to be highest when 5% Ie was present in the lure, although these figures were not significantly different from close blends (table 1). Even if differences among treatments were similar for male and female I. sexdentatus, sex-ratio varied significantly, achieving its lowest value at the 95% Ie level, with ca. 3 females captured per male (table 1). From the remaining taxa, only Hylurgus ligniperda, Quedius sp., Rhizophagus ferrugineus and Thanasimus formicarius were found to be significantly affected by the Ie proportion in the pheromonal blend. Means could not be separated for Quedius sp. (table 1).
Effect of increasing Ie proportion in lures on mean accumulated catches ± SEM (n = 7) of I. sexdentatus (total, female, male and sex ratio) and other known saproxylic beetles. Shown species had accumulated catches of 20 or more individuals. See Appendix Table A1 for full scientific names and classifications. F and P(>F) values of the treatment effects at the analysis of variance (ANOVA) of fitted GLM are presented for each species. Asterisks after P(>F) values highlight: *, <0.05; **, <0.01 and ***, <0.001 significances. Shared letters within the same species indicate that means are not significantly different (Tukey's HSD test, Bonferroni's adjustment, P < 0.05).

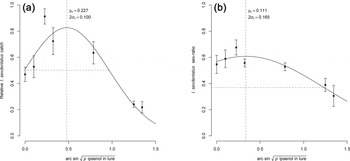
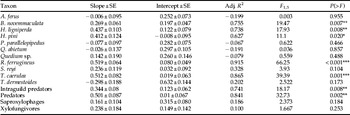
Profiling of the response of species with total capture levels over 20 specimens showed that modeling of their response would not be possible in all cases. Only I. sexdentatus, Acanthocinus griseus, Orthotomicus erosus and T. formicarius responses could be fitted to the Gaussian curve (table 2). The I. sexdentatus response profile showed the characteristic bell-shaped profile (fig. 1a), and the response peak (μr) could be set at 0.227 Ie/Id + Ie, not far from its sex-ratio peak (μr = 0.111; fig. 1b). The dose–response relationship of the remaining taxa was studied using linear regression (table 3). The accumulated catches of Buprestis novemmaculata, H. ligniperda, R. ferrugineus, and Temnochila caerulea were found to be positively correlated with Ie proportion in the lure (table 3).
Accumulated trap-catch data and the sex-ratio of I. sexdentatus in response to increasing proportions of Ie in the pheromonal blend. Back-transformed location of the response peaks (μr) and width (2σr) of the response window are shown in the plot. (a) Mean relative I. sexdentatus catch ± SEM (n = 7) and fitted Gaussian response curve. (b) Registered and predicted sex-ratio for I. sexdentatus after fitting the Gaussian curve. Catch data (y-axis) were rescaled so that the treatment with highest catch = 1 for each data set. See table 2 for parameter estimates.

Parameter estimates with their SE and goodness of fit of non-linear regression of Gaussian curve to response of I. sexdentatus (total, male and females) and other known saproxylic beetles. Cumulative response of intraguild competitors is also shown. In all cases, three and four regression and residual degrees of freedom, respectively.

1 Values retransformed from the arcsin of the square root of p.
Parameter estimates with their SE and goodness of fit of linear regression of the response of trapped saproxylic beetles and trophic guilds that did not show a Gaussian response. In all the cases, one and five regression and residual degrees of freedom, respectively. Asterisks after P(>F) values highlight: *, <0.05; **, <0.01 and ***, <0.001 significances.

Guild structure
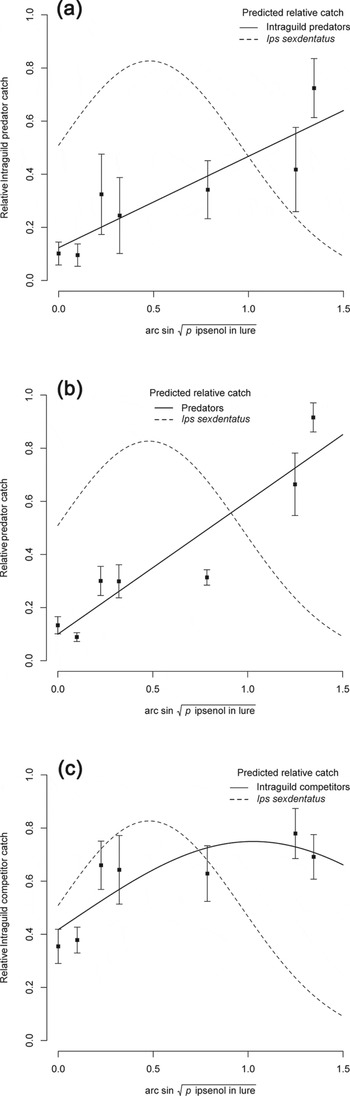
Xylophage and predator guilds followed catch trends seen for I. sexdentatus and R. ferrugineus (table 1), the most abundant species within each guild, respectively (table 4 and table A.1). Remaining guilds occurred in low numbers with no apparent variation in their response (table 4). Alternatively, Shannon index analysis revealed a significant increase in xylophage diversity with increased Ie percentage (table 5). Beyond the initial classification of captured taxa within the four main saproxylic guilds, those captured beetle species that have been shown to interact with conifer bark beetles were further tabulated into the three trophic groups related to I. sexdentatus and prone to detect its pheromones (table A.1; Herard & Mercadier, Reference Herard and Mercadier1996; Kenis et al., Reference Kenis, Wermelinger, Grégoire, Lieutier, Day, Battisti, Grégoire and Evans2004). As shown in tables 2 and 3, modeling of the response of intraguild competitor and predators, and of the selected species of the predatory guild showed that the Gaussian curve could be fitted for competitors peaking close to that of I. sexdentatus, whereas both groups of potential I. sexdentatus predators showed a positive linear relationship with Ie percentage (fig. 2). Although a significant effect on the capture level could not be detected (table 4), the number of saproxylophages showed a positive significant linear relationship with the Ie percentage (table 3).
Accumulated trap catches of competitor and predator guild associates and their modeled linear and Gaussian fitting in response to increasing proportions of ipsenol in the pheromonal blend. Predicted I. sexdentatus response is also shown for comparison. (a) Intraguild (xylophage) predator response. (b) Predator response. (c) Intraguild (xylophage) competitor response. See Materials and methods section for guild descriptions. Catch data (y-axis) were rescaled so that the treatment with highest catch = 1 for each data set. See tables 2 and 3 for parameter estimates.

Effect of increasing Ie proportion in lures on mean accumulated catches ± SEM (n = 7) of the five main trophic groups. Asterisks after P(>F) values highlight: *, <0.05; **, <0.01 and ***, <0.001 significances of treatment effects. Shared letters within the same guild indicate that means are not significantly different (Tukey's HSD test, Bonferroni's adjustment, P < 0.05).

Effect of increasing Ie proportion in lures on mean Shannon diversity index ± SEM (n = 7) within each trophic group Asterisks after P(>F) values highlight: *, <0.05; **, <0.01 and ***, <0.001 significances of treatment effects. Shared letters within the same guild indicate that means are not significantly different (Tukey's HSD test, Bonferroni's adjustment, P < 0.05).

Species assemblages
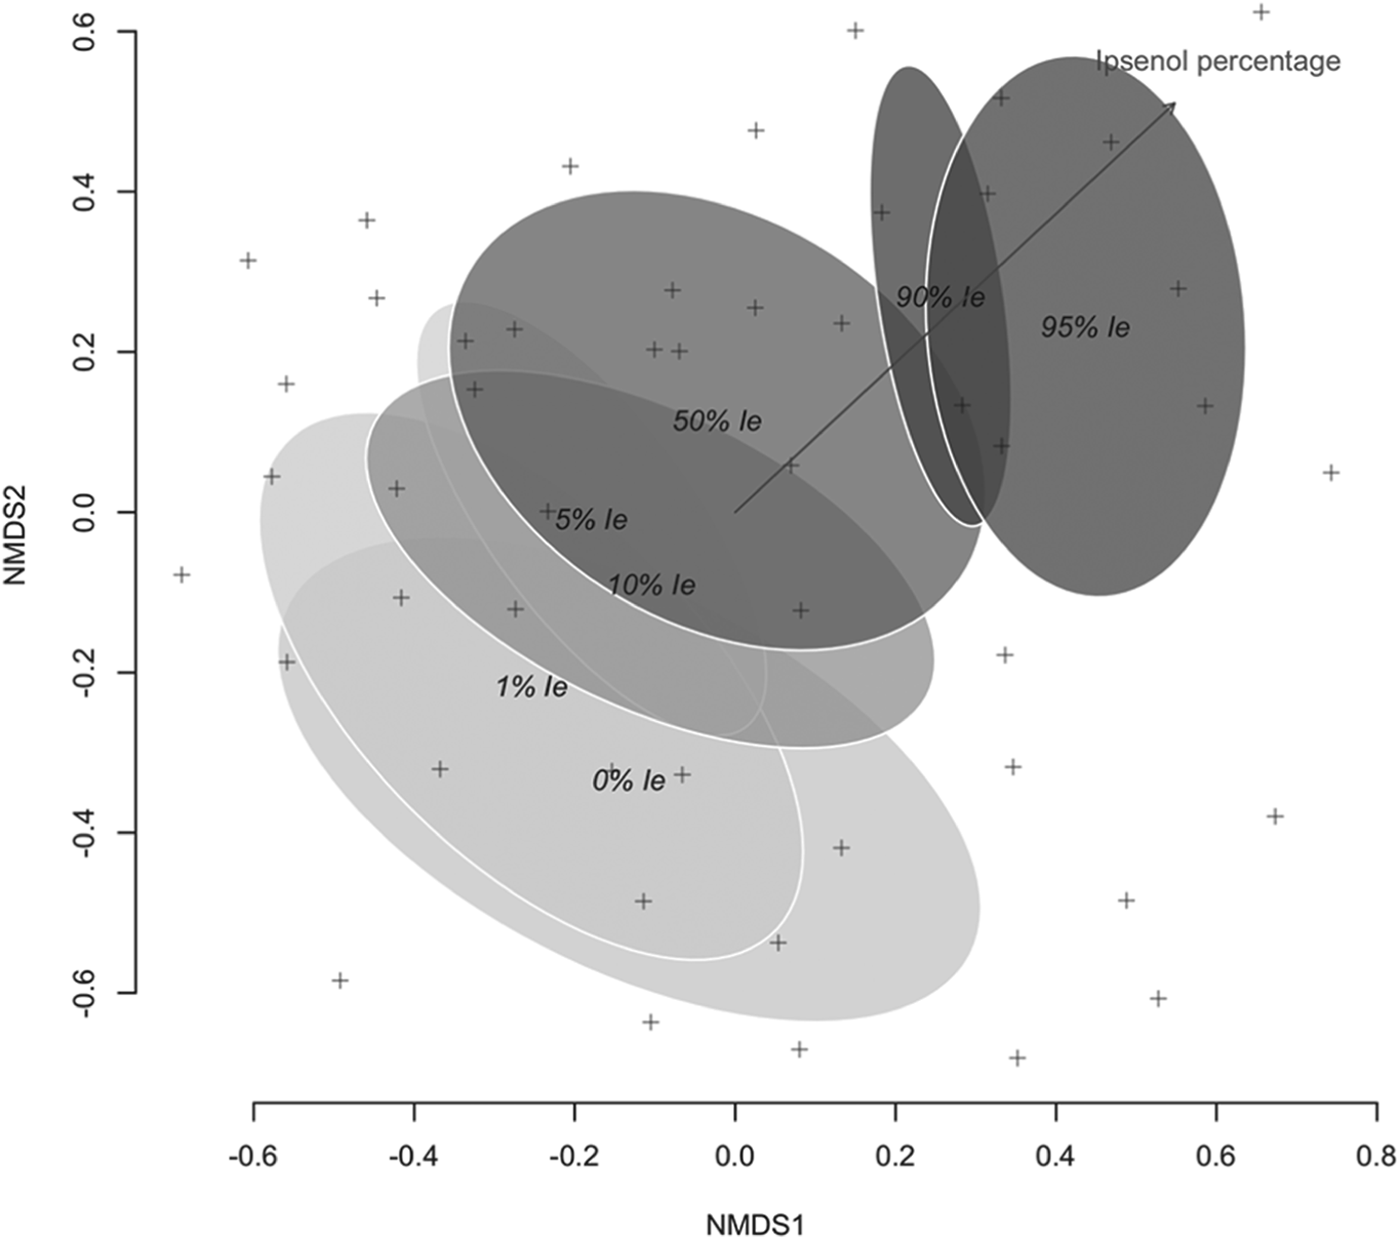
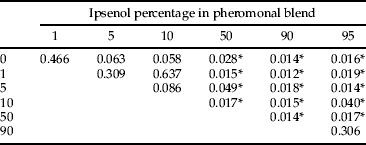
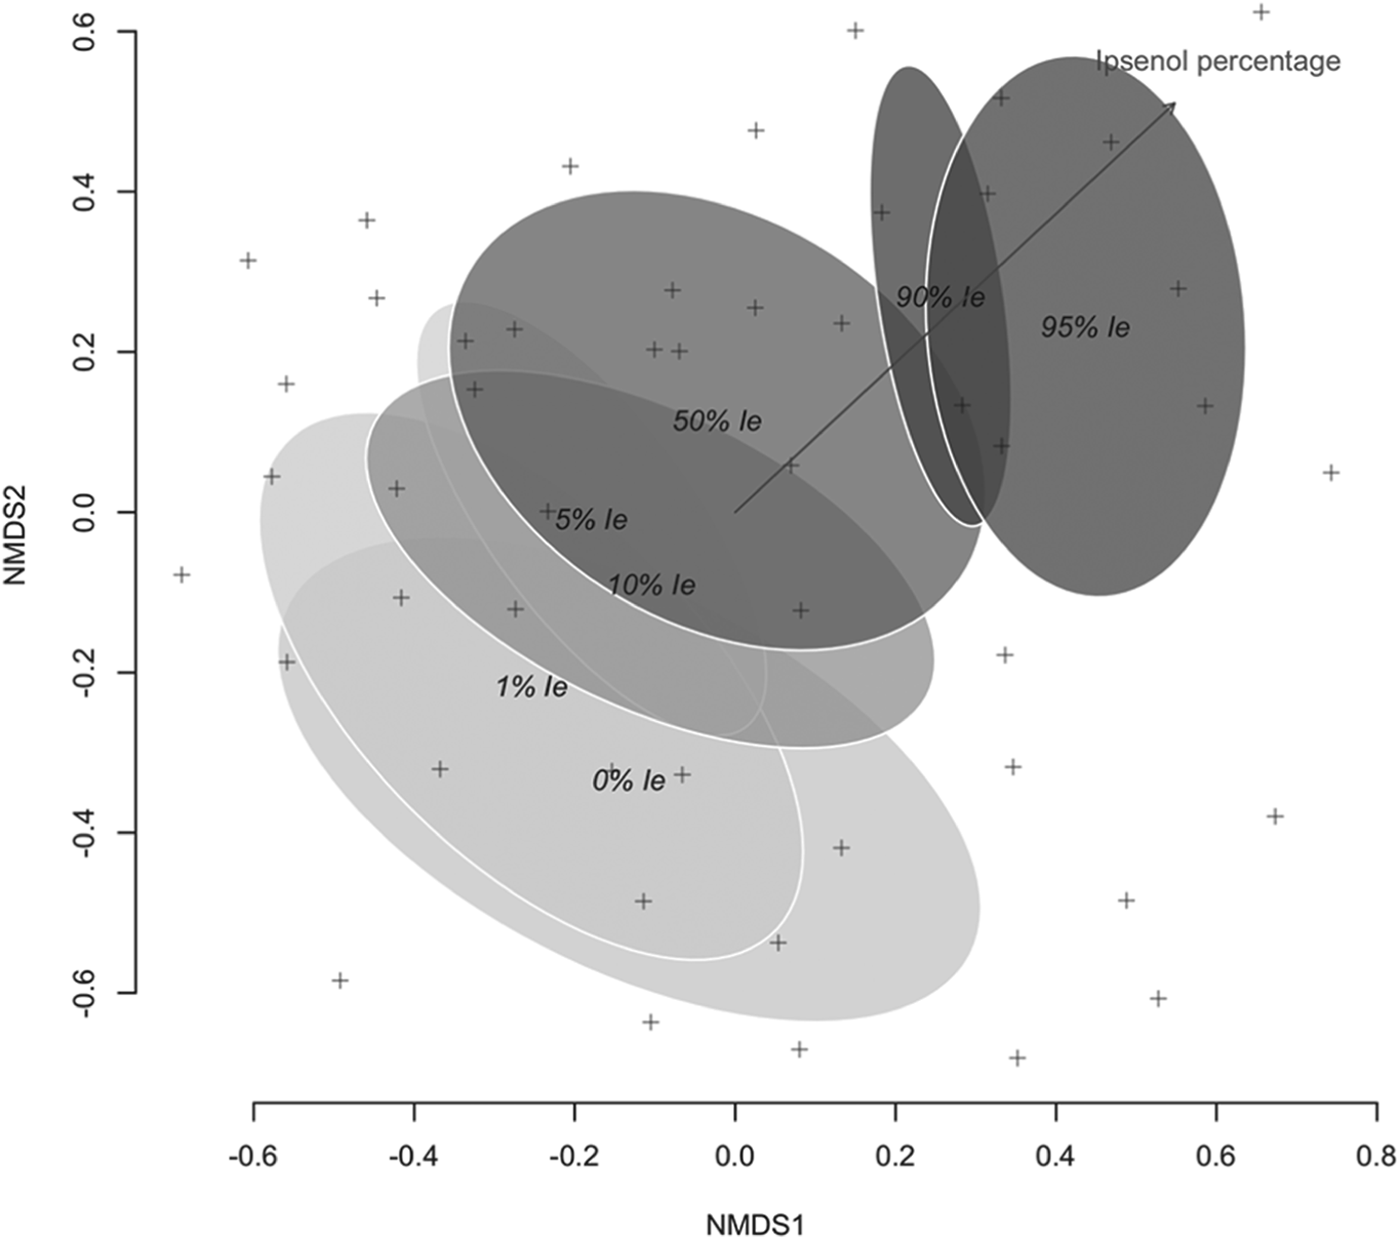
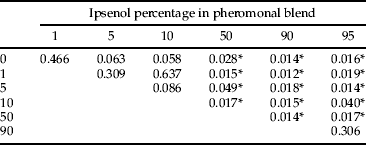
The composition of beetles differed between levels of tested Ie percentages, and three clear groups could be established after Adonis (table 6). Low levels of Ie (0–10%) harbored compositions that could not be distinguished. Alternatively, the saproxylic beetle assemblages responding to 50, 90 and 95% Ie levels differed from this group and showed their own composition. The ordination of the data sets for the 49 experimental units and the subsequent fitting of the Ie percentage level as an explanatory factor confirmed results from Adonis (fig. 3).
Ordination of Bray–Curtis similarities (stress 0.268) of species and specimen abundance at multiple funnel traps using NMDS. Each cross represents each of the 49 sampling units. Ellipses represent factor class standard error area at 95% confidence interval, after fitting the Ie percentage in the lure as a factor onto the ordination (shown vector, R 2 = 0.58, P < 0.001, 1000 permutations).
P values of pairwise comparison tests (ADONIS, 1000 permutations) of saproxylic beetle beta diversity between treatment levels.
Discussion
Our results provide new evidence of the role of I. sexdentatus infochemicals, could have in the attraction of several species lead to the establishment of its associated saproxylic beetle community, while assessing the response windows of the targeted bark beetle and that of a diverse assemblage of species belonging to different trophic guilds. Even if some of the captured beetles could have been randomly intercepted by multi-funnel traps, or through the visual attraction exhorted by the trunk-like silhouette of the trap (Strom et al., Reference Strom, Roton, Goyer and Meeker1999), the almost complete lack of captures in unbaited traps during the first experimental week, and their overlapping life histories, suggests an underlying kairomonal attraction of many of the tallied beetles. Many bark beetles have a well-known role in founding the saproxylic habitat, and hence it would not be surprising that a cohort of saproxylic beetles could use their infochemicals, in addition to those of their plant hosts, to locate appropriate foraging grounds (Wood, Reference Wood1982; Grove, Reference Grove2002; Seybold et al., Reference Seybold, Huber, Lee, Graves and Bohlmann2006; Foit, Reference Foit2010). In any case, significant response changes to tested infochemical proportion range could only be proven for a few species. The vast majority of registered specimens corresponded to saproxylic taxa (table A.1), from which many have been listed in earlier studies and reviews describing bark beetle associated entomofauna (Herard & Mercadier, Reference Herard and Mercadier1996; Kenis et al., Reference Kenis, Wermelinger, Grégoire, Lieutier, Day, Battisti, Grégoire and Evans2004; Foit, Reference Foit2010; Santolamazza-Carbone et al., Reference Santolamazza-Carbone, Pestaña and Vega2011). The discovery of a new elaterid species (Athous (Orthatous) n. sp.), together with the capture of the rare Lathropus sepicola (Baena et al., Reference Baena, Lencina and Andújar2011), Chrysanthia reitteri (Oedemeridae) and Pachybrachis (Pachybrachis) suffrianii (Chrysomelidae), endemisms to the Iberian Peninsula (Lencina et al., Reference Lencina, Gallego and Andújar2008), among ca. 100 identified species in a single experiment covering just part of I. sexdentatus’ flight period, and using just two of the infochemicals involved in its communication (Francke et al., Reference Francke, Pan, Bartels, Konig, Vité, Krawielitzki and Kohnle1986), somewhat illustrates the relatively little sampling effort received historically by the saproxylic beetle group in this region. Furthermore, even if the experimental period covered the peak of I. sexdentatus flight period, catches of some of its most important natural enemies were probably lower than what they could have been if sampling had been performed earlier or the experiment had lasted longer, e.g. very few T. formicarius were caught (grand total of 53 individuals) in comparison with trials performed in the same experimental area during spring and early summer (Etxebeste & Pajares, Reference Etxebeste and Pajares2011; Etxebeste et al., Reference Etxebeste, Álvarez, Pérez and Pajares2012).
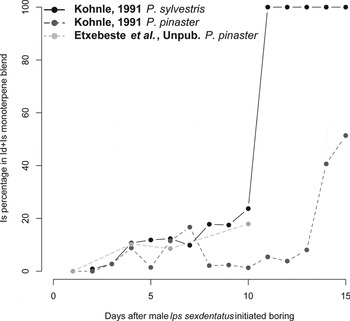
The results obtained are in agreement with previous findings for the response of I. sexdentatus to the combined Ie and Id release, which pointed that highest catches were obtained when Ie:Id ratio values were close to natural, although the response peak could not be established (Vité et al., Reference Vité, Bakke and Renwick1972; Kohnle et al., Reference Kohnle, Meyer and Kluber1992; Etxebeste et al., Reference Etxebeste, Álvarez, Pérez and Pajares2012). Figure 4, describing the evolution of the Ie proportion in the blend released by I. sexdentatus males boring into two different hosts (Kohnle, Reference Kohnle1991; Etxebeste et al., unpublished data), could provide the rationale behind the registered response maxima as well as for the parameter estimates of fitted Gaussian curve models. The response peak for both female and male I. sexdentatus was predicted to lie around the 20% Ie value (fig. 1), which would correspond to the registered blend released between days 5 and 10 of colonization, which in turn corresponds to the observed aggregation phase of the beetle (Wood, Reference Wood1982; Francke et al., Reference Francke, Pan, Bartels, Konig, Vité, Krawielitzki and Kohnle1986; Kohnle, Reference Kohnle1991). In addition, the release rate of Id has been found to apparently peak 3–7 d after male settlement (Kohnle, Reference Kohnle1991). Volatiles released during the first week after pioneer arrival have been studied in detail for Ips typographus (Birgersson et al., Reference Birgersson, Schlyter, Lofqvist and Bergstrom1984; Birgersson & Bergstrom, Reference Birgersson and Bergstrom1989), showing too that highest pheromone release rates occurred 3–4 d after the carving of nuptial chambers. Both quantitative and qualitative change in the pheromone signal during initial colonizing days could provide bark beetles with the information on the substrate status. The sequence and mode in which pioneer beetles settle strongly modifies their reproductive success and survival (e.g., Aukema & Raffa, Reference Aukema and Raffa2004a, Reference Aukema and Raffab; Latty et al., Reference Latty, Magrath and Symonds2009; Latty & Reid, Reference Latty and Reid2009). Yet, it is not clear whether pioneering confers any net advantage in reproductive success, as on the one hand pioneering Dendroctonus ponderosae were found to have reduced broods in comparison with early responders (Latty & Reid, Reference Latty and Reid2009), while on the other hand, an increased risk for predation with time of arrival in responding males of I. pini has been reported (Aukema & Raffa, Reference Aukema and Raffa2004b). Furthermore, as colonization proceeds, and the density of attackers increases, the number of eggs may decrease exponentially (Jactel & Lieutier, Reference Jactel and Lieutier1987). Registered response for I. sexdentatus reveals that the largest proportion of males got trapped at the pheromonal blend corresponding to the early stages of substrate colonization (fig. 1b), but also during the lowest predatory guild response (fig. 2). Catch maxima are reached ‘later’ at the cost of suffering higher rates of predation, but specially competition (fig. 2; Schroeder & Weslien, Reference Schroeder and Weslien1994a; Dodds et al., Reference Dodds, Graber and Stephen2001; Raffa, Reference Raffa2001; Aukema & Raffa, Reference Aukema and Raffa2004b). In other words, both modeled responses and the Ie percentage evolution in fig. 4 suggest that released pheromone blend is low in Ie while pioneering I. sexdentatus males initiate boring, then male I. sexdentatus responders gradually join the pioneers, facing the risk posed by host defenses but avoiding excessive competition. As colonization proceeds and Ie percentage increases in the pheromonal blend, proportionally more female I. sexdentatus arrive to a defenseless colonization spot, but facing higher competition and predation. Similar reflection of the steps in the behavioral sequence linked to changes on the proportions of the pheromone components has been reported for Dendroctonus frontalis (Pureswaran & Sullivan, Reference Pureswaran and Sullivan2012).
Temporal evolution of the percentage of Ie in relation to Id in frass extracts of boring I. sexdentatus males. Data from Kohnle (Reference Kohnle1991) obtained through closed-loop stripping analysis , followed by filter extraction by MeCl and CS2 in P. pinaster and P. sylvestris, respectively, and GC-MS. Unpublished data from Etxebeste et al. obtained through solid-phase microextraction of frass samples of two series of six I. sexdentatus males boring into a P. pinaster 50 cm long bole each.

The responses registered for associated species further support the scenario described for the aggregation of I. sexdentatus and for the role of the changing pheromonal component proportion may have on it. Even if significant changes in response were detected only on nine of the captured species, in addition to signaling for the colonization phase, I. sexdentatus seems to avoid natural enemy and competing taxa also through a tuned pheromonal signal. Correspondingly, potential intraguild predators, such as A. griseus (Fabricius) or B. novemmaculata L., showed highly differentiated response profiles to that of I. sexdentatus, as their modeled response window were found to be positively correlated with or peaked at higher Ie proportion values (tables 2 and 3). Although a few studies have evaluated the impact on bark beetle larval survival of associated phloem feeder larvae, very high reductions on brood survival have been reported (Schroeder & Weslien, Reference Schroeder and Weslien1994a; Dodds et al., Reference Dodds, Graber and Stephen2001). Predatory species too followed the same pattern. While predator diversity does not change through the Ie gradient (table 5), both accumulated predator guild and main predator (i.e. R. ferrugineus, T. formicarius and T. caerulea) responses increased with Ie percentage. Furthermore, 40% of registered saproxylic beetles belonged to this guild (table A.1), although only a few had accumulated catches above the arbitrarily set 20 individual threshold. T. formicarius and T. caerulea have been previously described to follow a similar pattern (Etxebeste et al., Reference Etxebeste, Álvarez, Pérez and Pajares2012). Although attraction of R. ferrugineus to host volatiles had been reported before (e.g., Schroeder & Weslien, Reference Schroeder and Weslien1994b), the presented results provide the first evidence of this species being kairomonally cued to bark beetle pheromone components, which captured an especially large number of individuals (table 1). A similar conclusion can be reached when the results for Hypophloeus pini are considered. The genus is known to prey on bark beetles (Kenis et al., Reference Kenis, Wermelinger, Grégoire, Lieutier, Day, Battisti, Grégoire and Evans2004), but to our knowledge, kairomonal attraction has not been reported earlier. In addition, and although results have not been included in order to restrict the scope to coleopteran species, Scoloposcelis pulchela (Heteroptera, Anthocoridae), known for preying on bark beetle larvae (Herard & Mercadier, Reference Herard and Mercadier1996; Kenis et al., Reference Kenis, Wermelinger, Grégoire, Lieutier, Day, Battisti, Grégoire and Evans2004), was captured in large numbers, and showed a positive linear relationship with Ie too.
The diversity of xylophages increased significantly along the Ie gradient (table 5), while competitor species response peaked at intermediate values (fig. 2c). H. ligniperda and O. erosus were the two main competitor species caught in the study. Kairomonal attraction to I. sexdentatus pheromonal components has been reported earlier for H. ligniperda (Etxebeste et al., Reference Etxebeste, Álvarez, Pérez and Pajares2012), and according to the results presented in this work, this secondary bark beetle shows a positively correlated response with Ie proportion. In previous trials, Ie alone was found to attract less individuals than when released along with Id (Etxebeste et al., Reference Etxebeste, Álvarez, Pérez and Pajares2012). Taken together, these results suggest that H. ligniperda may eavesdrop on I. sexdentatus and arrive at colonization spots once its settlement has finished, and taking advantage of a weakened host. As for O. erosus’ response, it was not strongly affected by the change in the pheromone blend (table 1), confirming previous reports (Etxebeste et al., Reference Etxebeste, Álvarez, Pérez and Pajares2012). This bark beetle requires another infochemical, 2-methyl-3-buten-2-ol, in addition to Id for its pheromone (Klimetzek & Vité, Reference Klimetzek and Vité1986; Seybold et al., Reference Seybold, Huber, Lee, Graves and Bohlmann2006). Even so, its response could be modeled to a response peak close to the 40% Ie level, which was thus differentiated from the response peak for I. sexdentatus.
In addition, all these functional changes in the responses of species and trophic guilds were reflected in the results of assemblage analysis. Three main groups could be differentiated (table 6; fig. 3), which corresponded to (i) the area of I. sexdentatus maximal response (0–10% Ie), (ii) the competitor area (50% Ie), and (iii) the predator group area (90 and 95% Ie). Thus, beyond the described responses of saproxylic species and guilds, well-differentiated species assemblages were caught along the Ie gradient, highlighting the role of I. sexdentatus infochemicals in assisting resource partitioning.
Although Ie has been associated with the pheromone of Ips and other bark beetle genera (e.g., Francke et al., Reference Francke, Pan, Bartels, Konig, Vité, Krawielitzki and Kohnle1986; Seybold et al., Reference Seybold, Huber, Lee, Graves and Bohlmann2006) is not but one of the several volatile compounds with behavioral effects detected for I. sexdentatus (Kohnle, Reference Kohnle1991). A far more complex signal scenario arises when other infochemicals are considered. On the one hand, host volatiles are used by several guilds to locate foraging grounds (e.g. Schroeder & Weslien, Reference Schroeder and Weslien1994b), while on the other hand, derivative volatiles emitted by bark beetles, as for example, cis-verbenol, do enhance bark beetle response (I. sexdentatus) but are also used by natural enemies to locate their prey (T. caerulea; Etxebeste et al., Reference Etxebeste, Álvarez, Pérez and Pajares2012). Moreover, many of the infochemicals involved have stereoisomers, to which bark beetles can respond in a specific manner aiding them escape from predators or competitors (Raffa & Klepzig, Reference Raffa and Klepzig1989; Raffa, Reference Raffa2001). Furthermore, a recent report has shown how secondary species that join the pioneering bark beetles may exert negative effects in addition to mere competition, as their pheromone components may attract third-party predators that influence reproductive success of pioneers (Boone et al., Reference Boone, Six and Raffa2008). In summary, even if presented results do reflect the steps seen in bark beetle settlement in terms of pheromone blend change, the complete representation of this process would involve the description of the responses of each of the associated species in terms of enantiomeric composition, synergists, kairomones, concentrations, and variations in space and time (Raffa, Reference Raffa2001).
The implications of detailed characterization of the response to pheromone blends in bark beetle management have been previously recognized (Raffa & Klepzig, Reference Raffa and Klepzig1989; Grégoire et al., Reference Grégoire, Couillien, Drumont, Meyer and Francke1992). On one side, figures derived from monitoring programs aimed to estimate both scolytid and associated beetle populations based on pheromone-baited traps are probably inaccurate, and need to be adjusted to response disparities and, on the other, the use of pheromones as the control method by mass-trapping and related tactics is frequently hindered by the negative impact that these programs have on natural enemy populations (Raffa & Klepzig, Reference Raffa and Klepzig1989; Etxebeste et al., Reference Etxebeste, Álvarez, Pérez and Pajares2012). Furthermore, the capture of rare species that might be associated with I. sexdentatus founded habitats in a rather ‘small’ experiment raises the question of what consequences these programs could have on the conservation of saproxylic species. Excessive forest hygiene or salvage logging has been pointed to as causes of loss of mature timber, which hosts many of those species (Grove, Reference Grove2002; Foit, Reference Foit2010). Appropriate hosts in managed stands occur highly dispersed temporarily and geographically, especially for secondary bark beetles such as I. sexdentatus, which normally require a weakened host to settle. Thus, artificial bark beetle ‘foundations’, i.e. pheromone-baited traps, might produce an unwanted impact on the saproxylic community, as is the case with some of the known predators (Etxebeste et al., Reference Etxebeste, Álvarez, Pérez and Pajares2012). Results also demonstrate that pheromone-baited traps, although highly specific, may be used in addition to traps baited with host volatiles or photoeclectors (e.g., Wermelinger, Reference Wermelinger2002) to sample for saproxylic species that eavesdrop on bark beetle infochemicals.
Additional research exploring interactions among bark beetles and associated insects in the phloem of host trees appears important if we are to increase our understanding of bark beetle population dynamics (e.g. Billings, Reference Billings1988; Aukema et al., Reference Aukema, Dahlsten and Raffa2000b; Dodds et al., Reference Dodds, Graber and Stephen2001). At the specific I. sexdentatus case, characterization of the response at the stereochemistry level of the pheromone components may further clarify the response patterns of this bark beetle, as well as that of its associated saproxylic beetles as a basis for a sustainable pest management.
Acknowledgements
We acknowledge the aid given by Dr Volker Assing (Hanover, Germany) and José A. Sáez Bolaño (Badajoz, Spain) in the identification of rove beetles (Staphylinidae) and specimens of the Elateridae and Troscidae families, respectively. We also acknowledge the aid provided by a number of people, especially Gonzalo Ávarez and Estela Sánchez from the Sustainable Forest Management Research Institute (University of Valladolid-INIA), Ana B. Martín, Gema Pérez and Luis Miguel from the Regional Forest Health Centre at Calabazanos (Palencia, Castile and Leon) and Dionisio Pozo from the Department of Environment of the Regional Castile and Leon Government. This work has been financed by the Spanish Science and Education Ministry, within the AGL 2004-07507-C04-04 and AGL 2007-61152 research projects. The first author was supported by a scholarship within a fellowship between the University of Valladolid and the Department of Environment of the Castile and Leon Autonomous Government.
List of saproxylic beetles captured at multiple funnel traps baited with I. sexdentatus pheromone blends at a site in Northewest Spain (UTM 29T 7390 4729), arranged by trophic guilds. Species richness (S) and total catches per species and trophic guild are provided too.