Implications
This research presents the first estimates of the genetic basis to mastitis in sheep reared primarily for meat production, based on somatic cell counts (SCC) and the California Mastitis Test (CMT). It also highlights relationships between a variety conformation traits particularly the depth of the udder, teat shape and teat angle (TA). The use of the CMT tool has been proven to be a good predictor of SCC. Its use as a breeding and management tool for sheep farmers to manage mastitis in their flocks will improve animal health and welfare, improve productivity and increase revenue from lamb sales.
Introduction
Mastitis is often regarded as one of the most important health problems in dairy ruminants, but it can also have a large impact on ruminants reared for meat production. The nature of the disease is complex, involving both genetic and environmental factors. The main causative bacteria associated with the disease, in sheep, are Staphylococcus aureus and Mannheimia species (Bergonier and Berthelot, Reference Bergonier and Berthelot2003; Gelasakis et al., Reference Gelasakis, Mavrogianni, Petridis, Vasileiou and Fthenakis2015). Clinical forms of the disease can result in swelling and pain in the udder, changes to milk appearance and composition, high temperature, lameness on the side affected and in extreme cases even death. Subclinical forms of the disease are often less visible in terms of changes to the udder or milk but can be diagnosed using specific tests such as identifying the levels of somatic cells in the milk, as a response to the presence of infection (Fragkou et al., Reference Fragkou, Boscos and Fthenakis2014).
In addition to animal welfare concerns, the disease can prove expensive in meat-producing flocks due to the costs associated with treatment, poor lamb growth and premature culling of ewes (Bergonier and Berthelot, Reference Bergonier and Berthelot2003; Gelasakis et al., Reference Gelasakis, Mavrogianni, Petridis, Vasileiou and Fthenakis2015). In dairy sheep, Rupp and Foucras (Reference Rupp and Foucras2010) estimated, based on an assumed 10% incidence of mastitis in EU dairy sheep and goat flocks, the total annual milk production losses could be in the region of €60 million per annum. In a meat-producing sheep breed such as the Texel, Conington et al. (Reference Conington, Cao, Stott and Bunger2008) estimated that a 10% reduction in the risk of contracting mastitis would be worth £8.40 per ewe, or £2.7 million a year to the purebred UK Texel population at that time. The economic and welfare benefits of reducing the impact that mastitis can have on the sheep industry, both in the UK and globally, are therefore likely to be significant.
The genetic basis for mastitis resistance was initially observed in dairy cattle, with a number of studies accumulating evidence based on disease-related phenotypes such as the presence of clinical mastitis or SCC in the milk (Mrode and Swanson, Reference Mrode and Swanson1996). The levels of somatic cells in the milk reflect the degree to which an immune response has begun against infection such as those caused by bacteria associated with mastitis. More recently similar studies in sheep, predominantly relating to dairy sheep, have also observed a genetic component to the disease and the bacterial pathogens relating to the disease (Bergonier and Berthelot, Reference Bergonier and Berthelot2003; Rupp et al., Reference Rupp, Bergonier, Dion, Hygonenq, Aurel, Robert-Granie and Foucras2009; Riggio and Portolano, Reference Riggio and Portolano2015). The most commonly used method to detect mastitis in dairy animals are SCC as they can be routinely collected, often have a higher heritability than clinical mastitis and can be an indicator for both clinical and subclinical infections (Tolone et al., Reference Tolone, Riggio and Portolano2013; Riggio and Portolano, Reference Riggio and Portolano2015).
However, in many meat-producing flocks the ewes are not routinely handled, thus regular milk sampling is not always practical. It is, therefore, worthwhile to investigate alternative phenotypes in order to gauge the level of infection. A number of studies, in both dairy cattle and small ruminants, have investigated the associations between mastitis and udder and teat conformation traits (Rupp and Boichard, Reference Rupp and Boichard2003; Legarra and Ugarte, Reference Legarra and Ugarte2005). In addition, alternative methods of evaluating cell counts in the milk may prove useful, such as the CMT. This is a quick, simple and inexpensive method of scoring a small sample of milk based upon the reaction there is with a reagent; the level of the reaction being proportional to the concentration of somatic cells present (Gonzalez-Rodriguez and Carmenes, Reference Gonzalez-Rodriguez and Carmenes1996; Bergonier and Berthelot, Reference Bergonier and Berthelot2003).
The identification of suitable phenotypes also allows the future use of genomic selection. As a disease trait, that is hard to measure but that has such high economic consequences, the use of genomic selection would be beneficial. Provided phenotypes were regularly collected from the reference population, to maintain accuracy, animals under selection in the wider population would not need to be exposed to the disease later in life to determine whether they were susceptible or not. As Rupp et al. (Reference Rupp, Mucha, Larroque, McEwan and Conington2016) discuss, genomic selection can prove useful for traits measured later in life and for those associated with the disease. The ability to identify suitable (or non-suitable) animals early in life allows the number of animals that need to be exposed to the disease to be greatly reduced, thus also leading to considerable welfare and productivity benefits.
The main objectives of this study were therefore: (a) to estimate genetic parameters of traits relating to mastitis and udder conformation in a meat sheep breed; (b) estimate the level of association between SCC and the CMT method and (c) assess the relationships between the mastitis related traits and both udder conformation and lamb live weights.
Material and methods
Data collection
During 2015 and 2016, phenotypic data (relating to the udder, teats and milk quality) were collected from 2957 purebred Texel ewes based on 29 flocks, located throughout the UK. The ewes were scored twice each year, by trained technicians, at mid-lactation (~4 weeks after lambing) and again at late-lactation/weaning (~11 weeks after lambing). All ewes included in the study were 2 years old or above and had pedigree and performance data available, via Signet’s Sheepbreeder programme (http://www.signetfbc.co.uk).
The udder and teat traits measured included four traits that were linear in form and scored using a nine-point scale, similar to those used by a number of previous studies assessing conformation traits in small ruminants (de la Fuente et al., Reference de la Fuente, Fernandez and San Primitivo1996; Manfredi et al., Reference Manfredi, Piacere, Lahaye and Ducrocq2001; McLaren et al., Reference McLaren, Mucha, Mrode, Coffey and Conington2016). Udder depth (UD) is the depth of the udder, scored from the rear, in relation to the hocks of the animal. A score of 5 indicates that the cleft of the udder is at the hock level, whereas scores 1 and 9 were well above or well below the hocks, respectively. Udder attachment (UA), also measured from the rear, gives an indication of the strength of the attachment based on the perimeter of the insertion to the abdominal wall. Scores of 1 and 9 represent udders with a weak or strong level of attachment, respectively. Teat placement (TP) and TA were measured from the rear and the side of the animal, respectively. Teat placement gives an indication as to placement of the teats in relation to the medial ligament. Teats pointing straight down, close to each other, were scored 1 whereas those pointing outwards, away from each other, were scored as 9. A score of 5 was given for teats at approximately a 45o angle. Teat angle was measured from the animals left side, and scored from position 1 (~8 o’clock on a clock face) to position 9 (~4 o’clock on a clock face).
The remaining non-linear traits, all of which were measured in centimetres, were; udder length (UL), the distance between the udder cleft and the abdominal wall; udder width (UW), the measure of the udder width from the front to the rear and both the length (TL) and width (TW) of the teats. The average of both teat measurements, for TL and TW, were used in the final analyses.
Individual milk samples were collected from each ewe and tested by the National Milk Laboratories (http://www.nationalmilklaboratories.co.uk) for SCC levels. One sample was collected from each side of the udder at the mid-lactation visit. The average cell count result (from both samples received from the laboratory) for each ewe was then used in the mid-lactation genetic analyses. Milk from both sides was combined into one sample during the late-lactation scoring, on-farm, therefore only one SCC result was received from the laboratory. The SCC values were then log-transformed using the formula Loge(SCC) similar to the method used by Mrode and Swanson (Reference Mrode and Swanson2003), to produce somatic cell score (SCS) values.
The CMT was also used to score a sample of milk from each side. The method involves combining an equal sample of milk with a reagent and then mixing for 15 to 20 s. Depending on the reaction that occurs, the samples are scored on a scale of 0 to 4 with score 4 indicating a high level of somatic cells present. Each udder half was awarded an individual CMT score, using the scores as described by Ruegg (Reference Ruegg2005). The two CMT scores were then summed together (cmtSUM) or the maximum score across both halves was used (cmtMAX) in order to gain information on the severity of the infection. The range of scores possible were therefore 0 to 8 for cmtSUM and 0 to 4 cmtMAX. Both cmtSUM and cmtMAX were log-transformed in order to normalise the data using the formulae Loge(cmtSUM value +1) and Loge(cmtMAX value+1), respectively.
Lamb live weights
The weight of lamb reared by each ewe, each year throughout her lifetime, was calculated using performance records available from the Signet Sheepbreeder programme. Lambs were weighed at approximately 8 weeks after birth to assess growth rate during this time. Of the 2957 ewes included in the study, 2863 also had data available for the 8-week weights of their lambs, up to 2016. In total, there were 4077 total lamb weight reared records available from 2008 to 2016, of which 2300 were collected during the two years of the project (2015 and 2016). The weights were used assess the total weight of lamb reared by the ewe (sum of weights of all lambs per ewe) each year and the average weight of lamb reared by the ewe each year (total weight adjusted for litter size and lamb sex).
Genetic analysis
The pedigree file used in the analyses contained sire and dam information for a total of 31 775 individuals. Variance components were estimated using univariate analyses in ASReml (Gilmour et al., Reference Gilmour, Gogel, Cullis and Thompson2009). The animal models fitted included both direct genetic and permanent environmental random effects. The following fixed effects model was fitted for each trait:
 $$\eqalignno{ & {\rm Mastitis}/{\rm Udder}\, {\rm Conformation}\,{\rm Trait}\,{\equals}\,{\rm ewe}\,{\rm parity}\cr &\quad{\plus}\left( {{\rm litter}\,{\rm size}\,{\rm born}\,{\rm x}\,{\rm litter}\,{\rm size}\,{\rm reared}} \right)\cr &\quad{\plus} {\rm lactation}\,{\rm stage}\,{\plus}\,{\rm scorer}\cr &\quad{\plus}\left( {{\rm farm}\,{\times}\,{\rm lambing}\,{\rm month}\,{\times}\,{\rm year}} \right) $$
where ‘×’ represents an interaction between terms.
Ewe parity was the number of times the ewe had given birth and reared a lamb (five levels; 1 to ⩾5), litter size born was the number of lambs the ewe had given birth to in the year of scoring (three levels; 1 to ⩾3) and litter size reared was the number of lambs the reared during the year of scoring (three levels; 1 to >3). There were two different scorers represented in the data. Lactation stage was defined as the number of days between lambing date and scoring date and was fitted as a covariate. The average lactation stage at mid- and late-lactation was 38 and 113 days, respectively. The contemporary group formed by the interactions between ‘farm×lambing month×year’ included 29 different farms, two different years (2015–2016) and four different lambing months (February, March, April, May). Each fixed effect and/or interaction was significant for the majority of traits, although not every fixed effect was significant for each trait (Supplementary Tables S1 and S2). However, to remain consistent, the same models were fitted across the different traits. The only exceptions to this were for the SCS (where scorer was omitted), as these samples were processed by the laboratory. The distributions of the residuals for each trait analyses were checked for non-normality. With the exception of the traits already transformed (SCS, sumCMT and maxCMT) no further trait transformations were required.
Univariate analyses for the total and average weight of lambs reared by the ewes, up to 8 weeks old, were also estimated using animal models in ASReml (Gilmour et al., Reference Gilmour, Gogel, Cullis and Thompson2009). The following fixed effects model was fitted for each lamb weight trait:
 $$\eqalignno{ {\rm Total}\,&{\rm weight}\,{\rm of}\, {\rm lambs}\,{\rm reared}\,{\rm by}\,{\rm the}\,{\rm ewe}\,{\equals}\,{\rm lamb}\,{\rm age} \cr &{\plus}{\rm ewe}\,{\rm parity}{\plus}\left( {{\rm farm}\,{\times}\,{\rm lambing}\,{\rm month}\,{\times}\,{\rm year}} \right)$$
 $$\eqalignno{ & {\rm Average}\,{\rm weight}\,{\rm of}\,{\rm lambs}\,{\rm reared}\,{\rm by}\,{\rm the}\,{\rm ewe}\cr &\quad\quad{\equals}\,{\rm lamb}\,{\rm age}{\plus}{\rm ewe}\,{\rm parity}{\plus}{\rm rearing}\,{\rm category}\cr &\quad\quad{\plus}\left( {{\rm farm}\,{\times}\,{\rm lambing}\,{\rm month}\,{\times}\,{\rm year}} \right) $$
where ‘×’ represents an interaction between terms.
The covariate of age at weighing (in days, average of 66 days), the fixed effect of ewe parity (five levels; 1 to ⩾5) and the combination of farm×lambing month×year were also fitted in the model used for the total weight of lamb reared by the ewe up to 8 weeks. The same model was also fitted for average lamb weight reared by the ewe up to 8 weeks, but also involved adjusting the total weight for ‘rearing category’ (a factor with six levels combining the number and sex of the lambs reared; single male, single female, twin males, twin females, twins of mixed sex and triplets, of any sex combination). All effects fitted were significant (P<0.001).
Genetic and phenotypic correlations between all traits, associated with mastitis and udder conformation, were estimated using bivariate analyses in ASReml (Gilmour et al., Reference Gilmour, Gogel, Cullis and Thompson2009), fitting the same models as mentioned above. Multivariate analyses were attempted but could not be completed due to lack of computational power. Genetic and phenotypic correlations between both SCS and sumCMT and the weight of lamb reared by the ewe were also estimated using bivariate analyses in ASReml (Gilmour et al., Reference Gilmour, Gogel, Cullis and Thompson2009). The sumCMT trait was selected for these analyses as it provided a more detailed indication of the infection level across both udder halves.
Results
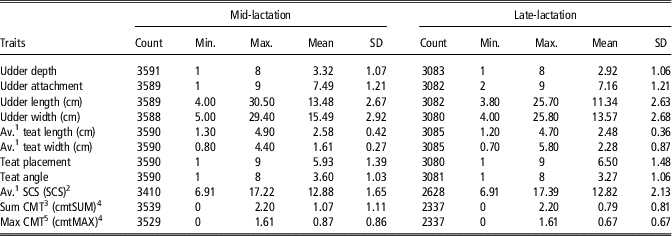
A summary of the traits included in the analyses, for mid-lactation and late-lactation, are given in Table 1. The averages decreased from mid-lactation to late-lactation for all udder traits indicating that the udders had reduced in size between scoring events. The teat trait means were similar across both scoring events, with TW slightly higher at late-lactation. There was very little difference between the average SCS at both scoring events but the average values observed for the CMT traits fell slightly. The number of records available for the traits associated with the late-lactation scoring event was less than those for the mid-lactation traits. This was due to a combination of factors, predominantly influenced by the fact that a number of ewes were beginning to, or had already, dried off by the second scoring event, therefore samples or measurements could not be collected. CMT records were also removed if the ewe did not have two CMT scores (i.e. from both udder halves).
Summary of traits included in the analyses

SCS=somatic cell scores; SCC=somatic cell counts; CMT=California Mastitis Test.
1 Average of samples collected from both udder halves.
2 SCS calculated by transforming SCC using equation Loge(SCC).
3 Sum of CMT scores awarded across both udder halves.
4 Data transformed using the equation Loge(CMT score+1).
5 Maximum CMT score awarded across both udder halves.
Genetic parameters
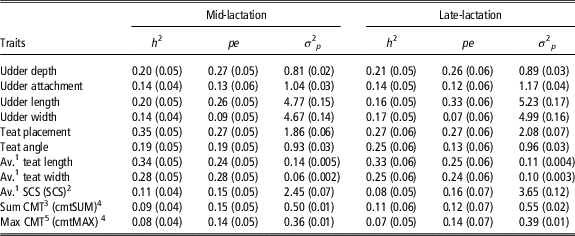
The univariate heritabilities for each trait, at both mid-lactation and late-lactation, are shown in Table 2. The heritabilities estimated across all traits, ranged from 0.08 to 0.35 (mid-lactation) and from 0.07 to 0.33 (late-lactation). The highest estimates were associated with the teat traits (particularly for TP and TL) whereas the lowest were generally associated with the mastitis traits (SCS, sumCMT and maxCMT).
Univariate heritabilities (h2 ), permanent environment variance (pe) and phenotypic variances (σ 2 p ) for traits scored in Texel ewes at mid- and late-lactation (SE in parentheses)

SCS=somatic cell scores; SCC=somatic cell counts; CMT=California Mastitis Test.
1 Average of samples collected from both udder halves
2 SCS calculated by transforming SCC using equation Loge(SCC).
3 Sum of CMT scores awarded across both udder halves.
4 Data transformed using the equation Loge(CMT score+1).
5 Maximum CMT score awarded across both udder halves.
Relationships between somatic cell count and California Mastitis Test
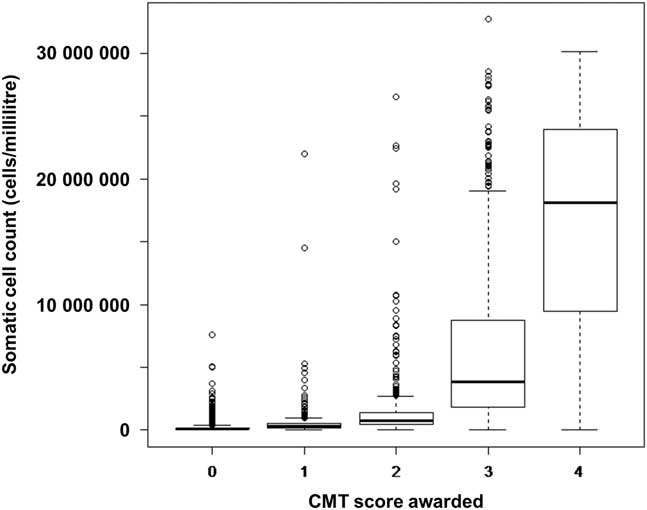
The cell counts associated with each CMT score, awarded to each individual udder half at mid-lactation across both sample years, are shown in Figure 1. Individual cell counts were not collected at late-lactation (as samples from both halves were mixed on-farm before being submitted for laboratory analysis). The medians of each CMT score, as indicated by the thick black lines in Figure 1, were 119×103 cells/ml; 295×103 cells/ml; 776×103; 3857×103 and 18 082×103 somatic cells/ml for scores 0, 1, 2, 3 and 4, respectively. The arithmetic means for the corresponding scores were 189×103; 467×103; 1383×103; 6403×103 and 16 139×103 somatic cells/ml, respectively.
Boxplot of somatic cell counts associated with each California Mastitis Test (CMT) score.

Genetic and phenotypic relationships between all mastitis and udder conformation traits
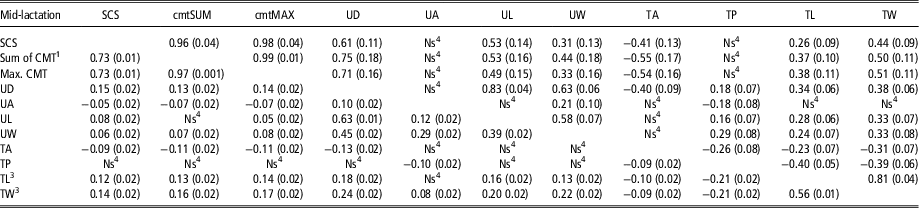
The genetic and phenotypic correlations estimated between all mastitis traits (SCS, cmtSUM and cmtMAX) and the udder conformation traits, at mid- and late-lactation, are shown in Tables 3 and 4, respectively. The genetic correlations estimated between SCS and both CMT traits were highest at the mid-lactation recording event (0.96 to 0.98) when compared with those observed at late-lactation (0.76 to 0.79). The genetic correlations estimated between the two CMT traits, at each recording event, were both 0.99, therefore indicating that these traits were not significantly different.
Genetic (above diagonal) and phenotypic (below diagonal) correlations (SE in parentheses) between all mastitis traits (somatic cell score (SCS) and California Mastitis Test (CMT)) and udder conformation traits, measured in Texel ewes at mid-lactation

UD=udder depth; UA=udder attachment; UL=udder length; UW=udder width; TA=teat angle; TP=teat placement; TL=teat length; TW=teat width.
1 Sum of CMT scores awarded across both udder halves.
2 Maximum CMT score awarded across both udder halves.
3 Average of teat measurements across both udder halves.
4 Correlations not significantly (Ns) different to zero (P>0.05).
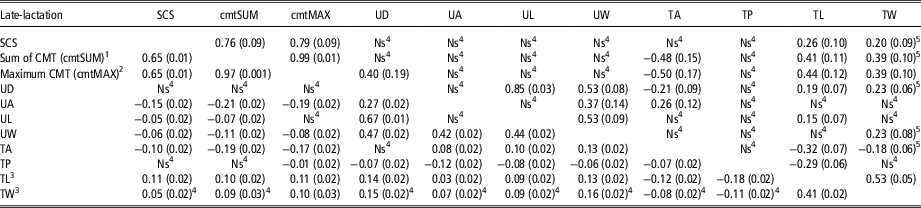
Genetic (above diagonal) and phenotypic (below diagonal) correlations (SE in parentheses) between all mastitis traits (somatic cell score (SCS) and California Mastitis Test (CMT)) and udder conformation traits, measured in Texel ewes at late-lactation

UD=udder depth; UA=udder attachment; UL=udder length; UW=udder width; TA=teat angle; TP=teat placement; TL=teat length; TW=teat width.
1 Sum of CMT scores awarded across both udder halves.
2 Maximum CMT score awarded across both udder halves.
3 Average of teat measurements across both udder halves.
4 Correlations not significantly (Ns) different to zero (P>0.05).
5 No permanent environment effect fitted.
Genetic correlations, significantly different from zero (P<0.05), observed between UD, UL and UW and both SCS and CMT traits, at mid-lactation, were all positive ranging from 0.31 to 0.75. The genetic correlations associated with UA and all mastitis traits were not significantly different from zero (P>0.05). Both genetic and phenotypic correlations associated with TA were negative, whereas those associated with the TL and TW measurements were all positive. The genetic correlations associated with TP were not significantly different from zero (P>0.05).
A range of genetic correlations amongst the udder conformation traits were observed, at mid-lactation, with the highest observed between UD and UL (0.83) and between TL and TW (0.81). Moderate correlations were also observed between UW and both UD and UL (0.63 and 0.58, respectively). Correlations estimated between the udder and teat traits were low to moderate. The relationship between UD and both TL and TW were positive (0.34 to 0.38), whereas a negative relationship was observed between UD and TA (−0.40).
There was no obvious relationship between the mastitis traits and the udder traits at late-lactation, with the majority not significantly different from zero (P>0.05). The genetic correlations observed between the mastitis traits the teat traits were all significant (P<0.05), with the exception of those associated with TP. The correlations associated between the CMT traits and TA were in a similar direction to those observed at mid-lactation (−0.48 to −0.50). The genetic correlations observed between the mastitis traits and both TL and TW were all positive in strength (0.20 to 0.44).
As in the mid-lactation analyses, the genetic correlations estimated between UD and UL and between TL and TW were moderate to high, ranging from (0.53 to 0.85). The relationships observed between UD and TA, TL and TW were also similar to the mid-lactation results, although the strength of the correlations had decreased.
Relationship between mastitis and weight of lamb reared by the ewe
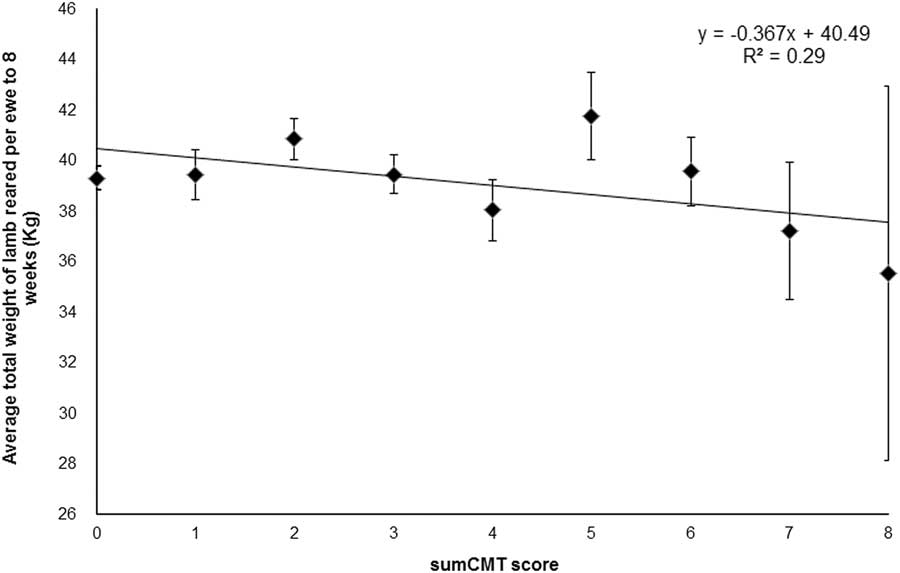
The total weight of lambs reared by the ewes to 8 weeks old, each year, ranged from 7.5 to 122 kg, with an average of 39.9 kg (SD 14.79) across 4077 records (between 2008 and 2016). The relationship between the average total weight of lamb reared by the ewe and each sumCMT score awarded, using data from 2015 and 2016 only, is shown in Figure 2. The slope of trend line shown was estimated as −0.367, therefore indicating that a one-point increase in sumCMT score reduced with the total weight of lamb reared by the ewe, on average, by 0.367 Kg.
Average total weight of lamb reared by the ewes, at 8 weeks old, associated with each sum of California Mastitis Test (sumCMT) score.

The univariate heritability estimate for the total weight of lamb reared by the ewes to 8 weeks old, using the data available between 2008 and 2016, was 0.06 (0.03). Similarly, the univariate heritability estimate for the average weight of lambs reared by the ewes to 8 weeks old (total weight adjusted for litter size and lamb sex) was 0.10 (0.03).
The genetic and phenotypic correlations estimated between both SCS and sumCMT with the total and average weight of lamb reared by the ewe, up to 8 weeks old, are shown in Table 5. All genetic correlations estimated were not significantly different to zero (P>0.05). Significant negative phenotypic correlations (P<0.05) were observed, ranging from −0.15 to −0.23, indicating that as infection levels rose, the weight of lamb (total and average) reared by the ewe decreased.
Genetic (rg ) and phenotypic (rp ) correlations (SE in parentheses) between mastitis traits (somatic cell score (SCS) and California Mastitis Test (CMT)) recorded at mid-lactation and the weight of lamb reared by the ewe up to 8 weeks old

1 Sum of CMT scores awarded across both udder halves.
Discussion
Over recent years the literature available on mastitis in small ruminants has been growing. The majority have concentrated on dairy animals, but the disease is also an important factor to consider in those reared for meat production. To our knowledge, the heritabilities presented for SCS and the CMT represent some of the first to be estimated in sheep reared primarily for meat production.
The heritabilities estimated for SCS ranged from 0.08 to 0.11, the highest occurring at mid-lactation. In studies where single test-day estimates were considered, in dairy ewes, the heritabilities ranged between 0.04 to 0.12 when measured at different points throughout lactation (Barillet et al., Reference Barillet, Rupp, Mignon-Grasteau, Astruc and Jacquin2001; Rupp et al., Reference Rupp, Lagriffoul, Astruc and Barillet2003). Both authors also observed that the heritabilities rose as the lactation progressed. Psifidi et al. (Reference Psifidi, Bramis, Arsenos and Banos2014) observed a decline in heritabilities in both SCC and CMT, up to week 10 of lactation, after which the estimates began to rise towards the end of lactation. The standard errors associated with the estimates for SCS (and indeed the CMT traits), in the current study, indicate they were not significantly different (P<0.05) across both scoring events. It should also be noted that the method used to transform the SCC data in the current study was the method used by Mrode and Swanson (Reference Mrode and Swanson2003), and not the method used by Ali and Shook (Reference Ali and Shook1980), used in previous analyses such as those by Barillet et al. (Reference Barillet, Rupp, Mignon-Grasteau, Astruc and Jacquin2001) and Rupp et al. (Reference Rupp, Lagriffoul, Astruc and Barillet2003). When the two methods were compared, the distributions were similar. The method adopted in the current study is, at present, used in dairy cattle evaluations across a number of different countries, including Australia, Great Britain (GB) and the combined evaluations across Denmark, Sweden and Finland (Interbull, 2017). It was therefore used to maintain consistency with current commercial evaluations.
Although Riggio et al. (Reference Riggio, Pesce, Morreale and Portolano2013) concluded that SCS was the best indirect test of the bacteriological status of the udder, when compared with the CMT, the CMT can be considered as being a very good substitute for use in meat sheep production systems. The median cell count values obtained for each CMT score recorded at mid-lactation in the current study matched reasonably well with the ranges used by Ruegg (Reference Ruegg2005). McDougall et al. (Reference McDougall, Murdough, Pankey, Delaney, Barlow and Scruton2001) found that a score 3 (equivalent to a score 4 in the current study) was associated with a geometric mean of 8.8×10⁶ somatic cells/ml in sheep (and 7.5×10⁶ in goats). Lower estimates have also been observed by Kalogridou-Vassiliadou et al. (Reference Kalogridou-Vassiliadou, Manolkidis and Tsigoida1992) and Gonzalez-Rodriguez and Carmenes (Reference Gonzalez-Rodriguez and Carmenes1996). However, these differences could be influenced by various factors such as different methods for calculating SCC (Kalogridou-Vassiliadou et al., Reference Kalogridou-Vassiliadou, Manolkidis and Tsigoida1992); breed differences (Gonzalez-Rodriguez and Carmenes, Reference Gonzalez-Rodriguez and Carmenes1996) or environmental differences, such as production environment conditions (housed or outside) or whether or not ewes were rearing suckling lambs (Arsenault et al., Reference Arsenault, Dubreuil, Higgins and Belanger2008; Waage and Vatn, Reference Waage and Vatn2008).
The genetic parameters estimated for the CMT traits in the current study are to our knowledge, the first to be estimated for meat-producing sheep. Indeed although Psifidi et al. (Reference Psifidi, Bramis, Arsenos and Banos2014) estimated heritabilities ranging from ~0.06 to 0.42 throughout lactation in Chios dairy ewes, there are few estimates available in the literature, across all ruminant species. The genetic relationships observed in the current study between the CMT traits and SCS were very favourable, particularly at mid-lactation, indicating the traits were under a similar genetic influence. Although there were differences in the sampling methods at late-lactation, the lower correlations between the CMT traits and SCS at late-lactation could also be influenced by the fact many of these ewes were approaching or had already achieved, the end of their lactation. Indeed an increase in false-positive results towards the end of the lactation period has been observed elsewhere (Gonzalez-Rodriguez and Carmenes, Reference Gonzalez-Rodriguez and Carmenes1996). These results, therefore, indicate that selection upon CMT traits, to reduce mastitis levels, would be worthwhile, providing records were collected near mid-lactation rather than later in the lactation period.
Udder and teat conformation scores, and their associations with the mastitis related traits demonstrated that further progress to reduce mastitis incidence could be achieved. The most commonly scored conformation traits in the literature include UD and TP. The heritabilities in the current study associated with UD and TP were in general agreement with previous studies (Legarra and Ugarte, Reference Legarra and Ugarte2005; Marie-Etancelin et al., Reference Marie-Etancelin, Astruc, Porte, Larroque and Robert-Granie2005; de la Fuente et al., Reference de la Fuente, Gonzalo, Sanchez, Rodriguez, Carriedo and San Primitivo2011). Other traits with moderate heritability estimates included both TL and TW, which ranged from 0.25 to 0.34. Although measured in Alpine and Saanen dairy goats and not sheep, Manfredi et al. (Reference Manfredi, Piacere, Lahaye and Ducrocq2001) found both of these traits to have higher heritability estimates, ranging from 0.43 to 0.52. In the current study, both TL and TW were metric measurements, but other studies have considered similar traits using a 1 to 9 scoring system. These included de La Fuente et al. (Reference de la Fuente, Gonzalo, Sanchez, Rodriguez, Carriedo and San Primitivo2011), who observed heritabilities for TL ranging from 0.16 to 0.30. Overall, the range of estimates observed, across both scoring events, indicate that all traits are heritable and therefore genetic improvement could be achieved through selection.
The correlations estimated between the udder conformation and mastitis traits were higher at mid-lactation when compared with those observed at late-lactation. The strongest correlations observed at mid-lactation for SCS and both CMT traits were with UD (0.61 to 0.75). Similar observations were seen for UL, which itself was highly correlated with UD (0.83). These agree with previous estimates such as those reported by Casu et al. (Reference Casu, Sechi, Salaris and Carta2010) and a number of studies reviewed by Rupp and Boichard (Reference Rupp and Boichard2003). Udder width also proved influential on infection levels, with wider udders associated with higher values associated with the mastitis traits. Overall, these results indicate that longer, wider and therefore fuller udders were more likely to have higher levels of infection.
In terms of the teat traits, negative correlations were estimated between the mastitis traits and TA, indicating that teats positioned further forward on the udder were at a higher the risk of infection. This may be due to the fact that there is less protection from the elements or that they are more easily accessed by the suckling lambs. The current study also indicates that longer and wider teats were also associated with higher SCS and CMT scores, possibly influenced by the fact that larger teats will contain a larger volume of residual milk increasing the possibility of pathogens multiplying, as suggested by Huntley et al. (Reference Huntley, Cooper, Bradley and Green2012). However, the collection of individual teat measurements is perhaps not appropriate for commercial meat-sheep production systems. An alternative scoring method, such as the nine-point scale for TL used by de la Fuente et al. (Reference de la Fuente, Gonzalo, Sanchez, Rodriguez, Carriedo and San Primitivo2011), or a trait associated with teat shape, may prove more worthwhile.
Antagonistic correlations between SCS and milk yield, have been observed in dairy cattle (Mrode and Swanson, Reference Mrode and Swanson1996; Rupp and Boichard, Reference Rupp and Boichard2003) and in some dairy sheep studies (Rupp et al., Reference Rupp, Lagriffoul, Astruc and Barillet2003). Rupp et al. (Reference Rupp, Lagriffoul, Astruc and Barillet2003) reported correlations between SCS and milk yield between 0.05 and 0.23 throughout the first lactation in Lacaune sheep. However, other studies have reported opposite findings, such as the correlations of −0.15 and −0.30 observed by El-Saied et al. (Reference El-Saied, Carriedo, de La Fuente and San Primitivo1999) and Legarra and Ugarte (Reference Legarra and Ugarte2005), respectively. There, therefore, seems to be some inconsistency. Although no information is available in the current study relating to milk yields, the weight of the lambs reared by the ewe is a more suitable indicator of performance for this type of production system. The live weights of the lambs recorded at 8 weeks of age are currently used by Signet’s Sheepbreeder programme both as a direct trait of the lamb but also to assess the maternal ability of the ewe, depending on the breed and selection index used. The selection index currently used for Texel sheep in the UK has a high emphasis on carcass-related characteristics and less on maternal traits. However, the heritabilities estimated in the current study for the total and average weight of lamb reared by the ewe, although low indicate that genetic progress could be achieved if these traits were selected upon in the future. The relationships observed between SCS and sumCMT and both the total and average weight of lambs reared by the ewes indicate that the higher the level of infection in the milk, the lighter the lambs at the 8-week weight. This relationship has been observed in a number of other studies, including that by Huntley et al. (Reference Huntley, Cooper, Bradley and Green2012) and Moroni et al. (Reference Moroni, Pisoni, Varisco and Boettcher2007). Therefore, a reduction in the infection levels of the ewe’s milk will have a positive effect on the weight of lambs reared by the ewe and the overall production output of the flock. Indeed, the trend observed between the average total weight of lamb reared and each sumCMT score recorded during 2015 and 2016 (Figure 2) indicated that a one-point change in sumCMT score reduced the total weight of lamb reared, on average, by 0.367 g. This suggests that a ewe with a sumCMT score of 8 would be rearing a total weight of lamb, on average, 2.936 kg lighter than a ewe with a sumCMT score of 0. If we consider this relationship in monetary terms, using the current average price per kilo for medium farm assured lambs in GB markets of £2.00 per kilo live weight (Agriculture & Horticulture Development Board, 2017), for every one-point change in sumCMT score, the value of the lamb reared would reduce by 73p per ewe. In addition, the difference between the weight of lamb reared by a ewe scoring 0 and a ewe scoring 8 would be £5.87. The genetic correlations associated with both mastitis traits and the average weight of lambs reared by the ewe were not significantly different from zero, indicating that these traits are under different genetic control and any future selection to improve the average weight of lambs reared would not be associated with a higher genetic incidence of mastitis.
Conclusions
The results presented have improved our knowledge in terms of meat-producing sheep, for a number of different aspects associated with mastitis. First of all, the validation that the CMT method is highly correlated with SCS and is, therefore, a good indicator for mastitis is notable, given the relatively few recent studies to date that have investigated this method. Second, the fact that both SCS and, perhaps of more significant interest the CMT traits, have been proven to have a genetic component in this breed. These are the first known estimates to be produced for meat sheep in the UK and will allow future genetic selection upon these traits to be explored, particularly relevant in the era of genomic selection. The ability to identify animals suitable for further breeding, at an early stage before they have been exposed to the disease, will not only improve the rates of genetic improvement but also have a positive impact on flock productivity and overall health and welfare. The relationship between both SCS and sumCMT traits and the weight of lambs reared by the ewe is also of significant interest with improvements in lamb weights possible if infection levels in the milk are reduced. The overall economic benefits, therefore, of these results combined, could be substantial not only in this breed alone but also in the overall meat sheep industry as a whole.
Acknowledgements
This paper is part of an 18-month project co-funded by Innovate UK. The authors gratefully acknowledge the cooperation of all the Texel Sheep Society members who provided their time and animals throughout the study period. Thanks also to Will Sawday for his involvement in the data collection and to Laura Nicoll, Claire Anderson and William Conington for their technical assistance.
Declaration of interest
None.
Ethics statement
The underpinning work passed through SRUC’s internal Animal Experiment Committee process.
Software and data repository resources
None.
Supplementary material
To view supplementary material for this article, please visit https://doi.org/10.1017/S1751731118000393