Implications
Non-roughage diets can be used in intensive beef production systems without altering animal performance. However, these diets increase the risk of ruminal acidosis because animals that are fed these diets reduce the time spent in chewing (rumination) and, consequently, the beneficial effects of saliva produced during this masticatory activity, as they help to maintain ruminal pH at the physiological level. Farmers must assume this risk and keep animals under close observation to avoid this digestive disorder. Moreover, there is some evidence that removing roughage in the diet alters animal behaviour, reducing rumination activity and increasing stereotypic activity that could compromise animal welfare.
Introduction
In intensive beef production systems, increase in prices of diet ingredients have led to changes in the feeding system. Feeding regimens that minimize roughage usage are of interest in feedlots diets because roughage can be an expensive ingredient on an energy basis (Bartle and Preston, Reference Bartle and Preston1991), specifically in areas where forage production is limited. In Spanish commercial conditions, some beef cattle farmers have decided to remove the forage fibre source in an attempt to reduce production costs. Although cereal straw provides limited amounts of nutrients to the animal, it promotes chewing activity and saliva flow, thus preventing the ruminal pH drop that normally occurs when this intensive feeding system is used. There is published evidence that all-concentrate diets can result in good performance (Wise et al., Reference Wise, Harvey, Haskins and Barrick1968), but the incidence of ruminal disorders and hepatic abscesses is higher than in diets with a fibre forage source (Oltjen et al., Reference Oltjen, Davis and Hiner1965; Wise et al., Reference Wise, Blumer, Matrone, Craig and Barrick1965). If ruminal acidosis is a common digestive disorder in beef cattle (Nagaraja and Titgemeyer, Reference Nagaraja and Titgemeyer2007), typically ascribed to excessive consumption of fermentable carbohydrates which decreases ruminal pH (Owens et al., Reference Owens, Secrist, Hill and Gill1998), feeding an all-concentrate diet increases the risk factor to promote these disorders. Moreover, restrictive allowances of roughage with its effects on feeding behaviours considerably increase the development and frequency of oral stereotypies in cattle (Redbo and Nordblad, Reference Redbo and Nordblad1997).
Information on feedlot behaviour and welfare of animals fed all-concentrate diets is lacking. Two experiments were therefore designed to find out if in spite of good performance, animals modify their maintenance behaviour due to the absence of forage fibre source, maybe causing a welfare problem. In the first experiment, the effects of using an all-concentrate diet in non-competitive conditions were studied. In addition, we were interested in understanding probable changes in ruminal fermentation and microbial populations. In the second, the study was conducted in feedlot conditions.
Material and methods
All animal procedures were approved by the Institutional Animal Care and Use Committee of the Universitat Autònoma de Barcelona, in experiment 1, and by the Animal Care and Use Committee of the Institut de Recerca i Tecnologia Agroalimentària, in experiment 2.
Experiment 1
Animals, experimental design and housing
Eight Holstein heifers (average initial BW of 143 ± 8.7 kg) fitted with 1-cm i.d. permanent ruminal plastic cannula (Divasa Farmavic S. A., Vic, Spain) were used in this repeated measures trial. Four animals received barley straw (BS) on an ad libitum basis as a roughage supplement, whereas the other four did not (NBS). The experiment was performed in four 42-day periods, and sampling was carried out in the last week of each period. Heifers were weighed for two consecutive days at the beginning of the experiment and also before slaughter. Intermediate weights were taken after withdrawal of refusals at the beginning of the sampling week for the calculation of average daily gain (ADG) and gain to feed ratio (G : F). Animals were slaughtered at 370 kg BW in a commercial abattoir, where carcasses were classified and hot carcass weight (HCW) and the number of removed livers was registered. Dressing percentage was calculated by means of final BW and HCW.
Animals were individually housed in tie-stalls on rubber comfort mats on the Experimental Farm of the Universitat Autònoma de Barcelona. Surgery was performed 4 weeks before the beginning of the experiment, following the standard surgical procedures (Balch and Cowie, Reference Balch and Cowie1962) and conducted under local anaesthesia with full aseptic precautions.
Feed, water supply and data collection
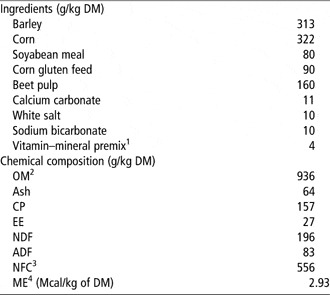
Heifers were fed on an ad libitum basis. The concentrate was formulated according to National Research Council (1996) to achieve an ADG of 1.3 kg/day. Main ingredients were barley, corn, soyabean meal and corn gluten feed, as main energy and protein sources, and beet pulp, as main fibre source (Table 1). All ingredients of the concentrate were ground through a 5-mm screen and mixed. BS was coarsely chopped to approximately 7 cm in length and contained, per kilogram of dry matter (DM), 921 g of organic matter, 47 g of CP, 772 g of NDF and 466 g of ADF. Feeders were cleaned and orts collected at 0800 h each morning, and feed offered once daily at 0830 h. Heifers in BS treatment received the BS in a separate compartment of the feed bunk. Orts were weighed before feeding and the offered diet was 115% of the previous day intake. To register water consumption, individual drinking cups with direct reading flow meters were used (B98.32.50, Invensys model 510 C, Tashia SL, Artesa de Segre, Spain), which allowed a minimum water measurement of 20 ml. Water was available at all times.
Ingredients and chemical composition (g/kg DM) of concentrate

DM = dry matter; OM = organic matter; EE = ether extract content; NFC = non-fibre carbohydrates.
1Karimix® Terneros (Laboratorios Karizoo S.A., Barcelona, Spain): vitamin and mineral premix contained per kg DM premix: 3333 kIU vitamin A, 666 kIU vitamin D3, 2166 IU vitamin E, 0.66 g vitamin B1, 0.66 g vitamin B2, 2 mg vitamin B12, 26 g coline chloride, 13.4 g Zn, 3.3 g Fe, 83.3 g S, 166.6 mg Co, 3.3 g Cu, 16.6 g Mn, 16.6 g Mg, 116.6 mg I, 66.6 mg Se, 100 mg Etoxiquine, 100 mg Butilhidroxitoluene.
2OM calculated as DM minus ash content
3NFC calculated as 100 – (CP + ash + NDF + EE)
4Estimated according to the NRC (1996).
Sample collection and analyses
Concentrate and BS refusals were collected daily for five consecutive days and composited for each heifer to calculate nutrient intake. Samples were analyzed for DM content, in order to record feed DM intake daily. The DM content of offered feed and refusals was determined by drying samples for 24 h at 103°C in a forced-air oven according to the Association of Official Analytical Chemist (1990). Feed offered and refusal samples were dried in a forced air oven at 60°C for 48 h for later chemical analysis. Feeds and refusals were ground in a hammer mill through a 1-mm screen (P. PRAT SA, Sabadell, Spain) and retained for analysis of DM (AOAC, 1990; ID 950.01) and ash (AOAC, 1990; ID 942.05). Organic matter was calculated as the difference between DM and ash content. Nitrogen content was determined by the Kjeldahl procedure (AOAC, 1990; ID 976.05). Ether extract was performed according to AOAC (1990; ID 920.39). The NDF and ADF contents were determined sequentially by the procedure of Van Soest et al. (Reference Van Soest, Robertson and Lewis1991) using a thermostable α-amylase and sodium sulphite. DM and nutrient daily intake were calculated as the difference between amount of DM or nutrient offered and refused.
Ruminal samples (0.25 l) were taken on three consecutive days of the sampling week with an electric vacuum pump immediately before feeding and at 4, 8 and 12 h after feeding. The ruminal fluid was squeezed through four layers of cheesecloth and pH was measured immediately with a glass electrode pHmeter (model 507, Crisson Instruments SA, Barcelona, Spain). Two sub-samples were taken. First, a 4-ml sample of filtered fluid was acidified with 4 ml of 0.2 N HCl and frozen at −20°C. Samples were later thawed, centrifuged at 15 000 × g for 15 min and the supernatant analysed for NH3-N (Chaney and Marbach, Reference Chaney and Marbach1962) by spectrophotometry (model Libra S21, Biochrom Ltd, Cambridge, UK). Secondly, 4 ml of filtered ruminal fluid were added to 1 ml of a solution made up of 1% (wt/wt) solution of mercuric chloride, to prevent microbial growth, 2% (vol/vol) orthophosphoric acid and 0.2% (wt/wt) 4-methylvaleric acid as an internal standard in distilled water and frozen at −20°C (Jouany, Reference Jouany1982). These samples were later thawed, centrifuged at 15 000 × g for 15 min, and diluted 1 : 1 in distilled water for subsequent volatile fatty acids (VFA) analysis using gas chromatography (model 6890, Hewlett Packard, Palo Alto, CA, USA). A capillary column treated with polyethylene glycol TPA (BP21, SGE, Europe Ltd, Buckinghamshire, UK) at 275°C in the injector and a 29.9 ml/min total gas flow rate were used in the chromatograph. Ruminal fluid pH, NH3-N and VFA measures after feeding were averaged across time by calculating the area under the ruminal data v. time curve and dividing by the total time (Pitt and Pell, Reference Pitt and Pell1997).
In order to have a representative sample of the day, a composited sample of the four hourly samples of strained fluid taken on day 2 of ruminal sampling was used for d- and l-lactate determinations and for quantification of Streptococcus bovis and Megasphaera elsdenii by real time PCR (qPCR). l-lactate and d-lactate were analyzed by an enzymatic method by means of an Olimpus AU400 autoanalyzer (Olympus, Hamburg, Germany). Reagents, LA9914 for d-lactate and LA9915 for l-lactate, were provided by BEN SRL (Biochemical Enterprise, Milan, Italy). For qPCR analyses, the DNA from rumen fluid was extracted by physical disruption using a bead-beating method (Mini-Beater; Biospec Products, Bartlesville, OK, USA) following the protocol described by Whitford et al. (Reference Whitford, Forster, Beard, Gong and Teather1998) with some modifications proposed by Blanch (Reference Blanch2009). For S. bovis, the primers and probe sequences used were the ones designed by Blanch (Reference Blanch2009) from the 16S rRNA sequence available in the GeneBank database (AY442813), forward primer S. bovis F: 5′-GATAGCTAATACCGCATAACA GCATT-3′; reverse primer S.bovis R: 5′-AACGCAGGTCCATCTACTAGTGAA-3′; and probe S. bovis P: 5′-TGCTCCTTTCAAGCAT-3′. For M. elsdenii, previously published primers (Ouwerkerk et al., Reference Ouwerkerk, Klieve and Forster2002) and a probe designed by Blanch (Reference Blanch2009) were used: Melsprobe: 5′-ACTGGTGTTCCTCCTAATA-3′. Samples for qPCR were run in the ABI PRISM® 7900 HT Sequence Detection System (Applied Biosystems, Warrington, UK) as described by Blanch (Reference Blanch2009).
Feeders and feed intake behaviour
In order to record feed intake patterns, an automated system was used. Feed bunks (120 l capacity) were mounted on waterproof digital platform scales for each stall (model HW-60KV-WP, A & D Company Ltd, Tokyo, Japan). Each scale was programmed to record the feed weight at 1-min intervals and data were stored onto a personal computer with a software application (WinCT, A & D Company Ltd, Tokyo, Japan). Feeding events were registered as minute-by-minute feeder disturbance. Length of all inactive intervals in which feeding did not occur were log-transformed and used to calculate the meal criterion, which is the minimum time required to consider two periods of eating activity as separate events. Data were processed as described by González et al. (Reference González, Correa, Ferret, Manteca, Ruíz de la Torre and Calsamiglia2009) to calculate meal frequency (meals/day), meal length (min/meal), daily feeding time (min/day), meal size (g DM/meal) calculated as daily DM intake divided by meal frequency and eating rate (g DM/min) as daily DM intake divided by daily feeding time.
Maintenance behaviour
To register animal behaviour throughout the day, a video-camera recording device was set up in the barn. It consisted of a digital black and white camera (model LTC 0500/50, Philips, Eindhoven, The Netherlands), with iris vari-focal lenses (model LTC 3274/40, Philips), which was connected to a time lapse recorder (model RT 24a/00T, Philips). Animal behaviour was video-recorded for 24 h on three consecutive days of each experimental period. Data recording was carried out by scan sampling at 5-min intervals for mutually exclusive activities of each heifer. Activities registered included eating, ruminating, drinking, self-grooming and social and stereotypic behaviours as defined by González et al. (Reference González, Ferret, Manteca and Calsamiglia2008a). When none of the previous activities were being performed, the animal was considered to be resting. Social behaviour was registered when a heifer was licking or nosing a neighbouring heifer with the muzzle, or butting. Stereotypies, as repeated sequences of a behaviour that have no apparent purpose or benefit, included tongue-rolling and the act of licking or biting the fixtures. Data for each activity are presented as the percentage of total daily observations obtained by summing the number of times the activity was observed and dividing by the total number of observations during the day, 288 observations per day or 864 observations per heifer and period.
Statistical analyses
Each individual animal was considered the experimental unit for all analyses. Statistical analyses of normally distributed variables were conducted by a mixed effects model with repeated measures using the PROC MIXED procedure of SAS (SAS Institute Inc., v 9.1, Cary, NC, USA). All variables were averaged to generate period means for each heifer. The model contained the effect of treatment, period and their interaction as fixed effects. Animal was used as a random effect, and period was the repeated factor. The choice of the best covariance structure was based on biological meaning and fit statistics, where the model that minimized either Akaike Information Criteria Corrected or Schwarz’s Bayesian Information Criteria was preferable (Littell et al., Reference Littell, Henry and Ammerman1998; Wang and Goonewardene, Reference Wang and Goonewardene2004). Slaughterhouse data were analyzed using the GLM procedure of SAS with treatment as fixed effect. The variables expressed in percentage were statistically analyzed after square root-arcsine transformation but presented as back-transformed least square means. Significance was declared at P ⩽ 0.05.
Experiment 2
Animals, treatments and facilities
Forty-eight Friesian female calves (average initial BW = 84.5 ± 1.37 kg) were bought after weaning from a commercial farm and transported to the IRTA-PRAT Experimental Farm (Barcelona, Spain). Calves were allowed to rest after a 2-h journey and provided with fresh drinking water, but they were deprived of feed until weighing and assignment to treatments the following day. A randomized complete block design with two treatments and four weight blocks was used (six animals/pen). The two treatment diets consisted of BS and NBS. Three animals died during the experiment, one in the BS treatment and two in the NBS treatment, but there was no evidence of any relation between these deaths and the experimental treatments.
Each pen had a concrete floor and was 12.6-m long and 3.84-m wide (48.4 m2/pen), which resulted in a space availability of 8.1 m2/calf. Each pen had an 11.1-m2 concrete roofed resting area, bedded with wood shavings at one end, and a 7.7-m2 feeding area with a 2.5-m ceiling at the other end. Separate concentrate and straw feeders were allocated in the front of the feeding area. One water bowl was placed in each corner of the feeding area.
A digital video-recording device was set up in a room close to the pens to register animal behaviour throughout the day (model NX-5004, Circontrol S. A., Terrassa, Spain). A digital colour/monocromo camera (model VSDOM-DNE, Circontrol S. A., Terrassa, Spain) was allocated in front of the feeding area of each pen at a height of approximately 2 m. An infrared light with photoelectric cells was set at each end of the paddock to allow video recording at night (λ = 830 nm and 500 W; Dennard 2020, Hants, UK).
Intake, performance and sampling
All measurements started after an arrival adaptation period of 2 weeks. Heifers were weighed for two consecutive days after this adaptation period and also before slaughter. The experiment consisted of nine 28-day periods. Intermediate weights were taken after withdrawal of refusals on day one of each experimental period for the calculation of ADG and gain to feed ratio (G : F). All animals were fed up to 365 kg of slaughter BW. Animals were slaughtered in a commercial abattoir, where carcasses were classified, and HCW and the number of removed livers was registered. Dressing percentage was calculated by means of final BW and HCW.
Heifers were offered feeds on an ad libitum basis once a day at 0830 h. The concentrate was the same as that used in experiment 1 (Table 1). All ingredients of the concentrate were ground through a 5-mm screen and mixed. BS contained, per kg of DM, 912 g of organic matter, 43 g of CP, 753 g of NDF and 442 g of ADF. One composited sample of the offered concentrate and straw was taken weekly for DM determination and chemical analysis. Straw and concentrate intake was calculated for each week by weighing the amount of feed offered each day and subtracting the amount refused at the end of the week.
On day 1 of each experimental period, one whole blood sample from each heifer was taken by jugular veni-puncture (10-ml Vacutainer, Plymouth, UK) before feeding. Serum was separated within 1 h (3000 × g, 20 min, 4°C) and stored at −20°C until analysis of haptoglobin was completed. Haptoglobin was used as a marker of injury, infection or inflammation. Faecal samples were taken from the rectum of each heifer and frozen at −20°C until analysis of faecal glucocorticoid metabolites (GM) to assess the adrenal response of heifers.
Maintenance behaviour
Behaviour of the animals was video-recorded for 24 h on days 8, 9 and 10 of the odd-numbered experimental periods, using 10-min scan sampling. Recorded activities were eating, drinking, rumination, resting, stereotypic behaviours and other activities. Eating was defined as the animal having its head in the feeder and being engaged in chewing. As concentrate and BS were distributed in separate feeders, eating was divided into eating concentrate and total eating. Drinking was recorded when the animal had its mouth in the water bowl. Rumination included mastication movements other than eating. When an animal was lying or standing but without any specific activity, resting behaviour was considered. Stereotypies included licking or biting of fixtures and tongue-rolling. Finally, self-grooming, allo-grooming and rubbing against objects were included in other activities. To analyse daily behaviour patterns, the day was subdivided into 12 intervals of 2 h each starting at the time of feeding.
Chemical analyses
Chemical composition of offered feeds was determined by using the same procedures described in experiment 1. Faecal GM determinations were performed using the commercially available I125 RIA kit (Rats and Mice Corticosterone kit; ICN Pharmaceuticals; Orangeburg, NY, USA) as described by Morrow et al. (Reference Morrow, Kolver, Verkerk and Matthews2002) and González et al. (Reference González, Ferret, Manteca, Ruíz de la Torre, Calsamiglia, Devant and Bach2008b). The intra-and inter-assay CV of the RIA were 12.2% and 15.6%, respectively. The estimated detection limit of GM in faeces was 5.7 ng/g of DM. Haptoglobin was determined by the haemoglobin binding method with the use of a commercial haptoglobin assay (intra- and inter-assay CV of 1.4% and 6.9%, respectively; Assay Phase Range, Tridelta Development Limited, Maynooth, Ireland).
Statistical analyses
All individual data were averaged to obtain pen means at each sampling period over time. The pen was the experimental unit (n = 4) and SAS was used for all statistical analyses (v. 9.1, SAS Institute Inc.). Faecal GM and haptoglobin concentrations were logarithmically transformed to normalize the distribution. Statistical analyses of normally distributed variables were conducted by a mixed-effects regression model for a randomized complete block design with repeated measures using the PROC MIXED. The model contained the fixed effect of treatment, block and treatment × period and block × period interactions. The random effects were modelled through the repeated measure of time subjected to pen, and pen. The choice of the best covariance structure was based on fit statistics (Littell et al., Reference Littell, Henry and Ammerman1998). Slaughterhouse data were analyzed using the GLM procedure of SAS with treatment as fixed effect (SAS Institute Inc.). A mixed-effects logistic regression model was employed in the GLIMMIX to analyse the behaviour patterns within the day. This model contained the fixed effect of treatment, the repeated measure of time interval of the day subjected to the random effect of pen, and their interaction. Significance was declared at P ⩽ 0.05.
Results
Experiment 1
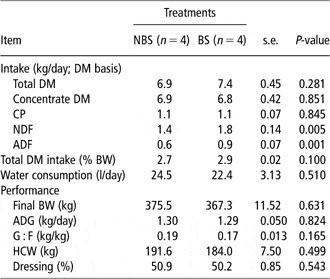
Concentrate DM intake was similar in both treatments (Table 2) and total DM intake tended (P = 0.10) to be higher in BS when expressed as percentage of BW, due to the fact that heifers fed this diet consumed on average 0.6 kg of BS. Crude protein (CP) intake was not affected because of the same concentrate intake and the limited ad libitum intake of BS with a low CP content in heifers fed BS diet. However, this straw intake resulted in higher NDF (P = 0.005) and ADF (P = 0.001) intake in BS heifers. Water consumption was similar between treatments.
Intake, water consumption and performance of heifers fed either NBS or with BS in experiment 1

NBS = without barley straw; BS = barley straw; DM = dry matter; ADG = average daily gain; G : F = gain to feed ratio; HCW = hot carcass weight.
ADG was not affected by diet (Table 2) and the numerically higher total DM intake did not result in differences in gain efficiency. Final BW was not different and slaughterhouse data did not reveal differences between treatments (Table 2). Carcasses were classified with the same conformation and fat score according to the European classification system used (EU regulation No 1208/81, 1026/91; data not shown). After veterinary inspection of carcasses in the slaughterhouse, the number of removed livers in each diet was three out of four in NBS diet and one out of four in BS diet (data not shown).
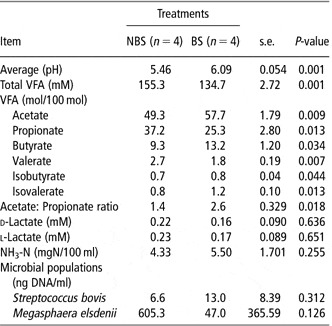
Average ruminal pH was lower (P = 0.001; Table 3) in animals fed the all-concentrate diet. In accordance with the low ruminal pH, total VFA concentration was highest in NBS diet (P = 0.001). Removing the roughage source of the diet resulted in a decrease in acetate, butyrate, isobutyrate and isovalerate (P = 0.009, P = 0.034, P = 0.044 and P = 0.013, respectively), and an increase in propionate and valerate proportion (P = 0.013 and P = 0.007, respectively). The concentrations of d- and l-Lactate were not affected by diet. No differences were detected in ruminal NH3-N concentration between treatments (4.9 ± 1.7 mgN/100 ml). Heifers fed NBS had numerically higher levels of M. elsdenii compared to animals that received straw (Table 3). No changes in S. bovis quantification between treatments were observed.
Ruminal pH, volatile fatty acids, d- and l-Lactate concentrations, ammonia concentration and microbial population of Streptococcus bovis and Megasphaera esldenii of heifers fed either NBS or BS in experiment 1

NBS = without barley straw; BS = barley straw; VFA = volatile fatty acids.
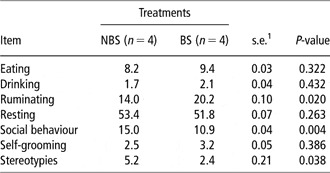
Time spent in eating and drinking was not affected by the treatment (Table 4). In contrast, ruminating was longer in heifers fed BS than those fed NBS diet (P = 0.02). Resting time and self-grooming behaviours were not affected by treatment, but time spent in social (P = 0.004) and stereotypic behaviours (P = 0.038) were longer in heifers fed NBS.
Percentages of daily time spent in each behavioural activity by heifers fed either NBS or BS in experiment 1

NBS = without barley straw; BS = barley straw.
1Data were analysed as the square root-arcsine transformation of the proportion of observations for which the heifers were performing a given activity and are presented back-transformed data.
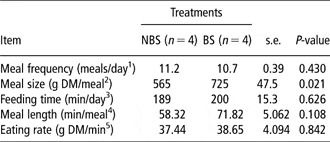
Meal criterion was not affected by diet, so a common value of 21 min was used in both treatments. Meal frequency, feeding time and eating rate were unaffected by diet (Table 5), but meal size was greater in BS than in NBS diet (P = 0.021), and meal length tended to be affected by diet (P = 0.108), being longer in BS than in NBS.
Feeding characteristics of heifers fed a diet either NBS or BS in experiment 1

NBS = without barley straw; BS = barley straw; DM = dry matter.
1Calculated as the number of intervals where eating activity was registered and exceeded the meal criterion.
2Calculated as daily DM intake divided by meal frequency.
3Calculated as the sum of all minute-by-minute observations when the animal was feeding, as reflected by feeder disturbance or feed disappearance (not including non-feeding times).
4Calculated as the time of the last feeding record minus the time of first feeding record within a meal. Meal length was then calculated as the average meal length of the day (sum of the length of all meals within the day divided by meal frequency).
5Calculated as daily DM intake divided by daily feeding time.
Experiment 2
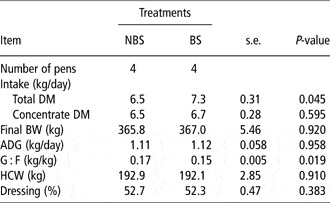
Concentrate DM intake was not different between treatments (Table 6), but total DM intake was higher in BS than in NBS (P = 0.045). As ADG was the same in both treatments, gain efficiency was lower in BS than in NBS (P = 0.019). HCW and dressing percentage were not different between treatments, the carcasses being classified with the same conformation and fat score, according to the European classification system used (EU regulation No 1208/81, 1026/91; data not shown).
Intake and performance of heifers fed a diet either NBS or with BS in experiment 2

NBS = without barley straw; BS = barley straw; DM = dry matter; ADG = average daily gain; G : F = gain to feed ratio; HCW = hot carcass weight.
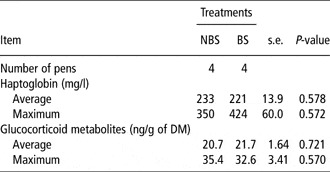
Average blood haptoglobin concentration and faecal GM levels were not different between treatments (Table 7), the average values being 227 ± 13.9 mg/l and 21.2 ± 1.64 ng/g of DM, respectively. Maximum concentrations of both markers were also unaffected by straw exclusion.
Concentrations of blood haptoglobin and faecal glucocorticoids metabolites of heifers fed either NBS or BS in experiment 2

NBS = without barley straw; BS = barley straw; DM = dry matter.
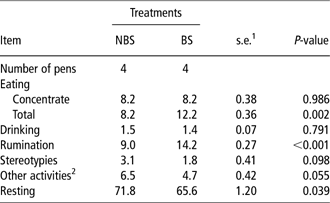
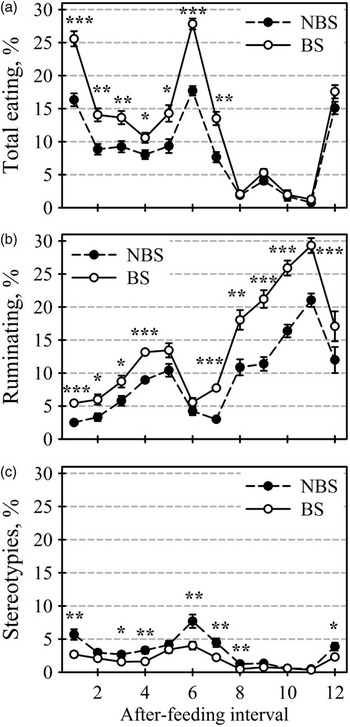
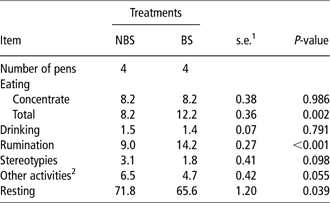
Total eating (P = 0.002) and ruminating (P < 0.001) time were longer in BS than in NBS diet, while resting behaviours (P = 0.039) were longer in NBS than in BS diet (Table 8). Stereotypic behaviour (P = 0.098) and time spent in other activities (P = 0.055) tended to be longer in NBS than in BS diet. In contrast, time spent in eating concentrate and drinking were unaffected by treatments. Circadian rhythms of total eating, ruminating and stereotypic behaviours were similar in both treatments (Figure 1). Daily patterns of concentrate eating time were not different among treatments (data not shown). However, total eating time was longer in BS than in NBS diet in the seven consecutive intervals after feeding during daytimes (Figure 1a). More time was dedicated to ruminating behaviour in BS than in NBS diet in 9 out of 12 intervals but differences among treatments were greatest during nighttimes (Figure 1b). Finally, the stereotypic behaviour of heifers fed NBS diet was more frequent in 7 out of 12 intervals (Figure 1c) and more evident when eating activity was high.
Percentages of daily time spent in each behavioural activity by heifers fed either NBS or BS in experiment 2
NBS = without barley straw; BS = barley straw.
1Data were analysed as the square root-arcsine transformation of the proportion of observations for which the heifers were performing a given activity and are presented back-transformed data.
2Included self-grooming, allo-grooming and rubbing against objects.
Daily patterns of total eating (a), ruminating (b) and stereotypic (c) behaviours, expressed in percentage, in each 2 h after feeding interval of heifers fed either without (NBS) or with barley straw (BS) in experiment 2. Levels of significance are indicated as follows: *=P < 0.05; **=P < 0.01; ***=P < 0.001.

Discussion
The results obtained in both experiments are similar, with no differences between treatments in ADG and concentrate DM intake, whereas total DM intake of heifers fed BS diet tended to be higher in experiment 1 and was significantly higher in experiment 2. In accordance with this last result, gain efficiency was only different between treatments in the feedlot experiment. Moreover, slaughterhouse data were also coincident in the two experiments, without differences in HCW, dressing percentage and carcass characteristics. These results agree with previous research summarized by Wise et al. (Reference Wise, Harvey, Haskins and Barrick1968), who stated that it is possible to achieve the same performance in feedlots whether roughage is supplied or not, without affecting carcass characteristics. More recently, Shain et al. (Reference Shain, Stock, Klopfenstein and Herold1999) compared performance and carcass characteristics in finishing steers fed an all-concentrate diet or a diet containing 5.2% of wheat straw. They observed that although concentrate and total DM intake was higher in animals consuming roughage, no differences in daily gain, gain efficiency and carcass characteristics were noted between steers fed the all-concentrate and straw diets. In this study, in which feed was offered on an ad libitum basis, the BS heifers consumed an average daily proportion of 7.9% and 8.2% of BS (DM basis), in experiments 1 and 2, respectively. Loerch and Fluharty (Reference Loerch and Fluharty1998) and Bierman et al. (Reference Bierman, Erickson, Klopfenstein, Stock and Shain1999) stated that all-concentrate diets fed to feedlot steers support the same growth rate, reduce dry matter intake and improve gain efficiency compared with finishing diets with 10% to 15% of roughage, on DM basis.
Ruminal fermentation was affected by the diet, as expected. The low pH level recorded in experiment 1 could indicate that these heifers suffered a subacute ruminal acidosis. This hypothesis was confirmed in the slaughterhouse, where the number of removed livers in each diet was three out of four in NBS diet and one out of four in BS diet. This confirms previous results registered by Wise et al. (Reference Wise, Blumer, Matrone, Craig and Barrick1965) and Oltjen et al. (Reference Oltjen, Davis and Hiner1965) in all-concentrate diets. However, in experiment 2, no livers were removed in either BS or NBS treatments. This unexpected result is in accordance with the absence of differences in blood haptoglobin concentrations recorded in heifers in this experiment. Acute phase proteins are a group of liver-derived serum proteins whose concentrations change in response to injury, infection or inflammation as part of the systemic response. In cattle, haptoglobin has been found to be a useful marker of inflammation (Horadagoda et al., Reference Horadagoda, Knox, Gibbs, Reid, Horadagoda, Edwards and Eckersall1999). Therefore, we chose haptoglobin to ascertain if calves fed the experimental diet could suffer injuries or bacterial infections associated with low ruminal pH, like liver damage or lipopolysaccharides reaching the bloodstream, but no livers were removed because no abscesses were visible.
Removing the roughage source in the diet caused important changes in the rumen fermentation profile affecting total VFA concentration and molar VFA proportions. Heifers fed BS diet had a higher (P = 0.001) acetate : propionate ratio compared with heifers fed NBS, in accordance with Shain et al. (Reference Shain, Stock, Klopfenstein and Herold1999).
S. bovis is a bacterium with a strong amylolytic activity and the main lactic acid producer (Hungate, Reference Hungate1966; Dawson and Allison, Reference Dawson and Allison1988), and M. elsdenii is the main lactic acid utilizer (Counotte et al., Reference Counotte, Prins, Janssen and DeBie1981), consequently these bacteria play a key role in the development of ruminal acidosis. No changes in S. bovis and M. elsdenii quantifications due to the treatments were detected, although we observed that M. elsdenii levels were numerically higher than S. bovis levels. These results agree with other authors who observed that enumeration of S. bovis was stable and in low numbers in the rumen of adapted high-grain cattle, except when animals are unadapted to grain or during a rapid transition when there could be a high increase of this bacteria (Olumeyan et al., Reference Olumeyan, Nagaraja, Miller, Frey and Boyer1986; Klieve et al., Reference Klieve, Hennessy, Ouwerkerk, Forster, Mackie and Attwood2003; Nagaraja and Titgemeyer, Reference Nagaraja and Titgemeyer2007). Moreover, it is well reported that M. elsdenii is abundant in animals adapted to high grain and it is either not detected or detected in low numbers in animals receiving 100% forage diets (Klieve et al., Reference Klieve, Hennessy, Ouwerkerk, Forster, Mackie and Attwood2003; Krause et al., Reference Krause, Smith, Conlan, Gough, Williamson and McSweeney2003; Brown et al., Reference Brown, Ponce and Pulikanti2006). We also observed an increase of valerate in NBS treatment. This fact could be explained by the numerical increase of M. elsdenii in heifers fed this diet, because it is known that valerate is one of the end products of M. elsdenii fermentation in a media with glucose and lactate (Marounek et al., Reference Marounek, Fliegrova and Bartos1989).
No statistical differences in time spent eating and in total DM intake means that heifers consumed feeds at the same rate, as was confirmed by the intake pattern in experiment 1. In experiment 2, where intake pattern was not recorded, no differences in time spent in eating concentrate and in concentrate intake were found, so it may be assumed that concentrate was consumed at the same rate. Number of meals per day and feeding time were similar in both treatments. In contrast, owing to the fact that animals in BS diet consumed BS, in addition to concentrate, meal size and meal length were greater in this diet. Time spent in drinking was in accordance with previous studies (Rotger et al., Reference Rotger, Ferret, Manteca, Ruíz de la Torre and Calsamiglia2006; Robles et al., Reference Robles, González, Ferret, Manteca and Calsamiglia2007; González et al., Reference González, Correa, Ferret, Manteca, Ruíz de la Torre and Calsamiglia2009) where scan sampling was also used.
The decrease in rumination activity in heifers fed NBS diet in both experiments could be associated with decreased saliva output (Balch, Reference Balch1958), which plays a role in buffering acids produced during ruminal fermentation, and could explain the decrease in ruminal pH in experiment 1. Moreover, this lower rumination activity could also be associated with the increased stereotypic behaviours. Stereotypies consist of a few simple movements that are repeated in the same way over and over again, although they seem to lack any function in the context in which they are performed. These so-called stereotypic behaviours consist of a repeated rolling of the tongue, bar-biting or biting and licking of stall equipment like tether chains or partitions (Redbo, Reference Redbo1990). Redbo and Nordblad (Reference Redbo and Nordblad1997) stated that restricted feeding of roughage induces the development of stereotypies, so a high level of stereotypies, related with a lower or non-roughage intake, might indicate welfare problems (Broom and Fraser, Reference Broom and Fraser2007). A greater presence of stereotypies in heifers fed NBS diet was observed in both experiments, probably indicating that animals suffered some welfare problems. It is important to emphasize that the two peaks of stereotypic behaviour during experiment 2 corresponded with the two peaks in total eating activity. This result could indicate, on one hand, that the extra time that the heifers dedicated to eating straw in BS treatment was occupied by heifers fed NBS for developing a greater stereotypic behaviour, because the time spent in eating concentrate was the same in both treatments, confirming that the development and performance of stereotypies in cattle is strongly related with feeding motivation (Redbo et al., Reference Redbo, Emanuelson, Lundberg and Oredsen1996). On the other hand, the fact that forage deprivation resulted in greater frequency of stereotypic behaviour at the time of reduced feeding activity (daytimes) but not at the time of reduced ruminating activity (nighttimes) may indicate that the drive to chew while eating is behaviourally more important than the drive to chew while ruminating. Moreover, stimuli from the environment, like the sight of neighbouring heifers fed straw, might have maintained a positive feedback on feeding motivation.
Time spent in performing social behaviours in experiment 1 and other behaviours in experiment 2 increased when straw was excluded. This increase was mainly a result of more time spent in allogrooming, although each component of this activity was not registered separately. It is important to notice that inspection at slaughter of the ruminal epithelium and contents revealed a striking amount of hairs in heifers deprived of BS in experiment 1. Longer time spent in allogrooming was particularly evident during the seven intervals of time following feeding (data not shown), as was also the case for stereotypic behaviour, which coincides with the most active feeding times of the day. Heifers therefore developed alternative behaviours when they were prevented from performing a behavioural and evolutionary need such as long chewing times while eating. Allogrooming in cattle is an important behaviour pattern with functional significance for the formation and maintenance of social bonds, the stabilization of social relationships (Sato et al., Reference Sato, Tarumizu and Hatae1993) and a good indicator of general health or thriftiness (Albright and Arawe, Reference Albright and Arawe1997). However, grooming performed for extreme periods of time could also be considered as poor welfare or an indication of stress as shown in other species (Uvnäs-Moberg, Reference Uvnäs-Moberg1999).
Conclusions
In conclusion, removing straw from the diet of female calves from weaning to slaughter weight did not affect concentrate intake, ADG, HCW, dressing percentage and carcass characteristics either in competitive or in non-competitive conditions, but it improved gain efficiency. Ruminal fermentation changed greatly in animals fed without roughage, increasing the risk of ruminal acidosis. Finally, behaviour was altered as a consequence of straw exclusion, reducing rumination activity and increasing stereotypic behaviours, which could reflect some welfare problems.
Acknowledgements
Financial support from Instituto Nacional de Investigaciones Agrarias (INIA Project RTA-011-C2-2) and technical support from Xavier Robles, Pol Llonch, Eva Mainau and Mireia Ramos are acknowledged.