





1. Introduction
Understanding when and why individuals reciprocate trust is central to analyses of cooperation in many economic and social interactions.Footnote 1 This article investigates whether the mode of decision-making matters. In the case of a direct mode, individuals know they are trusted (or not) before effectively deciding to reciprocate trust (or not). In contrast, with contingent decision-making, the reciprocation decision is pre-planned; it is made before observing whether they have been trusted. Although many environments allow individuals to respond directly, others, such as interactions mediated by intelligent machines, naturally involve programmed, contingent decision-making. Moreover, some individuals may be characterized by a stronger tendency than others to behave according to an internally planned, contingent strategy such as reciprocation to trust. Do these different decision modes lead to differences in reciprocation? In other words, is there a hot–cold reciprocation gap, and what mechanism can generate it?
Direct and contingent decision modes differ in the scope for an emotional response (e.g. Loewenstein, Reference Loewenstein2000). Under the direct mode, individuals who are pessimistic about trust are positively surprised when someone actually trusts them, which may prompt them to reciprocate.Footnote 2 Such a response cannot arise under the contingent mode for the simple reason that individuals do not know whether they are being trusted when deciding on a plan of action.Footnote 3 Yet it is not obvious that such an effect appears in practice. For someone who feels it is a duty to reciprocate, the temptation to breach trust looms more strongly with direct than with contingent decision-making, thus requiring a stronger feeling of duty or more self-control to overcome the temptation in the former than in the latter case (Chen & Schonger, Reference Chen and Schonger2024).
We report the results of online experiments designed to investigate the effect of the decision mode on reciprocation in a binary trust game and to shed light on the underlying mechanism. Our Baseline experiment (N = 395) used a setting in which a first mover chose whether or not to trust a second mover, who then decided whether to reciprocate or defect conditional on being trusted. The design and hypothesis are motivated by a utility function that incorporates an emotional–psychological component capturing the potential for positive surprise induced by being trusted (see also Geanakoplos et al., Reference Geanakoplos, Pearce and Stacchetti1989; Ruffle, Reference Ruffle1999).Footnote 4 The experiment included treatments with direct and contingent elicitation of reciprocation. In the direct (Hot) treatments, second movers chose whether to reciprocate after observing the first mover’s choice and could therefore react emotionally to positive surprise. In the contingent (Cold) treatments, second movers specified a response plan before knowing whether they had been trusted, thereby removing any role for surprise in influencing reciprocation.
To induce exogenous variation in the extent of positive surprise within the Hot treatment, we varied the aggregate trust rate across treatments. First movers were divided into two groups: one with a trust rate of 69% and one with a trust rate of 28%. Second movers were matched exclusively with first movers from either the high- or the low-trust group and were informed about the trust rate of the group they were paired with. We conjectured that trust would generate stronger positive surprise in the low-trust condition than in the high-trust condition, in line with the idea that unexpectedness increases the intensity of surprise.Footnote 5 A manipulation check confirmed this conjecture. Our main hypothesis, derived from the model of positive surprise, was that the hot–cold reciprocation gap should be larger when positive surprise is more likely, namely in the low-trust condition of the Hot treatment.
We find no difference in reciprocation between the Hot and Cold treatments in the first round, but behavior diverged thereafter. While the hot reciprocation rate remained largely stable across rounds, the cold reciprocation rate declined over time, ultimately leading to a 10.3 percentage–point hot–cold gap in the final rounds (P = 0.037).Footnote 6 Consistent with the surprise hypothesis, the divergent pattern was more pronounced in the low-trust condition – where second movers were more likely to be surprised by trust – than in the high-trust condition.
We implemented an additional experiment to examine the role of intentions, which play a central role in models of reciprocity (Dufwenberg & Kirchsteiger, Reference Dufwenberg and Kirchsteiger2004). Following Cox (Reference Cox2004), we removed the intentional nature of trust by programming the first movers’ choices. This allowed us to test whether positive surprise – and any resulting reciprocation – can arise from mechanically generated ‘trust,’ or whether it requires an intentional act by the first mover. Aside from this change, the design was identical to our Baseline experiment. We find that removing intentions eliminates the hot–cold reciprocation gap, indicating that the intentionality of trust is essential for positive surprise to translate into higher reciprocal behavior.
A third experiment followed the same set-up as our Baseline experiment but additionally elicited second-order beliefs from second movers, as these have been linked to reciprocation through guilt aversion (Charness & Dufwenberg, Reference Charness and Dufwenberg2006). We first elicited first movers’ beliefs about the overall reciprocation rate in the experiment and then asked second movers, before each round, to guess the average belief of all first movers who chose to trust. This design allowed us to verify that hot and cold decision-making did not generate different second-order beliefs, conditional on the aggregate trust rate, thereby ruling out psychological mechanisms other than surprise. We find no such differences. However, the elicitation of second-order beliefs per se altered behavior in the trust game. Relative to the Baseline experiment, hot reciprocation rates were somewhat lower but remained fairly stable across rounds, whereas cold reciprocation rates started off and remained substantially higher, reversing the hot–cold reciprocation gap in initial rounds. Evidence from a post-experimental questionnaire indicates that belief elicitation substantially increased perceived cognitive load of the experiment. We conjecture that this additional cognitive burden led relatively more participants to instinctively reciprocate in the Cold treatments – where formulating a response plan is more demanding – compared to the Hot treatments (see Section 4.4 for a discussion).
The paper contributes to the literature on how the decision mode affects choices in sequential-move games involving trust and reciprocation, such as trust games, conditional cooperation games, and sequential prisoner’s dilemma games. From the survey by Brandts and Charness (Reference Brandts and Charness2011), we know that the effect on the reciprocation rate, which is the focus of our study, can go either way and is not well understood.Footnote 7 Most studies report statistically insignificant effects. Especially in games where a continuum of trust and reciprocation levels are possible – as in conditional public goods games and standard trust games – or in the case of repeated interaction, the decision mode has little effect on reciprocation choices (e.g. Fischbacher et al., Reference Fischbacher, Gächter and Quercia2012; Johnson & Mislin, Reference Johnson and Mislin2011; Reuben & Suetens, Reference Reuben and Suetens2012). Casari and Cason (Reference Casari and Cason2009) found that trustees sent back more money under direct elicitation. Brandts and Charness (Reference Brandts and Charness2000) and García-Pola et al. (Reference García-Pola, Iriberri and Kovářík2020) are most closely related to our paper in terms of design (between subjects) and choice setting (one-shot setting with binary choices). In García-pola et al. (Reference García-Pola, Iriberri and Kovářík2020), participants stopped substantially earlier in hot than in cold (symmetric) centipede games while in Brandts and Charness (Reference Brandts and Charness2000), reciprocation rates in sequential prisoner’s dilemma games do not differ statistically between hot and cold. Opposite effects are also reported by Solnick (Reference Solnick2007). Our paper explores mechanisms behind hot–cold reciprocation gaps and contributes by showing hot–cold gaps are the outcome of two countervailing forces: surprise, which pushes behavior toward more reciprocation under direct decision-making, and cognitive load, which tends to reverse this pattern by pushing individuals to adopt a reciprocal strategy when elicited contingently.
The remainder of the paper is organized as follows. Section 2 outlines the theoretical framework and derives the main testable predictions. Section 3 presents the design of the experiments and the associated hypotheses. Section 4 reports the main results and examines the underlying mechanisms. Section 5 concludes.
2. Theoretical background
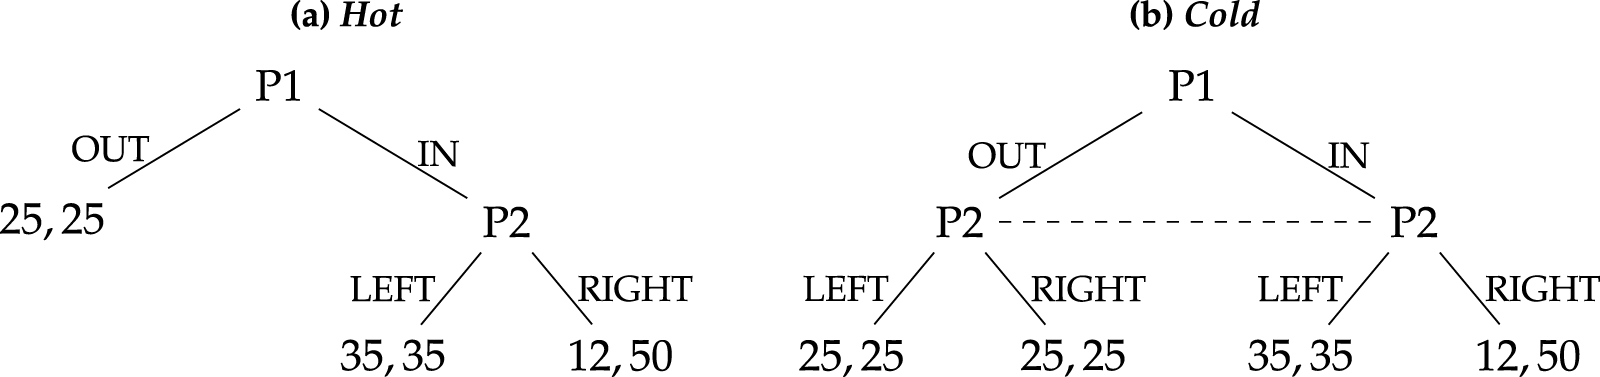
Consider a two-player binary trust game in which both players earn 25 if the first mover does not trust the second mover; both earn 35 if the first mover trusts the second mover and the latter reciprocates; and the first mover earns 12 while the second mover earns 50 if the first mover trusts and the second mover defects. The second mover’s choices are elicited either under hot decision-making (the Hot game) or under cold decision-making (the Cold game), as illustrated in Fig. 1. In the Hot game, the second mover makes her choice after observing whether the first mover trusted her (i.e., chose IN). In the Cold game, she makes a choice, conditional on being trusted. Hence, her optimal choice depends on her expectation about the first mover’s choice in the latter game but not in the former game. Let p denote the ex ante probability with which the second mover expects the first mover to trust her.
Binary trust games

1 Long description
The figure shows two game trees. In Hot, the first mover chooses OUT or IN; if IN, the second mover then chooses LEFT or RIGHT. Payoffs are 25,25 after OUT; 35,35 after IN-LEFT; and 12,50 after IN-RIGHT. In Cold, the second mover chooses a contingent response before observing whether the first mover chose OUT or IN; the two second-mover decision nodes are connected by a dashed information set.
To derive testable predictions, we first examine the best reply of a payoff-maximizing second mover and then introduce our psychological typology.Footnote 8 If the second mover is a payoff maximizer, the payoffs in Fig. 1 coincide with her utility. In the Hot game, her best reply to trust is to defect irrespective of p. In contrast, in the Cold game, the best reply depends on p: if p > 0, defecting yields a strictly higher expected payoff than reciprocating, making defection optimal; if p = 0, the expected payoffs of defecting and reciprocating are identical, leaving her indifferent between the two actions.Footnote 9
We analyze next the trust game as a psychological game by allowing the second mover to gain additional utility from reciprocating when she is surprised by the trust shown by the first mover.Footnote 10 Such psychological utility can arise only in the Hot game, because only in that setting does the second mover observe the first mover’s actual choice before deciding. We assume that the extent to which the second mover cares about the first mover’s payoff depends on her surprise sensitivity denoted by θ ≥ 0 and the surprise level denoted by S(p).Footnote 11 The function S is decreasing in p, such that the lower the expectation that the first mover will trust her, the more surprised the second mover is when the first mover does. To focus on the role of surprise, we assume that utilities are equal to monetary payoffs, apart from the surprise component.
Hence, the second mover’s utility is:
 \begin{equation}{U_{\text{2}}}{\text{ = }}{\pi _{\text{2}}}{\text{ + }}\theta S{\text{ (}}p{\text{) }}{\pi _{\text{1}}}\end{equation}
It follows that, in the Hot game, the second mover reciprocates if 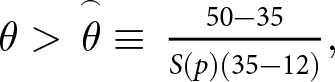 $\theta \gt \,\overset{\smash{\scriptscriptstyle\frown}}{\theta } \equiv \,\frac{{50 - 35}}{{S\left( p \right)\left( {35 - 12} \right)}},$ with S(p) > 0. In contrast, in the Cold game, she finds it optimal to defect because surprise cannot arise, that is, S(p) = 0. If she assigns a strictly positive probability to being trusted, then she will defect, and if she believes that the first mover will not trust her, then she is indifferent between the two actions.Footnote 12
In summary, if at least some second movers are motivated by positive surprise and as long as p > 0, two predictions follow.Footnote 13 First, for a given p, the reciprocation rate will be (weakly) higher in the Hot game than in the Cold game. Second, the reciprocation gap between the Hot game and the Cold game is expected to narrow as p increases.
3. The experiments
3.1. Design and hypothesis
We refer to our main experiment as Baseline. Participants were assigned the role of either first or second mover. First movers decided whether to trust a randomly matched second mover in a trust game with payoffs as in Fig. 1. Second movers were informed about the trust rate among the first movers from whose population their partners were drawn and then made their choices. Second movers were randomly assigned, in a between-subjects design, to one of four treatment conditions varying along two dimensions: the decision mode (Hot or Cold) and the induced prior belief about trust, p (Low or High).
We exogenously varied p to manipulate the scope for positive surprise. To implement the Low and High conditions, the pool of first movers was divided into two groups: one with a low trust rate (0.28) and one with a high trust rate (0.69).Footnote 14 Second movers were then matched exclusively with first movers from either the low- or the high-trust group. We conjectured that a higher trust rate would induce a more optimistic prior about trust, thereby reducing the level of surprise when encountering a trusting first mover in Hot.
After completing 20 trust games with different first movers, second movers answered a brief survey that included a question on the surprise they experienced. The response served as a manipulation check for the variation in trust rates within Hot. Specifically, we asked them to rate their level of surprise (‘not surprised,’ ‘somewhat surprised,’ or ‘surprised’) at the trust shown by the first mover in games where trust was chosen. In Hot, participants assigned to the High condition were significantly less likely to report being surprised: the percentage reporting ‘surprised’ or ‘somewhat surprised’ was 9–18 points lower than in the Low condition, depending on the specification (P ≤ 0.045; see Table D.1 in the Appendix). This confirms that the induced variation in prior beliefs successfully altered the scope for positive surprise.
The hypotheses follow directly from the predictions of the surprise model in Section 2:
Surprise hypothesis. (a) The reciprocation rate is (weakly) higher in Hot than in Cold in both Low and High. (b) The difference in reciprocation rates between Hot and Cold is (weakly) larger in Low than in High.
3.2. Intentions and second-order beliefs
Intentions. We implemented an additional experiment – the No Intentions experiment – that replicated the setup described above, except that first movers’ choices were programmed rather than made by actual participants. The programmed trust decisions exactly matched the trust rates used in the Low and High treatments of the Baseline experiment. All other aspects of the design were identical. Hence, the key difference between this experiment and the main one lies in the presence of an intentional act of trust. This design allows us to test whether surprise is triggered only by an intentional expression of trust, or whether it can also arise when ‘trust’ is mechanically generated (see Cox, Reference Cox2004).
Second-order beliefs. Psychological mechanisms based on second-order beliefs – such as guilt aversion and intention-based reciprocity – are well-known drivers of reciprocation.Footnote 15 Because second-order beliefs may be positively affected by the communicated trust rate, they likely differ between the Low and High conditions, potentially affecting reciprocation through guilt aversion or intention-based reciprocity. Although this possibility does not per se invalidate our identification strategy for testing the surprise hypotheses, a key identifying assumption is that second-order beliefs do not differ between Hot and Cold within both Low and High.
To assess this assumption, we implemented another experiment identical to the Baseline experiment – with the same Low and High trust rates – but adding an incentivized second-order belief elicitation stage. We refer to this as the Beliefs experiment. First, we elicited first-order beliefs from first movers about the overall reciprocation rate in the experiment before they had made their trust decision. Next, we elicited second-order beliefs from second movers by asking them, before each round, to guess the average first-order belief of all first movers who chose to trust.Footnote 16 To minimize any influence of the belief elicitation on reciprocation decisions, second movers did not receive feedback about the accuracy of their beliefs after each round.
3.3. Procedures
All experiments were programmed in Qualtrics and conducted on Prolific. Section B in the Appendix details the implementation timeline, its correspondence with our preregistrations, and the number of participants recruited for each experiment. Participation was restricted to students based in the UK, and we targeted a sample of 100 second movers per treatment.Footnote 17 To ensure comprehension of the instructions, participants were required to correctly answer a set of control questions before proceeding; they could make up to six attempts, and those who failed were excluded. The instructions for the High treatments are provided in Section C of the Appendix.
In the Baseline and Beliefs experiments, the design was asynchronous: first movers completed the task before second movers were recruited. Each first mover made a single-trust decision without knowing which treatment group their matched second mover would later be assigned to. These decisions served solely to incentivize second movers’ behavior and are therefore not analyzed. Each second mover then played 20 rounds of the game, each time with a different first mover, and was informed about the trust rate in the population of first movers they were matched with (either 0.28 or 0.69). After each round, second movers in Cold received feedback on the first mover’s choice, and all participants received feedback on their payoffs. In the No Intentions experiment, first-mover actions were pre-programmed to match the trust rates of the Low and High conditions.
To ensure an equal start and an equal number of observations in Hot and Cold – and thus sufficient statistical power – we arranged the games so that in the first round all second movers faced a trusting first mover.Footnote 18 We shall interpret first-round choices of second movers as their instinctive responses. After the 20 rounds, participants completed a short survey including socio-demographic questions (gender, age, and education), measures of social preferences, perceived task complexity, and the level of surprise experienced. One round was then randomly selected for payment to both the second mover and their matched first mover. Second movers completed the experiment in about 8 to 14 minutes and earned £2.80 on average, including a £0.60 participation fee.
3.4. Sample compositions and balance
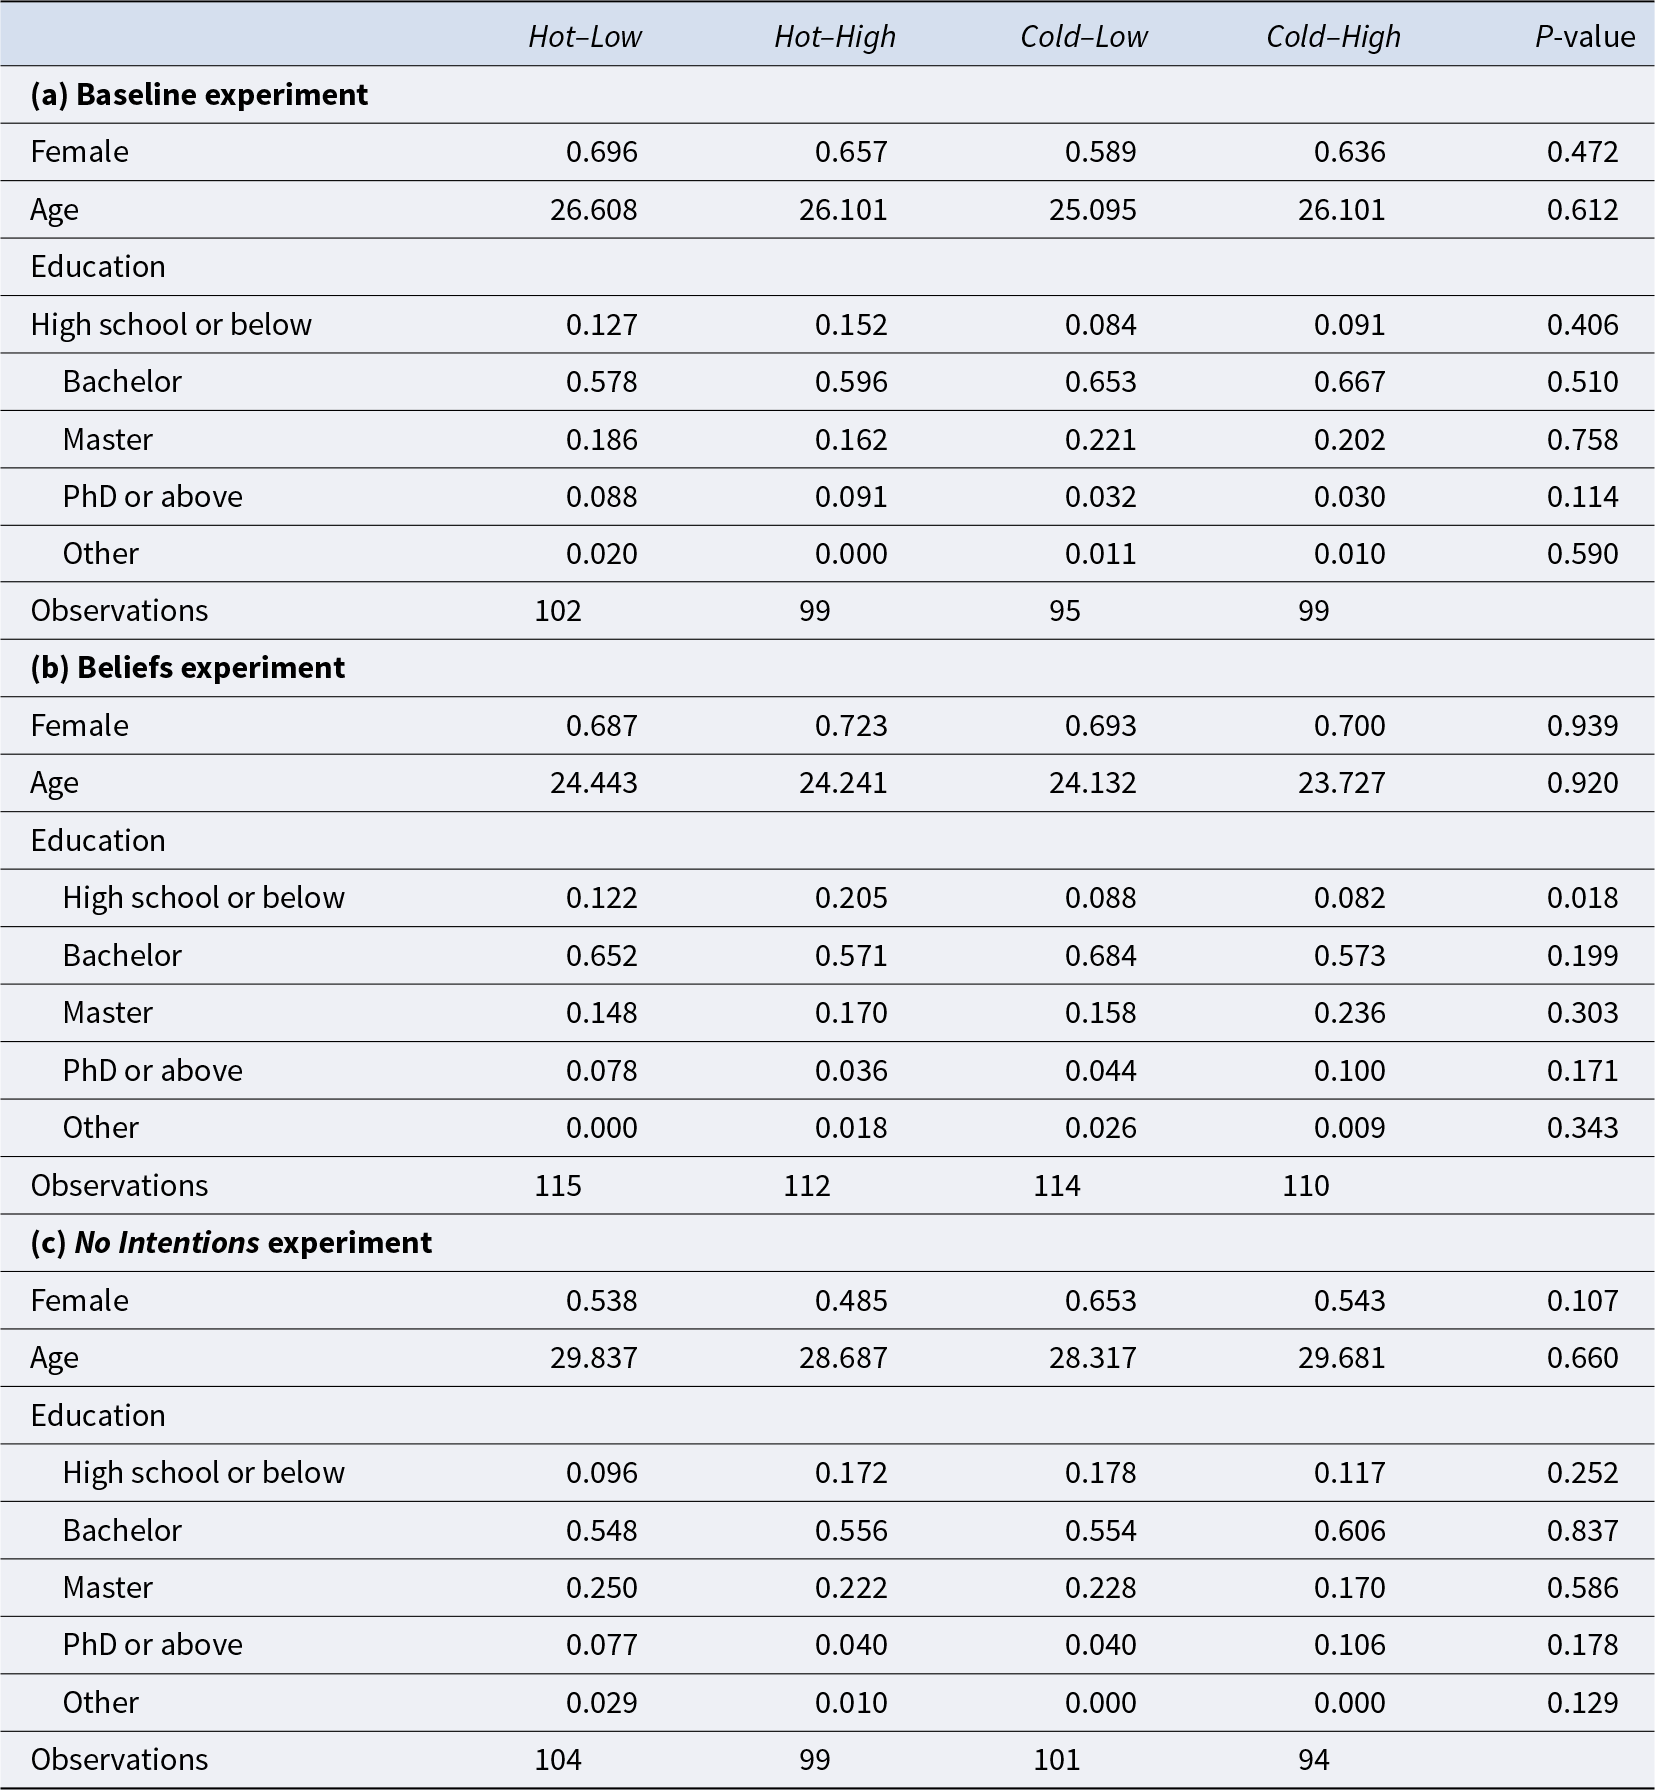
Table 1 reports descriptive statistics on the composition of the estimation samples by experiment and treatment. Across all experiments, participants were predominantly undergraduate students, and the share of female participants was slightly higher than that of males. To assess balance in socio-demographic characteristics across treatments within each experiment, we compare gender, age, and education using post-experimental survey data. Within each experiment, socio-demographic differences across treatments are small and generally not statistically significant. The only exception is in the Beliefs experiment, where the share of participants with at most a high-school diploma is significantly higher in the Hot–High treatment than in the other three conditions. To account for this imbalance, we control for educational background when estimating treatment effects on reciprocation as a robustness check. Small differences in the number of observations reflect attrition. Among second movers who entered the decision-making stage, the attrition rates ranged from 0.1 to 0.2 across treatments and were balanced in all experiments (P > 0.422 according to Wald tests from probit regressions; see Section B in the Appendix for details).
Sample characteristics and treatment balance

Table 1 Long description
The table reports gender, age, education, and observations by treatment for the Baseline, Beliefs, and No Intentions experiments. Most treatment differences within each experiment are small and statistically insignificant. The main exception is education in the Beliefs experiment, where the share with high school or below differs across treatments.
Notes: The table reports averages of socio-demographic variables across treatments for each estimation sample, separately for each experiment. The last column shows P-values from joint Wald tests of equality across treatments. For each experiment, P-values are obtained from regressions of the corresponding variable on treatment indicators: linear probability models for the dummy variables (Female and education categories) and OLS for Age.
Across experiments, some socio-demographic differences emerge, most notably between No Intentions and Baseline (see Table D.2 in the Appendix). Participants in No Intentions were, on average, about three years older and less often female. Participants in Beliefs were, on average, two years younger than those in Baseline. These moderate differences likely reflect the staggered implementation of the experiments and the exclusion of previous participants; note that the Beliefs experiment was conducted before the other experiments. While there is no theoretical reason to expect that demographic or timing differences systematically bias treatment comparisons, we include socio-demographic controls in the few analyses that pool data across experiments.
4. Results
4.1. Hot–cold reciprocation gap and surprise
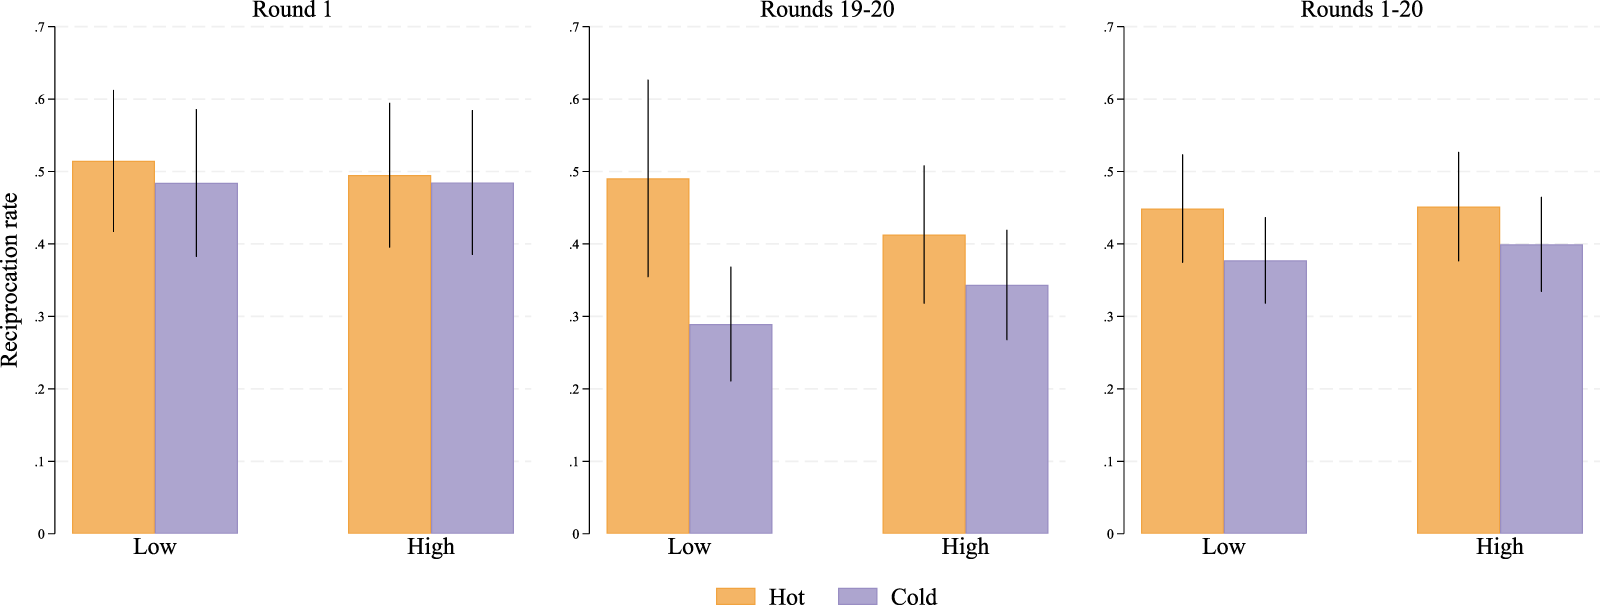
We begin with the Baseline experiment. Figure 2 shows reciprocation rates in the Hot and Cold treatments, separately for the Low and High conditions and across first, last two and all rounds.Footnote 19 In the first round, reciprocation is slightly higher in Hot than in Cold, but the difference is negligible. Over time, however, a hot–cold reciprocation gap appears and widens: in the final rounds, the reciprocation rate under Low is 17.73 percentage points higher in Hot than in Cold, whereas the gap under High is only 6.58 percentage points Pooling all rounds, reciprocation remains higher in Hot, though the aggregate difference is small because it combines early rounds – where rates are similar – with later rounds – where they diverge.
Reciprocation rates in the Baseline experiment

Fig. 2 Long description
The figure compares predicted reciprocation rates in Hot and Cold treatments, separately for Low and High trust conditions, for round 1, rounds 19-–20, and all rounds. In round 1, Hot and Cold are similar. In the final rounds, Hot exceeds Cold, with a larger gap in Low than in High.
To formally test the surprise hypothesis, we estimate linear probability models with the choice to reciprocate as the dependent variable. Results are reported in Table 2. In the first specification, we test part (a) of the hypothesis – that reciprocation is more likely in Hot than in Cold within both Low and High – by regressing the reciprocation decision on the indicators Hot and High. In the second specification, we test part (b) of the hypothesis – that the hot– cold reciprocation gap is larger under Low than under High – by including the interaction term between Hot and High.Footnote 20 All regressions control for age, gender, and education.
Treatment effects on reciprocation in the Baseline experiment

Table 2 Long description
The table reports linear probability model estimates for round 1, rounds 19–20, and all rounds. Hot has little effect in round 1, but in rounds 19–20 Hot increases reciprocation. The Hot by High interaction is negative, as predicted by the surprise hypothesis, but imprecisely estimated.
Notes: Estimates from linear probability models. The dependent variable equals 1 if the participant chose to reciprocate. Standard errors are reported in parentheses; in Columns (3)–(6), they are clustered at the individual level. All regressions control for age, gender, and education. * p < 0.10, ** p < 0.05, *** p < 0.01.
Consistent with part (a) of the surprise hypothesis, the Hot effect is positive in both Low and High treatments. In the last two rounds, the non-interacted specification yields a Hot coefficient of 0.103 (P = 0.037), whereas the interacted model implies a Hot effect of 0.177 under Low (P = 0.030) and 0.065 under High (P = 0.289). In line with part (b), the estimated interaction term Hot × High is negative – as predicted – but imprecisely estimated (P = 0.275).
Results are robust to using probit models and to excluding socio-demographic controls (see Tables D.3 and D.4 in the Appendix, respectively). Treatment effects also remain strong – and become statistically significant across all rounds – when controlling for individual reciprocity attitudes, measured using the validated Preference Survey Module by Falk et al. (Reference Falk, Becker, Dohmen, Huffman and Sunde2023), which are strongly and positively correlated with the decision to reciprocate (see Table D.5 in the Appendix). We do not include these measures in our main specifications because they were elicited after the experimental tasks and therefore constitute post-treatment variables that may themselves be affected by the treatment.
In summary, in the Baseline experiment, the Hot condition led to higher reciprocation after learning, particularly in Low, consistent with the surprise intuition. In line with this interpretation, second movers in Hot–Low reported being more surprised by trust than those in Hot–High, as shown in Table D.1 in the Appendix. Taken together, these findings support the main implication of the surprise hypothesis. The gap between conditions widens with experience, especially under Low, suggesting that surprise can shape reciprocation behavior. We return to the dynamics across rounds and the role of experience in Section 4.3.
4.2. The role of intentions
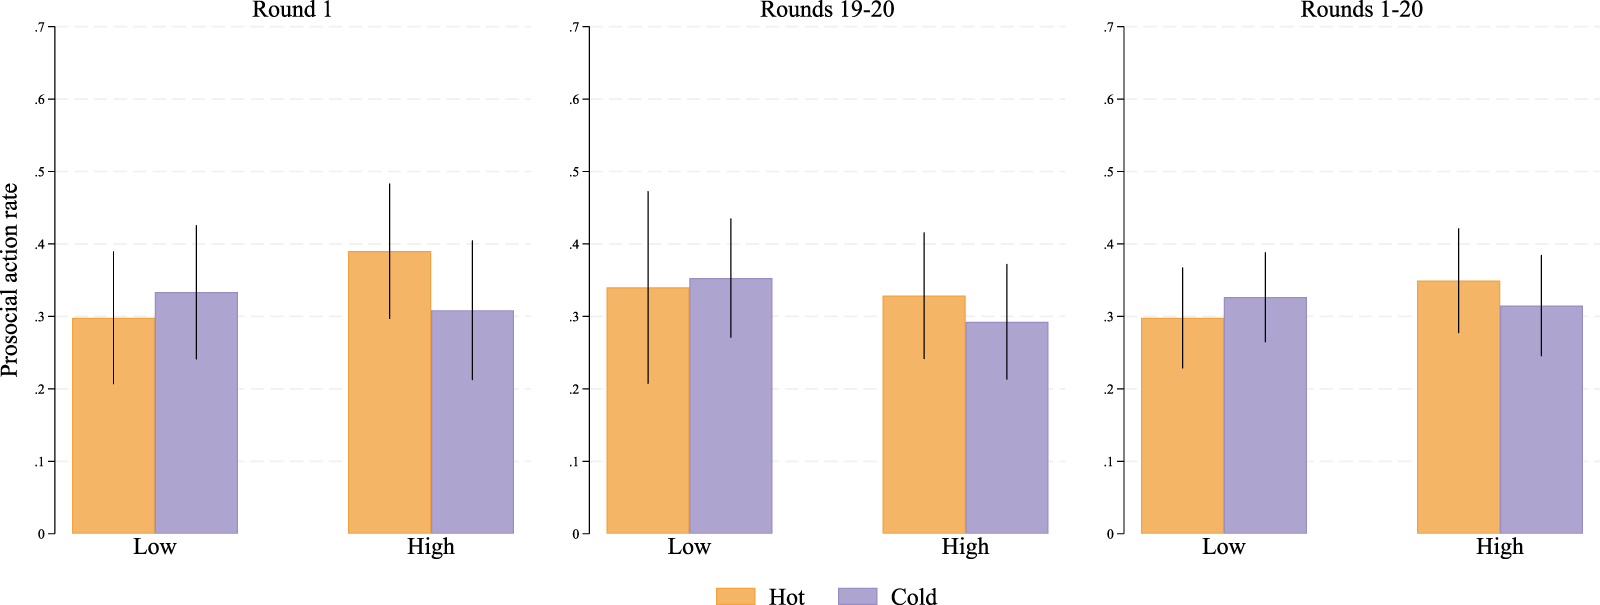
We next turn to the No Intentions experiment, in which the decision to trust was pre-programmed by the experimenter according to earlier first-mover choices. Figure 3 shows that the hot– cold reciprocation gap observed in the Baseline experiment disappears: the share of prosocial choices is now similar across all treatments. Regression estimates confirm this result – none of the treatment effects or interactions are statistically significant (P ≥ 0.269, Table D.7 in the Appendix), and differences across round blocks are small. This finding indicates that the surprise mechanism operates only when trust is perceived as a deliberate act by another person.
Reciprocation rates in the No Intentions experiment

Fig. 3 Long description
The figure compares predicted prosocial action rates across Hot–Low, Hot–High, Cold–Low, and Cold–High in the No Intentions experiment for round 1, rounds 19–20, and all rounds. Rates are similar across treatments, indicating no clear hot–cold reciprocation gap when trust is mechanically generated.
This interpretation is consistent with the significantly lower reciprocation rates observed across all treatments and rounds of No Intentions relative to the Baseline experiment, echoing previous evidence that reciprocation differs from purely outcome-based preferences (Cox, Reference Cox2004). In the Cold condition, participants in No Intentions reciprocated roughly 6–8 percentage points less often than in Baseline (P ≤ 0.096 in regressions, see Table D.8 in the Appendix), and the gap widened to about 11 percentage points in the Hot condition (P ≤ 0.018). The somewhat larger drop in Hot suggests that the influence of surprise diminishes when trust is not perceived as an intentional choice by another person, thereby reducing the motivation to reciprocate.
4.3. Second-order beliefs and complexity
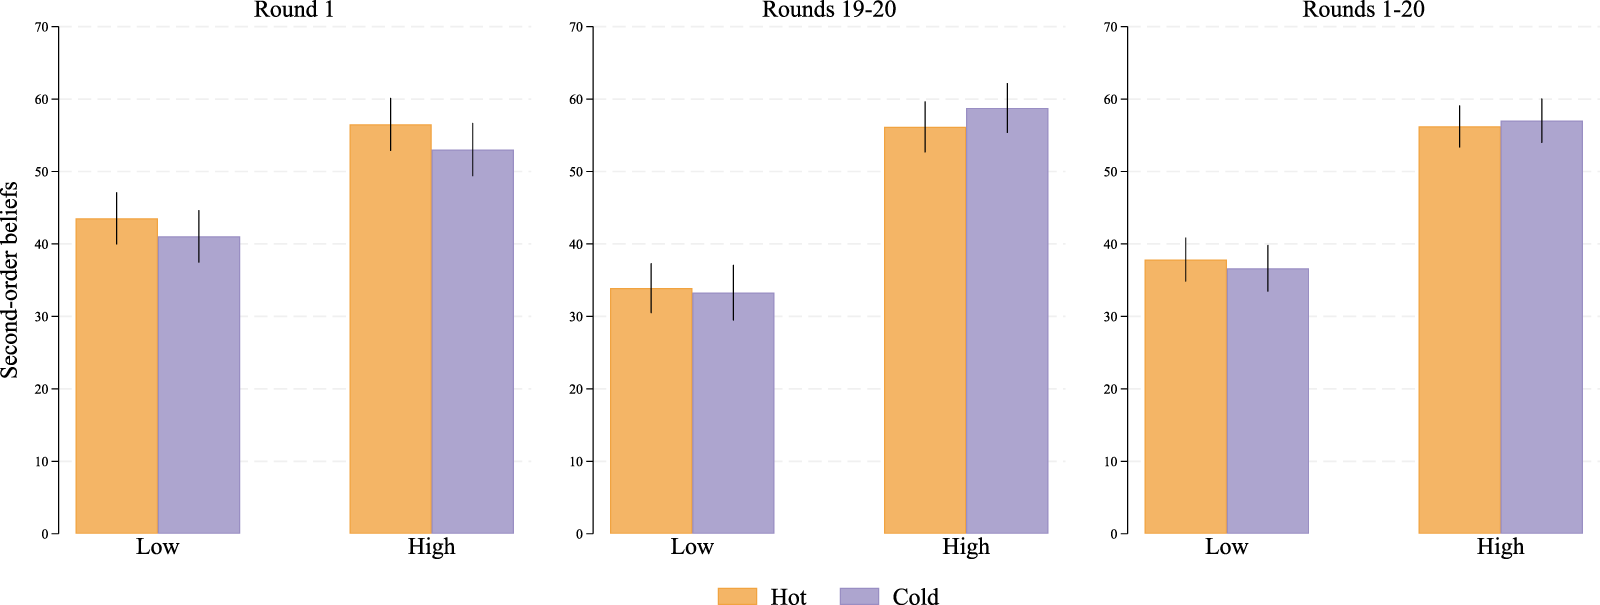
Finally, we report on the Beliefs experiment, in which second-order beliefs were elicited to assess whether alternative psychological mechanisms – such as guilt aversion or intention-based reciprocity – could confound our interpretation. As shown in Fig. 4, second-order beliefs do not differ significantly between the Hot and Cold conditions after controlling for the aggregate trust rate. In the last two rounds, second movers in the Low condition guessed, on average, that first movers expected a reciprocation rate of 33.90% in Hot and 33.28% in Cold (P = 0.811), whereas in High they expected 56.16% and 58.77%, respectively (P = 0.291).Footnote 21 This result shows that the difference in reciprocation between Hot and Cold cannot be explained by a difference in second-order beliefs.Footnote 22
Second-order beliefs in the Beliefs experiment

Fig. 4 Long description
The figure reports predicted second-order beliefs by treatment in the Beliefs experiment. Beliefs differ mainly between Low and High trust-rate conditions, but within each trust-rate condition they are similar under Hot and Cold, especially in the final rounds.
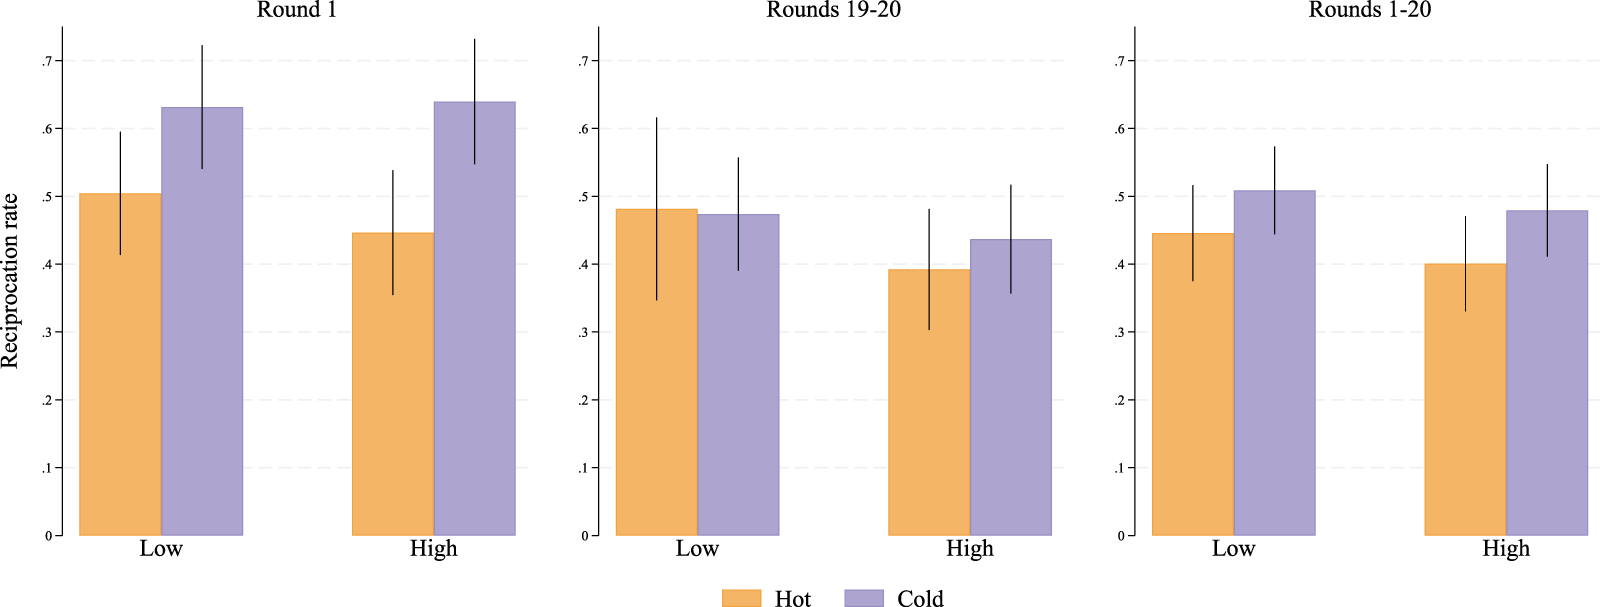
Nonetheless, the pattern of reciprocation in the Beliefs experiment runs opposite to that observed in the Baseline experiment and to the prediction of the surprise hypothesis: reciprocation is higher in the Cold than in the Hot treatment. As shown in Fig. 5, reciprocation rates in Cold consistently exceed those in Hot, particularly in the first round (P = 0.001). This result remains robust when controlling for the second-order beliefs reported by second movers, which, in both the Hot and Cold conditions, are significantly and positively correlated with the decision to reciprocate, consistent with models of guilt aversion (Table D.9 in the Appendix).Footnote 23
Reciprocation rates in the Beliefs experiment

Fig. 5 Long description
The figure compares predicted reciprocation rates in the Beliefs experiment for round 1, rounds 19–20, and all rounds. Reciprocation is generally higher in Cold than in Hot, especially in the first round, reversing the pattern observed in the Baseline experiment.
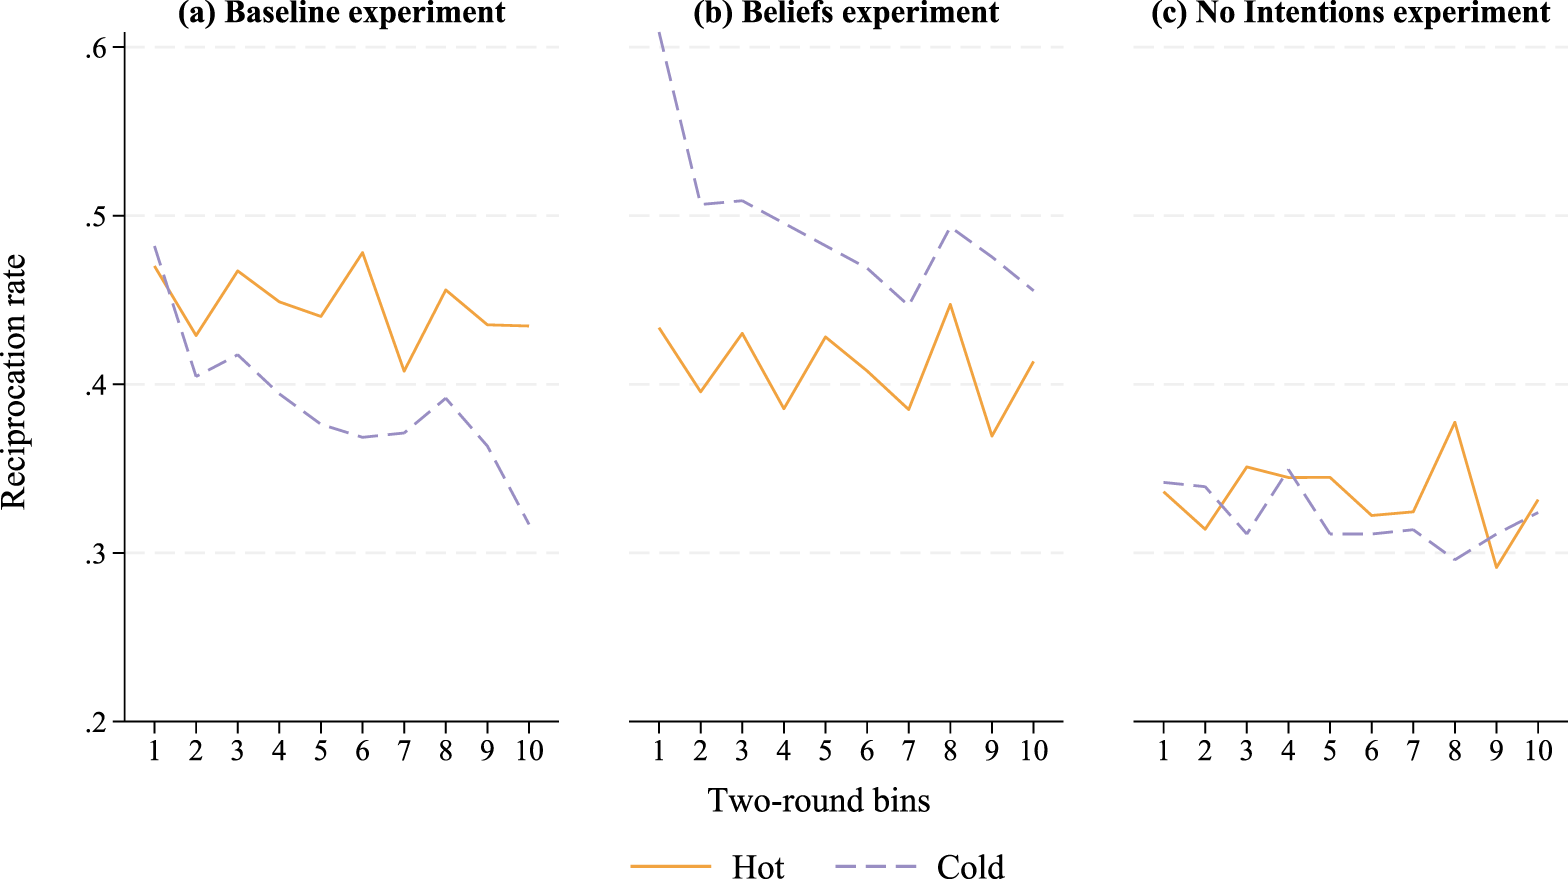
If we compare reciprocation rates in the Beliefs experiment to those in the Baseline experiment, it becomes clear that the difference in the hot–cold gap is entirely driven by different choices in the Cold treatments. As illustrated in Fig. 6, while reciprocation rates under Hot are similar in the two experiments, the cold reciprocation rate is more than 10 percentage points higher in Beliefs than in Baseline (see also Table D.8 in the Appendix). Moreover, whereas hot reciprocation rates remain relatively stable across rounds, cold reciprocation rates show a marked declining trend (see Table D.13 in the Appendix).Footnote 24 Given the comparable Hot rates across experiments, the upward shift in cold reciprocation rates – driven by levels rather than trends – reverses the sign of the hot–cold reciprocation gap: in Baseline, the gap is positive and widens over time, whereas in Beliefs it is negative and narrows in later rounds. Thus, the difference between the two experiments primarily reflects higher cold reciprocation levels in the Beliefs experiment.
Trends in reciprocation rates

Fig. 6 Long description
The figure plots average reciprocation rates over two-round bins, pooling Low and High conditions, separately for Hot and Cold within each experiment. Hot rates are relatively stable. Cold rates decline over time in the Baseline and Beliefs experiments, while the No Intentions experiment shows little systematic pattern.
4.4. Difference between the baseline and beliefs experiments
This section further discusses the difference between the Baseline and Beliefs experiments. The reversal in the hot–cold reciprocation gap is unlikely to be driven by a difference in sample composition or by a general downward time trend in reciprocation between the two experiments. The first explanation can be ruled out because samples are well balanced across key socio-demographic characteristics; any small residual imbalances are accounted for by the controls included in the regressions (Tables D.2, D.8, and D.13 in the Appendix). Although the Baseline experiment was conducted about five years after the Beliefs experiment, we can also rule out the downward trend explanation, as reciprocation rates in the Hot condition did not differ significantly across experiments.
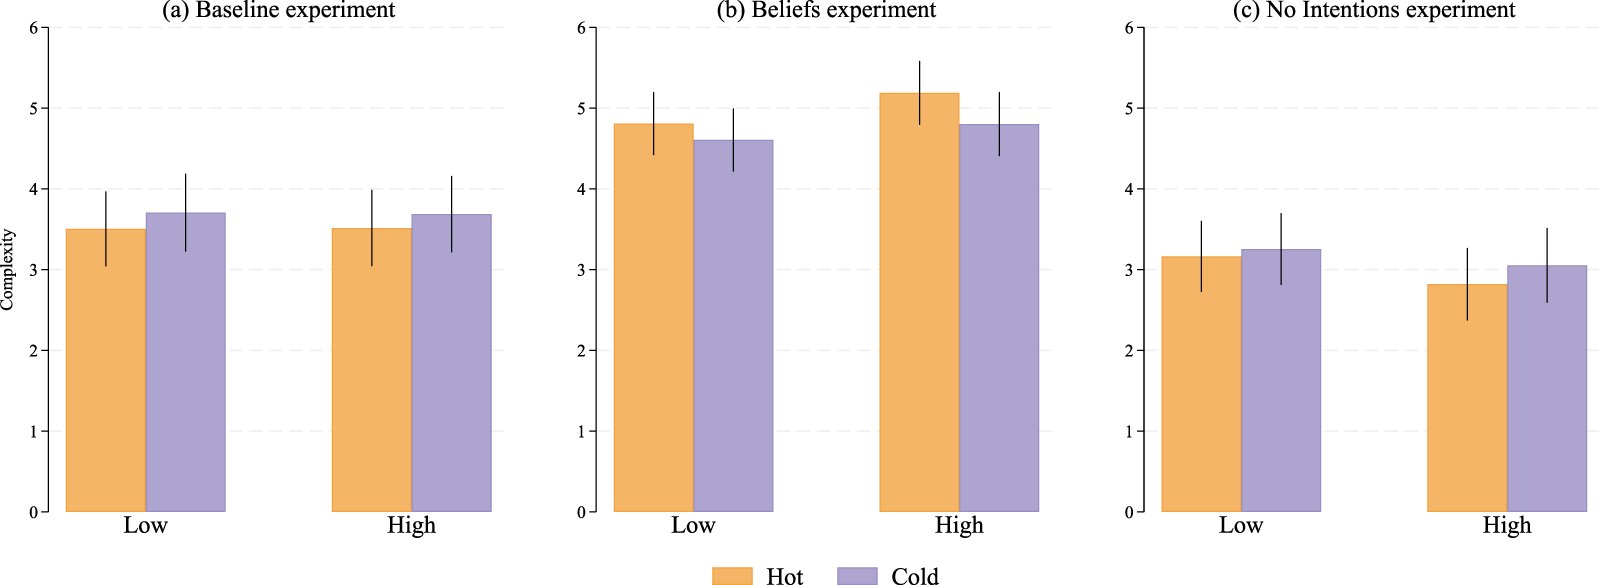
A plausible explanation lies in differences in cognitive load between the Baseline and Beliefs experiments. We find that the belief-elicitation stage implemented before each reciprocation decision – the only difference between the two experiments – increased cognitive load.
Specifically, participants perceived the latter experiment as more complex than the former experiment according to a post-experimental questionnaire. This can be seen in Fig. 7, which shows self-reported complexity measured on an 11-point Likert scale (see also Table D.14 in the Appendix). Why could the higher complexity have had a larger effect on reciprocation in Cold than in Hot? We conjecture that cold decision-making is less straightforward than hot decision-making and therefore cognitively more demanding, which might be particularly consequential in combination with other cognitively demanding tasks (such as belief elicitation in the Beliefs experiment). As can be seen in Fig. 6, reciprocation rates in Cold show a starkly declining trend, in contrast to Hot, suggesting that second movers in Cold ‘unlearn’ to reciprocate, which in turn suggests that the initially high reciprocation rates might have largely been due to instinctive reflexes (see Section 5 for a discussion).
Differences in self-reported complexity

Fig. 7 Long description
The figure reports predicted self-reported complexity scores on a 0–10 scale. Participants report the Beliefs experiment as more complex than the Baseline experiment, consistent with the belief-elicitation task increasing perceived cognitive load.
5. Conclusion
Understanding the conditions under which people reciprocate another person’s trust has been a recurring theme in the literature. We conducted experiments to compare reciprocation rates in a binary trust game between direct and contingent decision modes, using a design that can shed light on the effect of being positively surprised by a partner’s trust. In a real-world economic context, our direct mode corresponds to settings in which individuals respond to trust after observing it, such as trust in workplace, professional-service, or trade relationships. Our contingent mode of decision-making captures situations in which reciprocal responses are determined and programmed ex ante and implemented automatically. Examples include automated bonus or discount mechanisms on e-commerce platforms and telematics-based insurance pricing (Reimers & Shiller, Reference Reimers and Shiller2019).Footnote 25 Our results show that, in conditions where cognitive resources are not depleted, individuals are more likely to reciprocate trust with direct than with contingent decision-making. In the case of cognitive depletion, however, the hot–cold reciprocation gap may reverse.
The findings are overall consistent with the presence of two countervailing mechanisms: positive surprise and a duty to reciprocate. Positive surprise about trust induces reciprocation under hot decision-making and may thus lead to a positive hot–cold reciprocation gap, but this may be counteracted by the presence of a duty to reciprocate. Specifically, individuals who experience actual trust and feel a duty to reciprocate may require a stronger sense of duty to overcome the temptation to defect than individuals who merely imagine that someone trusts them, thus leading to a negative hot–cold reciprocation gap (Chen & Schonger, Reference Chen and Schonger2024, see Section F of the Appendix for a simple illustration in our context).Footnote 26 Our findings further suggest that cognitive depletion may affect the relative strength of these two mechanisms, with the duty mechanism possibly gaining relative weight in contexts with stronger cognitive depletion. While this mechanism is not directly identified in our data, the interpretation is supported by indirect evidence from participants’ self-reported task complexity. This interpretation is broadly in line with the notion that some individuals tend to cooperate or reciprocate instinctively, as a rule of thumb, in contexts where such behavior entails a monetary loss, for example because they apply a strategy from daily life, where sanctioning mechanisms are in place or interactions are repeated (Rand et al., Reference Rand, Greene and Nowak2012, Reference Rand, Peysakhovich, Kraft-Todd, Newman, Wurzbacher, Nowak and Greene2014; Reuben & Suetens, Reference Reuben and Suetens2018).
Our findings are related to de Melo et al. (Reference de Melo, Marsella and Gratch2019) who asked participants in a prisoner’s dilemma experiment to program an automaton (defect or cooperate) that would act on their behalf against another participant. Programming the strategy generated a higher cooperation rate than direct play with other participants. This negative hot–cold gap might have been driven by the complexity of the task in the cold treatment, where participants most likely took several elements into account when programming their strategy and formed beliefs about their partner’s cooperation. This might have depleted cognitive resources among some, spurring them to act out of duty. Our findings also suggest that when trust decisions are simple and observable, as in small-scale labor relations and trade, removing or automating human contact may weaken reciprocity, which in turn harms mutual trust. In complex environments like financial or insurance contracting, digital platforms with dense information, ex ante decision rules may better sustain reciprocity.
As we have discussed in the introduction, our findings help to understand the mixed evidence in the literature on direct versus contingent decision-making in trust and related games. Interestingly, evidence is also mixed in the literature on negative reciprocation, where the second mover responds to a possibly unfair choice by the first mover (see Brandts & Charness, Reference Brandts and Charness2011, for an overview). A number of studies find that second movers in a hot decision mode punish unfair choices more severely than in a cold decision mode, or are more likely to reject them in an ultimatum game (Aina et al., Reference Aina, Battigalli and Gamba2020; Brandts & Charness, Reference Brandts and Charness2003; Brosig et al., Reference Brosig, Weimann and Yang2003; Falk et al., Reference Falk, Fehr and Fischbacher2005; Oxoby & McLeish, Reference Oxoby and McLeish2004). In contrast, a meta-analysis shows that ultimatum games with hot responses have a lower rejection rate (Oosterbeek et al., Reference Oosterbeek, Sloof and Van de Kuilen2004). The mixed evidence can be understood by viewing emotional responses and duty to reciprocate as mechanisms leading to opposite effects. A hot response in this context may be motivated by anger or frustration and is therefore associated with a stronger reaction to unfairness than a cold response (Aina et al., Reference Aina, Battigalli and Gamba2020), whereas feelings of duty to reciprocate may induce individuals to respond more strongly to unfair choices under cold decision-making. Future research might be devoted to testing this conjecture directly.
Supplementary material
The supplementary material for this article can be found at https://doi.org/10.1017/eec.2026.10059
Acknowledgements
We acknowledge financial support from CentERlab at Tilburg University. We thank seminar audiences at Tilburg University, Purdue University, CREED in the University of Amsterdam and IMT Lucca and participants of the CIMEO Workshop at Sapienza University of Rome, ESA 2021 Global Around-the-Clock Virtual Conference, ESA 2022 European Meeting in Bologna and ESA 2023 World Meeting in Lyon for insightful discussions and comments. Preregistrations are available at https://osf.io/kctfm (Baseline experiment), https://osf.io/tx6yg (No Intentions experiment), and https://osf.io/2856n (Beliefs experiment). The study was approved by the Institutional Review Board of the Tilburg School of Economics and Management (EXE 2020-014).
Replication package
The replication material for this study is available at https://doi.org/10.34894/5FMX0C.



 Open access

