1. Introduction
The Pareto distribution, which was discovered by Vilfredo Pareto (1848–1923), while he was studying distributions for modelling income in Switzerland, has been widely used for modelling heavy-tailed phenomena which appear frequently in a plethora of different scientific fields such as sociology, economics, physics and seismology among others. In actuarial science, where quantifying the risk posed by the more risky types of insurance has often been an imperative task for actuaries, the Pareto distribution and its generalisation, namely the Generalised Pareto (GP) distribution, which has been used in the context of Extreme Value Theory, see, for example, Embrechts, Klüppelberg & Mikosch (Reference Barlow and Proschan1997), are the most popular heavy-tailed models which have been employed by actuaries for effectively modelling extreme losses, which may have low frequencies but usually represent the biggest part of the indemnities paid by insurance companies. For instance, the economic losses from natural catastrophes in 2017 hit the second-highest level ever recorded, see Munich Re (Reference Barlow and Proschan2017). However, the Pareto distribution, similar to any other claim size distribution, has both merits and demerits. In what follows we provide a thorough discussion about the advantages and limitations of a special case of the GP distribution, the two parameter Pareto, or Exponential-Inverse Gamma, density with a regression structure, henceforth called the Pareto regression model, when it is used for premium determination in Motor Third Party Liability (MTPL) insurance which is the main focus of the present study.
As far as MTPL insurance is concerned, traditionally, a dual approach to ratemaking has been adopted by actuaries who developed both a priori ratemaking schemes and a posteriori ratemaking mechanisms or Bonus–Malus Systems (BMSs). The former process relies on the use of claim frequency and severity generalised linear models (GLMs) for computing the a priori premiums. References for a priori ratemaking include, for example, Haberman & Renshaw (Reference Haberman and Renshaw1996), Denuit & Lang (Reference Klein, Denuit, Lang and Kneib2004), Boucher, Denuit & Guillen (Reference Boucher, Denuit and Guillen2007), De Jong & Heller (Reference De Jong and Heller2008), Kaas et al. (Reference Kaas, Goovaerts, Dhaene and Denuit2008), Frees (Reference Frees2010) and Tzougas, Vrontos & Frangos (Reference Tzougas, Vrontos and Frangos2015). The latter process uses information about the claim frequency and severity history of the policyholders to calculate a posteriori, or Bonus–Malus (BM), premium rates in a way which takes into account the a posterior criteria, i.e. all the factors that could not be identified, measured and introduced in the previous a priori tariff. An excellent account of BMSs can be found in Lemaire (Reference Lemaire1995). Further references for BMSs include, among many others, Trembley (Reference Trembley1992), Picech (Reference Picech1994), Pinquet (Reference Pinquet1997, Reference Pinquet1998), Brouhns et al. (Reference Brouhns, Guillen, Denuit and Pinquet2003), Mert & Saykan (Reference Mert and Saykan2005), Gómez-Déniz & Calderín-Ojeda (Reference Gómez-Déniz and Calderín-Ojeda2018), Gómez-Déniz, Hernández-Bastida & Fernández-Sánchez (Reference Gómez-Déniz, Hernández-Bastida and Fernández-Sánchez2014), Ni, Constantinescu & Pantelous (Reference Ni, Constantinescu and Pantelous2014), Ni et al. (Reference Ni, Li, Constantinescu and Pantelous2014), Santi, Purnaba & Mangku (Reference Santi, Purnaba and Mangku2016), Karlis, Tzougas & Frangos (Reference Tzougas and Frangos2018) and Gómez-Déniz & Calderín-Ojeda (Reference Gómez-Déniz and Calderín-Ojeda2018). Furthermore, a basic interest of actuarial literature research is the design of BMSs for the number and costs of claims based on both the a priori and a posterior criteria, making the price discrimination even more fair and reasonable. Nevertheless, since the seminal work of Dionne & Vanasse (Reference Dionne and Vanasse1989, Reference Dionne and Vanasse1992), who employed the Negative Binomial Type I (NBI), or Poisson-Gamma, regression model for constructing a BMSs by updating the posterior mean claim frequency based on explanatory variables for claim counts, the steady march of methodological innovation has mainly focused on deriving BMSs with a frequency component based on alternative count regression models to the NBI, such as the Poisson-Inverse Gaussian (PIG) regression model, which has also been a traditional choice, see Denuit et al. (Reference Boucher, Denuit and Guillen2007), Boucher, Denuit & Guillen (Reference Boucher, Denuit and Guillen2008), Tzougas & Frangos (Reference Tzougas and Frangos2014) and Tzougas, Hoon & Lim (Reference Tzougas, Hoon and Lim2018) among many others, while, unlike the case without covariates, the severity component has been largely ignored even if it is critical in the ratemaking process. Specifically, to the best of our knowledge, only the Pareto regression modelFootnote 1 has been used so far for deriving BMS by updating the posterior mean claim severity based on covariate information for claim sizes, see, for instance, Frangos & Vrontos (Reference Frangos and Vrontos2001), Mahmoudvand & Hassani (Reference Mahmoudvand and Hassani2009) and Tzougas, Vrontos & Frangos (Reference Tzougas and Frangos2014, Reference Tzougas, Vrontos and Frangos2018). The main advantage of the Pareto model lies in the conjugacy, in a Bayesian sense, between the Inverse Gamma prior, or mixing, distribution and the Exponential distribution, which facilitates maximum likelihood (ML) estimation and a Bayesian approach towards calculating a posteriori, or BM, premiums. However, regardless of the statistical and mathematical convenience of conjugancy, there is no guarantee that variation in claim sizes has precisely the distributional forms implied by the Pareto model. In particular, a serious drawback of the Pareto model is that it is among the most heavy-tailed claim severity models and hence not flexible enough to adequately cover the behaviour of claims with moderate sizes. Thus, if very few observations are available in the tail area, meaning that claims with large amounts are so rare that their numerical impact is low, then an inappropriate imposition of the Pareto model may lead to biased estimates for moderate claim costs. Moreover, even if large claims have a significant contribution to the overall portfolio risk, as empirical evidence has shown, claims with moderate severities usually constitute the largest proportion of MTPL data and hence may also lead to substantial losses. More importantly, unless the assumption that the actual claim size distribution is a Pareto is valid, then due to its very heavy-tailed character, the Pareto model can be ill-suited for pricing risks since it will result in a severe penalisation of policyholders with moderate claim costs. Nevertheless, unlike large claims that will always be reported to the company, only moderate claims are subject to the Bonus–Hunger phenomenon. Consequently, this situation can lead to huge financial impacts for the insurance company since in those BMSs resulting from the Pareto model for claim severities it is very likely that moderate claim costs will be defrayed by the policyholders themselves and hence the insurer will have a false appreciation of the real risks they are taking. Furthermore, taking into consideration that according to the latest report of Insurance Europe, in 2014 MTPL remained the most widely purchased non-life product in the European Union, accounting for 27.3% of non-life business, see Insurance Europe (2016), it becomes clear that the Bonus–Hunger phenomenon requires an accurate modelling for moderate claim amounts based on representative distributions for the claim sizes data that have the potential to capture more efficiently their stylised characteristics and thus determine the appropriate level of premiums.
The aim of the present work is to propose the Exponential-Lognormal (ELN) regression model as a competitive alternative to the Pareto regression model. The ELN model can be considered as a prominent candidate for MTLP claim severity data due to the following academic and practical reasons. Firstly, it is desirable to construct some distributions similar in nature to the Pareto distribution which can adequately capture the tail of claim size data, since large size claims generally affect liability coverages. The ELN distribution has the heavy-tailed property since, as is well known, mixing tends to produce heavy-tailed distributions, see, for example, Halliwell (Reference Halliwell2013). For instance, similar to the Pareto distribution, the ELN distribution can more adequately model the tail of the claim size data when compared to the Gamma distribution which has been very often used in the literature for modelling moderate claims, see Klugman, Panjer & Willmot (Reference Klugman, Panjer and Willmot2012) and Denuit et al. (Reference Boucher, Denuit and Guillen2007). Secondly, the advantage that the ELN distribution enjoys over the more heavy-tailed Pareto distribution is that it has a more promising shape for moderate claims. This effect is most notable when the a posteriori correction for claim amounts is calculated since the ELN model can enable the actuary to calculate a fair increment in the a posteriori, or BM, premiums that must be paid to cover all the expenses caused by a large number of medium size claims hitting the portfolio, alleviating thus the Bonus–Hunger phenomenon. We will investigate the right tail behaviour of the ELN distribution and compare it to that of the Gamma and Pareto distributions based on the set up of Wang (Reference Hesselager, Wang and Willmot1998), who proposed the use of the right tail index for classifying claim severity distributions by their right tail behaviour without referring to higher moments.
At this point, we would also like to call attention to the fact that unlike the vast pricing literature on mixed Poisson models for claims counts, the study of mixed Exponential models stemming from continuous mixing distributions, which can be used for describing claim size heterogeneity and for deriving ratemaking mechanisms for claim costs, still remains a largely uncharted territory. In particular, regarding the case without covariates, except for the Pareto distribution the only other mixed Exponential distribution that has been used in an a posteriori ratemaking context so far is the Weibull, or Exponential-Lévy (Stable 1/2) distribution, which was studied in depth by Ni, Constantinescu & Pantelous (Reference Ni, Constantinescu and Pantelous2014) who gave an excellent account of its statistical properties, putting special emphasis on its ability to fit moderate size claims well, and demonstrated how BM premiums can be derived based on the Bayesian approach. Furthermore, Ni et al. (Reference Ni, Li, Constantinescu and Pantelous2014) calculated the a posteriori correction for claim sizes by using a hybrid structure which was based on the Weibull distribution for modelling medium sized claims and the Pareto distribution for modelling larger ones. Additionally, the Exponential-Inverse Gaussian (EIG) distribution, which is also less heavy-tailed than the Pareto model and can apt for moderate claim costs, was presented by Bhattacharya & Kumar (Reference Bhattacharya and Kumar1986), who used it for reliability purposes, while Hesselager, Wang & Willmot (Reference Hesselager, Wang and Willmot1998) proposed a different parameterisation of the distribution and Frangos & Karlis (Reference Frangos and Karlis2004) considered the case with covariates by allowing a regression specification in the function for the mean parameter of the EIG distribution. However, this is the first time that the ELN model is used in a statistical or actuarial setting for the cases with and without covariate information because, due to the complexity of its log-likelihood, direct maximisation is difficult and has not been addressed in the literature so far. In particular there is no analytical form for the distribution of the cost of claims if the random effect variable, which follows the Lognormal distribution, is marginalised out. As a result, ML estimation of the ELN regression model is not straightforward to calculate and requires a special effort.
The main achievement of this study is that we propose a relatively simple Expectation-Maximisation (EM) type algorithm for ML estimation of the ELN regression model. The ML estimation framework we consider is based on the inherent latent structure of mixed Exponential models and is particularly useful for situations where the mixing distribution, such as the Lognormal, is not conjugate to the Exponential distribution. Furthermore, using the Negative Binomial Type I (NBI) and the PIG regression models for claim counts, both the a priori and a posteriori, or BM, premium rates resulting from the new model are calculated via the law of total expectation and the use of numerical approximation, and are compared to those determined by the Pareto model that has been widely used for modelling claim severity.
The rest of this paper proceeds as follows: Section 2 presents the derivation of the ELN regression model. Section 3 fully describes the ML estimation through the EM algorithm. Section 4 contains an application to a data set concerning car insurance claims at fault. Finally, concluding remarks can be found in section 5.
2. The ELN Regression Model
The ELN regression model which is considered in this study can be described as follows. Assume that the individual claim costs, y i , arising from a policyholder i, i = 1, ..., n are independent and identically distributed random variables according to an Exponential distribution with probability density function (pdf) given by
 $$f\left( {y_i |{\bf{x}}_i ,z_i } \right) = {{e^{ - {{y_i } \over {\mu _i z_i }}} } \over {\mu _i z_i }}$$
where y
i
> 0 and z
i
> 0, with
 ${\mu _i} = \exp \left( {{\bf{x}}_i^T\beta } \right),$
where x
i
is the vector of covariate information regarding individual characteristics and characteristics of the vehicle related to the i
th insured person and where β is the vector of the regression coefficients.
The mean and the variance of y i |x i , z i are given by
 $$E(y_i |{\bf{x}}_i ,z) = \exp ({\bf{x}}_i^T \beta + \log \left( {z_i } \right)){\rm{ and}}$$
 $$Var(y_i |{\bf{x}}_i ,z) = [\exp ({\bf{x}}_i^T \beta + \log \left( {z_i } \right))]^2 $$
Let us now assume that z i follows a Lognormal distribution with pdf given by
 $$g\left( {z_i } \right) = {1 \over {\sqrt {2\pi } \phi z_i }}\exp \left[ { - {{\left( {\log \left( {z_i } \right) + {{\phi ^2 } \over 2}} \right)^2 } \over {2\phi ^2 }}} \right]$$
with ϕ > 0, where E(z i ) = 1 ensures the identifiability of the model and where Var(z i ) = exp (ϕ Footnote 2 ) − 1, for i = 1, ...., n.
Considering the assumptions of the model, i.e. equations (1 and 4), it is easy to see that the resulting distribution of y i |x i is the ELN distribution with pdf
 $$f(y_i |{\bf{x}}_i ) = _0^\infty {{e^{ - {{y_i } \over {\mu _i z_i }}} } \over {\mu _i z_i }}{{\exp \left[ { - {{(\log \left( {z_i } \right) + {{\phi ^2 } \over 2})^2 } \over {2\phi ^2 }}} \right]} \over {\sqrt {2\pi } \phi z_i }}dz_i $$
Unfortunately, the above integral cannot be simplified but it can be computed via numerical integration.
Finally, based on the laws of total expectation and total variance and the moments of the Exponential distribution, one can easily see that the mean and the variance of y i |x i are given by
 $$E(y_i |{\bf{x}}_i ) = E_{z_i } \left[ {E(y_i |z_i )} \right] = \exp ({\bf{x}}_i^T \beta )E_{z_i } \left[ {z_i } \right] = \mu _i $$
and
 $$\matrix{\matrix{Var(y_i |{\bf{x}}_i ) = E_{z_i } \left[ {Var(y_i |z_i )} \right] + Var_{z_i } \left[ {E(y_i |z_i )} \right] \hfill \cr = \mu _i^2 \left[ {2\exp (\phi ^2 ) - 1} \right] \hfill \cr} \cr {} \cr } $$
3. The EM Algorithm for ML Estimation of the ELN Regression Model
In this section we describe how an EM type algorithm can be used to facilitate the ML estimation of the ELN regression model. Let (y i , x i ), i = 1, ..., n, be a sample of independent observations, where y i is the claim severity and where x i is the vector of covariate information. Also, consider that the data are produced according to the ELN model. Then, the log-likelihood can be written as
 $$l\left( \theta \right) = \sum\limits_{i = 1}^n \log \left( {\,f(y_i |{\bf{x}}_i )} \right)$$
where θ = (ϕ, β ) is the vector of the parameters and where f (y i |x i ) is the pdf of the ELN model, which is given by equation (5). Maximisation of the above function with respect to the vector of parameters θ is not easy because the pdf of the model does not exist in closed form and hence θ cannot be estimated via traditional numerical maximisation methods, such as, for instance, the Newton–Raphson algorithm. Fortunately, ML estimation of the model can be achieved in easy manner via an EM type algorithm. The EM algorithm (see Dempster, Laird & Rubin Reference Dempster, Laird and Rubin1997 and McLachlan & Krishnan Reference McLachlan and Krishnan2007) is suitable for mixed Exponential models, since their stochastic mixture representation involving a non-observable random variable, denoted by z i herein, can be considered to produce missing data. In particular, if one augments the unobserved data z i to the observed data (y i , x i ), for i = 1, ..., n, then the complete data log-likelihood factorises into two parts
 $$\matrix{{l_c \left( \theta \right) = \sum\limits_{i = 1}^n \left[ { - {{y_i } \over {\mu _i z_i }} - \log (\mu _i ) - \log \left( {z_i } \right)} \right] + } \cr {\sum\limits_{i = 1}^n \left[ { - {1 \over 2}\log \left( {2\pi } \right) - \log \left( \phi \right) - \log \left( {z_i } \right) - {{\left( {\log \left( {z_i } \right) + {{\phi ^2 } \over 2}} \right)^2 } \over {2\phi ^2 }}} \right]} \cr } $$
for i = 1, ...n. The regression coefficients β are involved in the first term and the parameter ϕ is involved in the second term of equation (9) which correspond to the log-likelihoods of the Exponential and Lognormal distributions respectively.
The conditional expectation of the complete data log-likelihood is proportional to
 $$\matrix{{Q(\theta ;{\kern 1pt} \theta ^{(r)} ) \equiv E_{z_i } (l_c \left( \theta \right)|y_i ,{\bf{x}}_i ,\theta ^{(r)} ) \propto } \cr { \propto \sum\limits_{i = 1}^n \left[ { - {{y_i E_{z_i } \left[ {{1 \over {z_i }}|y_i ,{\bf{x}}_i ,\theta ^{(r)} } \right]} \over {\mu _i^{(r)} }} - \log (\mu _i^{(r)} )} \right] + } \cr {\sum\limits_{i = 1}^n \left[ { - {{E_{z_i } \left[ {\left( {\log \left( {z_i } \right)} \right)^2 |y_i ,{\bf{x}}_i ,\theta ^{(r)} } \right]} \over {2(\phi ^{(r)} )^2 }} - {{(\phi ^{(r)} )^2 } \over 8} - \log (\phi ^{(r)} )} \right]} \cr } $$
where
θ
(r) is the estimate of
θ
at the r
th iteration in the E-step of our EM type algorithm. In what follows, the expectations
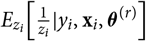 ${E_{{z_i}}}[{1 \over {{z_i}}}|{y_i},{{\bf{x}}_i},{\theta ^{(r)}}]$
and E
z
i
[ (log (z
i
))2 | y
i
, x
i
θ
(r)] have to be calculated for implementing the E-step of the algorithm, while the M-step involves maximising the Q−function with respect to
θ
. The EM type algorithm for the ELN regression model can be formally described as follows.
• E-Step: Given the current estimates, say θ (r), taken from the r th iteration, calculate for all i = 1, ..., n, the pseudo-values
(11) $$\matrix{w_{1,i} = E_{z_i } \left[ {\frac{1}{{z_i }}|y_i ,{\bf{x}}_i ,\theta ^{(r)} } \right]} \\ { = \frac{{_0^\infty \frac{1}{{z_i }}\frac{{e^{ - \frac{{y_i }}{{\mu _i^{(r)} z_i }}} }}{{\mu _i^{(r)} z_i }}\frac{{\exp \left[ { - \frac{{\left( {\log \left( {z_i } \right) + \frac{{(\phi ^{(r)} )^2 }}{2}} \right)^2 }}{{2(\phi ^{(r)} )^2 }}} \right]}}{{\sqrt {2\pi } \phi ^{(r)} z_i }}dz_i }}{{_0^\infty \frac{{e^{ - \frac{{y_i }}{{\mu _i^{(r)} z_i }}} }}{{\mu _i^{(r)} z_i }}\frac{{\exp \left[ { - \frac{{\left( {\log \left( {z_i } \right) + \frac{{(\phi ^{(r)} )^2 }}{2}} \right)^2 }}{{2(\phi ^{(r)} )^2 }}} \right]}}{{\sqrt {2\pi } \phi ^{(r)} z_i }}dz_i }}} \\ \endmatrix $$
and
(12)
$$\matrix{w_{2,i} = E_{z_i } \left[ {\left( {\log \left( {z_i } \right)} \right)^2 |y_i ,{\bf{x}}_i ,\theta ^{(r)} } \right]} \\ { = \frac{{_0^\infty \left( {\log \left( {z_i } \right)} \right)^2 \frac{{e^{ - \frac{{y_i }}{{\mu _i^{(r)} z_i }}} }}{{\mu _i^{(r)} z_i }}\frac{{\exp \left[ { - \frac{{\left( {\log \left( {z_i } \right) + \frac{{(\phi ^{(r)} )^2 }}{2}} \right)^2 }}{{2(\phi ^{(r)} )^2 }}} \right]}}{{\sqrt {2\pi } \phi ^{(r)} z_i }}dz_i }}{{_0^\infty \frac{{e^{ - \frac{{y_i }}{{\mu _i^{(r)} z_i }}} }}{{\mu _i^{(r)} z_i }}\frac{{\exp \left[ { - \frac{{\left( {\log \left( {z_i } \right) + \frac{{(\phi ^{(r)} )^2 }}{2}} \right)^2 }}{{2(\phi ^{(r)} )^2 }}} \right]}}{{\sqrt {2\pi } \phi ^{(r)} z_i }}dz_i }}} \\ \endmatrix $$
Clearly the expectations involved in the E-step of the algorithm do not have closed form expressions and thus numerical approximations are needed. Specifically, equations (11 and 12) can be evaluated numerically. Alternatively, a Monte Carlo approach can also be used based on a rejection algorithm. The latter case leads to variants of the EM algorithm such as the Monte Carlo EM algorithm (see, for instance, Booth & Hobert Reference Booth and Hobert1999 and Booth, Hobert & Jank Reference Booth, Hobert and Jank2001) which do not require knowledge of the pdf f (y i |x i ), but it is sufficient to be able to simulate from the posterior density g (z i |y i , x i θ ), where g (z i ) in our case is the pdf of the Lognormal mixing distribution, which is given by equation (4).
• M-Step: In the M-Step, the pseudo-values w 1,i and w 2,i from the E-Step can be used to maximise the Q−function.
– Firstly, the Newton–Raphson algorithm is employed to obtain ML estimates of the elements of β . Taking the necessary derivatives of the Q−function with respect to β we obtain the following results:
(13)
$$h\left( \beta \right) = \frac{{\partial Q(\theta ;{\kern 1pt} \theta ^{(r)} )}}{{\partial \beta }} = \sum\limits_{i = 1}^n \left( {\frac{{y_i }}{{\mu _i^{(r)} }}w_{1,i} - 1} \right){\bf{x}}_i $$
and
(14)
$$H\left( \beta \right) = \frac{{\partial ^2 Q(\theta ;{\kern 1pt} \theta ^{(r)} )}}{{\partial \beta \partial \beta ^T }} = \sum\limits_{i = 1}^n \left( { - \frac{{y_i }}{{\mu _i^{(r)} }}w_{1,i} } \right){\bf{x}}_i {\bf{x}}_i^T = {\bf{X}}^T {\bf{WX}}$$
for i = 1, ..., n, where
${\bf{W}} = diag\{ - {{{y_i}} \over {\mu _i^{(r)}}}{w_{1,i}}\} $
and where w
1,i
is given by equation (11).The Newton–Raphson iterative procedure for obtaining ML estimates of the elements of β goes as follows:
(15)
$$\beta ^{\left( {r + 1} \right)} \equiv \beta ^{(r)} - \left[ {H(\beta ^{(r)} )} \right]^{ - 1} h(\beta ^{(r)} )$$
– Secondly, update φ with
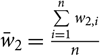
(16)
$$\phi ^{\left( {r + 1} \right)} \equiv \sqrt {2\left( {\sqrt {1 + \bar w_2 } - 1} \right)} $$
where
${\bar w_2} = {{\sum\limits_{i = 1}^n {w_{2,i}}} \over n}$
and where w
2,i
is given by equation (12).• Note also that when the regression component of the model is limited to a constant β 0 one obtains
$E({y_i}|{{\bf{x}}_i}) = \exp ({\bf{x}}_i^T{\beta _0}) = \mu $
, and thus this EM type algorithm can be employed for the ML estimation of the univariate, without a regression component, model.



4. Numerical Illustration
In this paper, we worked with a sample of data that were kindly provided by a major insurance company operating in Greece and concern a MTPL insurance portfolio observed over 3 years. In our sample we considered only policyholders with complete records, i.e. with availability of all a priori rating variables that correspond to their characteristics, including the characteristics of their car. Response variables are the number of claims at fault reported to the company and the loss corresponding to each claim made. The sample comprises 9,986 policies which met our criteria. The available a priori rating variables we employ are the BM class of the policyholders, the horsepower (HP) of their car and the size of the city (CS) where they live.
• This BMS has 20 classes and the transition rules are described as follows: Each claim free year is rewarded by one class discount and each accident in a given year is penalised by one class. The variable BM class divides the classes of the current Greek BMS into four categories of drivers, those who belong to BM classes: C1= “Class 1–Class 2”, C2 = “Class 3–Class 5”, C3 = “Class 6–Class 9” and C4 = “Class 10–Class 20”.
• The variable HP consists of three categories of cars, those with a HP: C1 = “0–1,400 cc”, C2 = “1,400–1,800 cc” and C3 = “greater than 1,800 cc”.
• The variable CS consists of three categories of policyholders, those who live in a: C1 = “large city”, C2 = “middle sized city” and C3 = “small city”.
Furthermore, since in this study we focus on the claim severity component, in Table 1 we present some standard descriptive statistics for claim severities along with the number of observations in each category of the three explanatory variables.
Descriptive statistics of claim severities – size of the different categories of the explanatory variables

Additionally, Figure 1 displays the corresponding to the explanatory variables descriptive histograms, giving us an indication of the range of their values.
Descriptive histograms for the explanatory variables.

Finally, Table 2 presents a summary of the effects of the covariates on claim severities for 36 different risk classes, which can be formed by dividing the portfolio into clusters defined by the combinations of the characteristics of the policyholders and their cars based on all 9,986 observations. In particular, Table 2 depicts the percentage of observations with claim sizes less than 2,500 euros, higher than or equal to 2,500 euros and less than 3,500 euros, higher than or equal to 3,500 euros and less than 4,500 euros, and higher than or equal to 4,500 euros for each of the 36 groups of policyholders.
Summary statistics of the claim severities of the different risk classes determined by the combination of the explanatory variables

In the following subsections, we fit the Negative Binomial Type I (NBI) and PIG distributions on the number of claims, and the ELN and Pareto distributions on claim sizes. Moreover, we will compare the two aforementioned claim severity distributions with the Generalised Beta of the second kind (GB2) distribution, which has been used in an abundance of actuarial settings for accommodating the long-tailed nature of claim sizes. Furthermore, regression components are introduced in their mean parameters, and all the risk classifying characteristics presented above are included so as to use all the available information in the estimation of the claim frequency and severity distributions. Additionally, the a priori and a posteriori, or BM, premium rates resulting from the combinations of the NBI and PIG claim frequency distributions/regression models with the Pareto and ELN distributions/regression models will be calculated via the net premium principle with independence between the claim frequency and severity components assumedFootnote 2 .
• Because we will be comparing the ELN distribution/regression model with the Pareto and GB2 distributions/regression models, we give below some rudimentary facts concerning the latter two.
– The Pareto model, taken for instance from Frangos & Vrontos (Reference Frangos and Vrontos2001) and Mahmoudvand & Hassani (Reference Mahmoudvand and Hassani2009), can be constructed as follows. Following a similar approach, as in the case of the ELN model, consider that y i |x i , z i , for i = 1, ..., n, is distributed according to the Exponential distribution with mean μ i z i , where y i > 0, where
${\mu _i} = \exp ({\bf{x}}_i^T\beta )$
, where x
i
is the vector of covariate information regarding individual characteristics and characteristics of the car related to the i
th insured person and β is the vector of the regression coeffi-cients, and where z
i
> 0 is a continuous random variable which follows an Inverse Gamma distribution with pdf(17)
$$g\left( {z_i } \right) = \frac{{\frac{1}{{\left( {\phi - 1} \right)}}\exp \left( { - \frac{{\left( {\phi - 1} \right)}}{{z_i }}} \right)}}{{\left( {\frac{{z_i }}{{\phi - 1}}} \right)^{\phi + 1} \Gamma \left( \phi \right)}}$$
with ϕ > 2 and mean E(z i ) = 1. Then, the resulting distribution of y i |x i is a Pareto distribution with pdf given by
(18)
$$f(y_i |{\bf{x}}_i ) = \phi \frac{{\left[ {\left( {\phi - 1} \right)\mu _i } \right]^\phi }}{{\left[ {y_i + \left( {\phi - 1} \right)\mu _i } \right]^{\phi + 1} }}$$
The mean and the variance of the Pareto distribution are given by
(19)
$$E(y_i |{\bf{x}}_i ) = \mu _i {\text{and}}Var(y_i |{\bf{x}}_i ) = \frac{{\left[ {\left( {\phi - 1} \right)\mu _i } \right]^2 }}{{\phi - 1}}\left( {\frac{2}{{\phi - 2}} - \frac{1}{{\phi - 1}}} \right)$$
– Regarding the GB2 distribution, it should be noted that many heavy-tailed distributions can be written as special or limiting cases of the GB2, see, for instance, McDonald & Xu (Reference McDonald and Xu1995). However, despite the prominence of the GB2 distribution in fitting heavy-tailed data, relatively few applications use the GB2 in a regression context. Further details of the GB2 regression model can be found, for instance, in Frees & Valdez (Reference Frees and Valdez2008), Frees, Derrig & Meyers (Reference Frees, Derrig and Meyers2014a) and Calderín-Ojeda, Fergusson & Wu (Reference Calderín-Ojeda, Fergusson and Wu2017). Herein we use a simple specification of the GB2, see Rigby & Stasinopoulos (Reference Rigby and Stasinopoulos2009), which has as a special case the Pareto model given by equation (18) and allows us to parameterise the location parameter, μ i , in terms of covariates, i.e.
${\mu _i} = \exp ({\bf{x}}_i^T\beta ),$
, for i = 1, .., n. The pdf of the GB2 distribution is defined by(20)
$$\matrix{f(y_i |{\bf{x}}_i ) = \left| \phi \right|y_i^{\phi \nu - 1} \left\{ {\mu _i^{\phi \nu } B\left( {\nu ,\tau } \right)\left[ {1 + \left( {\frac{{y_i }}{{\mu _i }}} \right)^\phi } \right]^{\nu + \tau } } \right\}^{ - 1} } \\ { = \frac{{\Gamma \left( {\nu + \tau } \right)}}{{\Gamma \left( \nu \right)\Gamma \left( \tau \right)}}\frac{{\phi \left( {\frac{{y_i }}{{\mu _i }}} \right)^{\phi \nu } }}{{y_i \left[ {1 + \left( {\frac{{y_i }}{{\mu _i }}} \right)^\phi } \right]^{\nu + \tau } }}} \\ \endmatrix $$
for y i > 0, where −∞ < ϕ < ∞, ν > 0 and τ > 0, see also McDonald & Xu (Reference McDonald and Xu1995), equation (2.7), and where
- (21)
$$B\left( {\nu ,\tau } \right) = \int\limits_0^1 x^{\nu - 1} \left( {1 - x} \right)^{\tau - 1} dx = \frac{{\Gamma \left( \nu \right)\Gamma \left( \tau \right)}}{{\Gamma \left( {\nu + \tau } \right)}}$$
is the Beta function.
The first and the second moment of the GB2 distribution are given by
(22)
$$E(y_i |{\bf{x}}_i ) = \frac{{\mu _i B\left( {\nu + \frac{1}{\phi },\tau - \frac{1}{\phi }} \right)}}{{B\left( {\nu ,\tau } \right)}},{\text{for}} - \nu < \frac{1}{\phi } < \tau $$
and
(23)
$$E(y_i^2 |{\bf{x}}_i ) = \frac{{\mu _i^2 B\left( {\nu + \frac{2}{\phi },\tau - \frac{2}{\phi }} \right)}}{{B\left( {\nu ,\tau } \right)}},{\text{for}} - \nu < \frac{2}{\phi } < \tau $$
see McDonald (Reference McDonald, Maddala and Rao1996). Hence, the variance of the GB2 distribution can be easily calculated using equations (22 and 23).
• Furthermore, the NBI and PIG claim frequency models can be derived as follows. Consider a policyholder i whose number of claims, denoted as k i , with k i = 0, 1, 2, 3, ..., are independent and suppose that χ i is the vector of individual characteristics and characteristics of the car related to the i th insured person, i = 1, ..., n, which represent different a priori rating variables. We assume that given a continuous random variable u i > 0 with pdf υ (u i ) defined on R +, k i | χ i, u i follows the Poisson distribution with mean λ i u i , where
${\lambda _i} = \exp \left( {\chi _i^T{\bf{b}}} \right)$
and where b is the vector of the regression coefficients. Then, the unconditional distribution of k
i
is a mixed Poisson distribution. The following are the well-known results applied to the above situation, see, for example, Dionne & Vanasse (Reference Dionne and Vanasse1989, Reference Dionne and Vanasse1992), Boucher, Denuit & Guillen (Reference Boucher, Denuit and Guillen2007, Reference Boucher, Denuit and Guillen2008) and Tzougas, Vrontos & Frangos (Reference Karlis, Tzougas and Frangos2018). We consider that E(u
i
) = 1 as this ensures the identifiability of the model.– Let u i follow a Gamma distribution with pdf given by
(24)
$$\upsilon \left( {u_i } \right) = \frac{{u_i^{\frac{1}{\sigma } - 1} \frac{1}{\sigma }^{\frac{1}{\sigma }} \exp \left( { - \frac{{u_i }}{\sigma }} \right)}}{{\Gamma \left( {\frac{1}{\sigma }} \right)}}$$
where σ > 0. Parameterisation (24) ensures that E(u i ) = 1.
Under this assumption the distribution of k i | χ i becomes a NBI distribution, with probability mass function (pmf) given by
(25)
$$P(k_i |\chi _i ) = \frac{{\Gamma \left( {k_i + \frac{1}{\sigma }} \right)}}{{k_i !\Gamma \left( {\frac{1}{\sigma }} \right)}}\left( {\frac{{\sigma \lambda _i }}{{1 + \sigma \lambda _i }}} \right)^{k_i } \left( {\frac{1}{{1 + \sigma \lambda _i }}} \right)^{\frac{1}{\sigma }} $$
The mean and the variance of the NBI distribution are given by
(26)
$$E(k_i |\chi _i ) = \lambda _i {\text{and}}Var(k_i |\chi _i ) = \lambda _i + \lambda _i^2 \sigma $$
– Let u i follow an Inverse Gaussian distribution with pdf given by
(27)
$$\upsilon \left( {u_i } \right) = \frac{1}{{\sqrt {2\pi \sigma u_i^3 } }}\exp \left[ { - \frac{1}{{2\sigma u_i }}\left( {u_i - 1} \right)^2 } \right]$$
where σ > 0. Parameterisation (27) also ensures that E(u i ) = 1. Then, the distribution of k i | χ i becomes a PIG distribution, with pmf given by
(28)
$$P(k_i |\chi _i ) = \left( {\frac{{2a}}{\pi }} \right)^{^{\frac{1}{2}} } \frac{{\lambda _i^{k_i } e^{\frac{1}{\sigma }} K_{k_i - \frac{1}{2}} \left( a \right)}}{{\left( {a\sigma } \right)^{k_i } k_i !}}$$
where
${a^2} = {\sigma ^{ - 2}} + {{2{\lambda _i}} \over \sigma }$
and where(29)
$$K_\nu \left( \omega \right) = _0^\infty x^{\nu - 1} \exp \left[ { - \frac{1}{2}\omega \left( {x + \frac{1}{x}} \right)} \right]dx$$
is the modified Bessel function of the third kind of order ν with argument ω. The mean and the variance of the PIG distribution are given by
(30)
$$E(k_i |\chi _i ) = \lambda _i {\text{and}}Var(k_i |\chi _i ) = \lambda _i + \lambda _i^2 \sigma $$
• Finally, note that when the regression component in each of the aforementioned claim severity and frequency regression models is limited to a constant, one obtains the univariate, without a regression component, models.


4.1 Modelling results
This subsection presents the modelling results of the ELN distribution/regression model and the traditional NBI, PIG, GB2 and Pareto distributions/regression models. The EM algorithm described in section 3 was used to estimate both the ELN distribution and regression models. The model, for both the cases with and without covariate information, converged after a few iterations using a rather strict stopping criterion. In particular, we iterated between the E-step and the M-step until the relative change in log-likelihood, which is given by equation (8), between two successive iterations was smaller than 10−12. We also emphasise that for this model the choice of initial values for both the vector of the regression coefficients β and the parameter ϕ of the Lognormal mixing distribution needed special attention because one may obtain inadmissible values if the starting values are bad. Good starting values for β were obtained by fitting the exponential regression model. Also, a good initial value for ϕ was feasible by calculating Var(y
i
|x
i
) based on all observations, i = 1, ..., n, in our data set and solving equation (7) with respect to ϕ > 0. Additionally, to ensure that the global maximum had been obtained and the algorithm had not been trapped in a local maximum, we checked with many initial values for ϕ, but for all cases we converged on the same solution. Furthermore, standard errors were obtained using the standard approach of Louis (Reference Louis1982). All computing was done using the statistical computing environment language R. Additionally, ML estimation of the NBI, PIG, GB2 and Pareto distributions/regression models, for which the definition of a log-likelihood function in closed form is feasible, was straightforward by using standard statistical packages in R, such as the GAMLSS package. For more details on the GAMLSS package, see Stasinopoulos, Rigby & Akantziliotou (Reference Stasinopoulos, Rigby and Akantziliotou2008). Finally, the computational time requirements of the ELN distribution/regression model were compared to those of the over-simplistic Exponential distribution/regression model. As anticipated, the Exponential distribution/regression model compared favourably to the ELN distribution/regression model in terms of computing times required for ML estimation since both the cases took fewer than 10 seconds of CPU time. Nevertheless, taking into account that there were 9,986 policies in the sample of MTPL data that was examined in this study, that we used a rather strict stopping criterion for EM iterations and that the expectations involved at the E-step of the algorithm do not have closed form expressions, the CPU times of the EM algorithm used for ML estimation of both the ELN distribution and the ELN regression models can be characterised as modest. In particular, the ML estimation of the ELN regression model was more chronologically demanding than that of the ELN distribution because the numerical evaluation of the integrals at the E-step for the case with covariates is more computationally time consuming than for the case without covariates. However, both cases took less than 2 minutes of CPU time. Finally, it should be mentioned that the trade-off between CPU time requirements and the efficiency of the ELN regression model for approximating claim costs in our sample and for deriving ratemaking mechanisms is sifted in favour of the latter two. In particular, regardless of the very low CPU time required for ML estimation of the Exponential model, the assumption of an Exponential response distribution is inadequate both for modelling the tail of the claim severity and for ratemaking purposes since firstly this model cannot effectively capture the tail of the claim size distribution and secondly all the possible important factors, such as reaction times and aggressive driving behaviour, etc., whichto a great extent reveal the riskiness of the insureds, but are either unmeasurable or unobservable, cannot be integrated into the model as it can only take into account covariate information of the policyholder and/or their car. As a result, heterogeneity may still be observed in tariff cells despite the use of many classification variables. On the contrary, as far as the ELN regression model is concerned, firstly, as illustrated later in this subsection, it has an upper tail which can sufficiently fit large claims in our sample and secondly, as was previously shown, it allows us to correct for this unobserved heterogeneity since it was constructed by assuming that y
i
|x
i
, z
i
, for i = 1, ..., n, is distributed according to the Exponential distribution with mean μ
i
z
i
, where y
i
> 0, where
 ${\mu _i} = \exp \left( {{\bf{x}}_i^T\beta } \right)$
, and where the risk parameter z
i
> 0, which represents the risk proneness of policyholder i, i.e. unknown risk characteristics of the policyholder having a significant impact on the occurrence of claims, was regarded as a random variable that is distributed according to the Lognormal distribution, see equations (1 and 4).
The ML estimates of the parameters and the corresponding standard errors in parentheses for the NBI, PIG, GB2, Pareto and ELN distributions are presented in Panel A of Table 3, while Panel B of Table 3 reports our findings with respect to the NBI, PIG, GB2, Pareto and ELN regression models.
Results of the fitted NBI, PIG, GB2, Pareto and ELN models

Furthermore, we rely on normalised quantile residualsFootnote
3
, see Dunn & Smyth (Reference Dunn and Smyth1996), as an exploratory graphical device for investigating the adequacy of the fit of the competing NBI and PIG models for claim frequencies and GB2, Pareto and ELN models for the claim severities. Also, for comparison purposes, we fitted the simple Exponential regression model, which obviously has a thinner tail than the GB2, Pareto and ELN models, and included the corresponding plot. For continuous response distributions, the normalised (randomised) quantile residuals are defined as
 ${\hat r_i} = {\Phi ^{ - 1}}\left( {{w_i}} \right),$
, where Φ−1 is the inverse cumulative distribution function of a standard Normal distribution and where
 ${w_i} = {F_i}({y_i}|3\user2{\hat q})$
where F
i
is the cumulative distribution function estimated for the ith individual, y
i
is the corresponding observation and
 $\hat \theta $
contains all estimated model parameters. For discrete response distributions, the aforementioned definition is extended and w
i
is defined as a random value from the uniform distribution on the interval
 $[{F_i}({y_i} - 1|3\user2{\hat q}),{F_i}({y_i}|3\user2{\hat q})].$
. In both cases, the model fit can be evaluated by means of usual quantile– quantile plots. Specifically, if the data indeed follow the assumed distribution, then the residual on the quantile–quantile plot will fall approximately on a straight line. Figure 2 shows the normalised (random) quantiles for the NBI, PIG, Exponential, GB2, Pareto and ELN regression models. From Figure 2, we see that the residuals of the NBI and PIG models are very close to the diagonal and indicate a very good fit to the distribution of the claim frequencies. Also, regarding claim severities, the residuals indicate that the GB2, Pareto and ELN models are better assumptions than the Exponential model since the residuals of the former three are very close to the diagonal and indicate a very good fit to the distribution of the claim sizes, while the sample quantiles of the Exponential model greater than 2 are significantly higher than the theoretical quantiles and thus, as expected, the Exponential model does not capture the tail of the claim size distribution which corresponds to significantly large claim sizes.
Normalised quantiles for the NBI, PIG, Exponential, GB2, Pareto and ELN regression models.

Additionally, in what follows, we will investigate the behaviour of the ELN distribution at large claim sizes and compare it to that of the Gamma and Pareto distributions. In particular, we will present a ranking of these claim severity distributions by the right tail indexFootnote 4 which is a risk measure for right tail deviation that was suggested by Wang (Reference Hesselager, Wang and Willmot1998). The right tail index is defined as
 $$d(Y) = \frac{{_0^\infty \sqrt {S_Y \left( t \right)} dt}}{{E(Y)}} - 1$$
where S Y (t) = P (Y ≥ t) is the survival function, or the decumulative distribution function, of Y.
Figure 3 displays three plots of the right tail index, d(Y), as a function of the variance for the Gamma, Pareto and ELN distributions respectively. The parameters were chosen so that the Gamma, Pareto and ELN distributions have a unit mean, i.e. E(Y) = 1, and varying variance, Var(Y), taking on the same values for all densities. From Figure 3, we observe that the ranking of all models in terms of their right tail index values is consistent with what was discussed in section 1. Specifically, the right tail index ranks the Pareto distribution as having a fatter tail than ELN distribution, which in turn has a fatter tail than the Gamma distribution.
Plot of the right tail index as a function of the variance for the Gamma, Pareto and ELN distributions with unit mean.

Finally, the empirical estimator of the right tail index,
 $\hat d(Y)$
, which was considered by Jones & Zitikis (Reference Jones and Zitikis2003) can be calculated as
 $$7\hat d(Y) = \sum\limits_{i = 1}^n c_i \frac{{Y_{(i)} }}{{\bar Y}}$$
where Y (i) is the i − th ordered observation of the sample Y 1, ..., Y n and where the coefficients c i are given by
 $$c_i = \sqrt {\left( {\frac{{n - i}}{n}} \right)} + \sqrt {\left( {\frac{{n - i + 1}}{n}} \right)} - \frac{1}{n}$$
for i = 1, ..., n.
Regarding our data set, the value which we obtained for the empirical estimator of the right tail index is
 $\hat d(Y) = 1.362$
, while the ELN distribution has a right tail index d(Y) = 1.217 which is close to the empirical result. Nevertheless, since for smaller data sets the empirical approach can lead to an underestimation of d(Y), it makes sense to build a parametric bootstrap two-sided confidence interval (CI) for
 $\hat d(Y).$
. Given our data, we generated B = 100,000 bootstrap samples of size 9,986 and we calculated the 95% bootstrap-based CI for
 $\hat d(Y).$
to be (1.113, 1.560). The value 1.217 is included in this CI and hence this is an additional indicator that the ELN distribution is able to effectively model the right tail of the data.
4.2 Models comparison
Thus far, we have the NBI, PIG and GB2, Pareto and ELN competing distributions/regression models for the claim frequency and severity component respectively. Consequently, to differentiate between these models, this subsection compares them so as to select the best for each case, employing the Global Deviance (DEV), Akaike information criterion (AIC) and the Schwarz Bayesian Criterion (SBC) which are classic hypothesis/specification tests. The (fitted) Global Deviance is defined as
 $$slDEV = - 23\hat l(3\user2{\hat q})$$
where l̂ is the maximum of the log-likelihood and
 $\hat \theta $
is the estimated parameter vector of the model. Furthermore, the AIC is given by
 $$AIC = slDEV + 2 \times df$$
and the SBC is given by
 $$SBC = slDEV + \log \left( n \right) \times df$$
where df are the degrees of freedom, that is, the number of fitted parameters in the model and n is the number of observations in the sample.
It should be noted that special emphasis should be placed on the comparison of the NBI distribution/regression model with the PIG distribution/regression model and the comparison of the Pareto distribution/regression model with the ELN distribution/regression model since their stochastic mixture representation, see sections 2 and 4, enables the use of a Bayesian approach towards deriving a posteriori, or BM, ratemaking mechanisms for the number and the cost of claims. Moreover, in a posteriori ratemaking it is of crucial importance to the actuary to have interpretable results in order to refine their a priori risk classification and restore fairness by using a premium structure that can be sufficiently explained to policyholders and regulators. Therefore, while the GB2 model is also included in this subsection for the sake of comparison with the two mixed Exponential models, in the following subsections we will limit our analyses only to the NBI, PIG, Pareto and ELN distributions/regression models since the differences between those models will produce different a posteriori, or BM, premiums. Note also that since the NBI and PIG models for the frequency component and the Pareto and ELN models for the severity component have the same number of parameters, it is sufficient to examine the respective log-likelihoods. The resulting Global Deviance, AIC and SBC values for the NBI, PIG, Pareto and ELN models are given in Table 4 (Panels A and B). As is well known, a commonly used rule-of-thumb states that a model significantly outperforms a competitor if the difference in their log-likelihoods exceeds five, corresponding to a difference in their AIC values of more than ten and to a difference in their SBC values of more than 5, see Burnham & Anderson (Reference Burnham and Anderson2003) and Raftery (Reference Raftery1995) respectively. This means here that, as can be seen from Panels A and B, as far as claim frequencies are concerned, the best fit is given by the PIG distribution/regression model, while regarding the claim severities, the ELN distribution/regression model is superior to the Pareto distribution/regression model.
Global deviance, AIC and SBC values for the NBI, PIG, GB2, Pareto and ELN models

Finally, Table 4 (Panels A and B) also includes the Deviance, AIC and SBC values for the GB2 model. Our findings suggest that with respect to the AIC (see Panels A and B) and the Global Deviance (see Panel B) test results, the fit provided by the GB2 distribution/regression model is only marginally better than the fit given by the ELN distribution/regression model, which has fewer parameters. However, when the SBC test is used, we observe a slight superiority of the ELN distribution/regression model versus the GB2 distribution/regression model. The difference in the outcome of the AIC and SBC tests for the GB2 and ELN distributions/regression models is understandable because, as has been mentioned on several occasions in the applied statistical literature, the AIC may fail to choose the most parsimonious model because the AIC function is largely based on the deviance function, whereas the BIC penalises model complexity, i.e. the number of parameters, more heavily. In particular, as it can be seen from equations (35 and 36), only the penalty term differs between each formula, while the goodness of fit parts remain the same. Therefore, in this case the BIC favours the more parsimonious ELN distribution/regression model since in the BIC the penalty for additional parameters is stronger than that of the AIC. Of course, for other data sets the GB2 distribution/regression model, which has more parameters, may perform better than both the Pareto and ELN distributions/regression models. In such cases, if we knew that the actual distribution is a GB2, we would prefer to fit a GB2 instead of a mixed exponential model. Nevertheless, before using any distribution for carrying out different tasks, such as setting the appropriate level of premiums, reserves and reinsurance, its appropriateness for modelling claims data should always be investigated. In the case of the GB2 distribution, if the data set is large, even if the GB2 provides parameter estimates with small standard errors, these estimates may be significantly biased if the assumption that the distribution is a GB2 is not valid. Moreover, if the data set is small, the parameter estimates of the GB2 distribution can be unstable, as for instance was reported in Calderín-Ojeda, Fergusson & Wu (Reference Calderín-Ojeda, Fergusson and Wu2017). In particular, Calderín-Ojeda, Fergusson & Wu (Reference Calderín-Ojeda, Fergusson and Wu2017) developed a novel EM algorithm for ML estimation of the parameters of the heavy-tailed Double Pareto-Lognormal (DPLN) regression model. As was discussed in Reed & Jorgensen (Reference Reed and Jorgensen2004), the DPLN model exhibits Paretian behaviour in both tails, among other theoretical properties, and hence can be considered as a valid alternative to other parametric heavy-tailed models such as the GB2 model. With this in mind, Calderín-Ojeda, Fergusson & Wu (Reference Calderín-Ojeda, Fergusson and Wu2017) compared the performance of the DPLN distribution with the GB2 distribution and reported that regarding small sample sizes the standard errors of the parameter estimates of the DPLN distribution are noticeably smaller, highlighting the consistency of the parameter estimation for the DPLN distribution and its advantage over the GB2 distribution in this case.
4.3 Calculation of the a priori premiums
In this subsection, based on the use of the net premium calculation principle, we analyse the differences between the Pareto and ELN claim severity regression models through the mean of the cost of claims of the policyholders who belong to the 36 different risk classes, which are determined by the relevant a priori characteristics. In particular, E(y i |x i ), for i = 1, ..., n, forms the basis of the premium for each risk class. Note that in the case of the ELN model, which does not have a pdf in closed form, the estimated expected annual claim severity for each risk class was calculated in equation (6) using the law of total expectation. Additionally, we calculate the a priori premiums that must be paid by all the different groups of policyholders based on the combinations of the NBI and PIG regression models for approximating claim frequency and the two competing claim severity regression models. Specifically, assuming independence between the claim frequency and severity components, the premium rates calculated according to net premium principle are given by E(k i |χi) × E(y i |x i ), for i = 1, ..., n, in the case of the ELN, Pareto, NBI and PIG regression models, see equations (6, 19, 26 and 30) respectively.
The results are summarised in Table 5. At this point we should emphasise that if the ratemaking exercise is only based on the number of claims at fault, regardless of their severity, which is usually the case encountered in the literature, this over-simplification can be regarded as problematic since it can limit any insights one can get into the extent to which certain explanatory variables can predict insurance outcomes as these can significantly differ between the number and the costs of claims. The key idea is that both the a priori and a posteriori corrections should aim at creating tariff cells as homogeneous as possible by integrating the severity of the claims since this can improve ratemaking by providing a more complete picture to the actuary about the extent to which the amounts of premiums vary according to observable characteristics of policyholders and their cars. For instance, from Table 5 we observe that the premium payment for a policyholder who belongs to the first BM category lives in a large city and has a car with HP between 0 and 1,400 cc, i.e. for the reference class, is equal to 2,557.30 and 2,497.14 euros, while another insured who belongs to the same BM category has a car with similar characteristics and lives in a small city, i.e. risk class 3, has to pay a higher premium equal to 2,668.06 and 2,629.11 euros in the case of the Pareto and ELN models respectively. However, when the number of claims is also taken into consideration, the premium payment for the first individual we described before, i.e. for the reference class, reduces to 1,290.27 and 1,259.92 euros in the case of the NBI-Pareto and NBI-ELN models respectively, and to 1,289.88 and 1,259.54 euros in the case of the PIG-Pareto and PIG-ELN models respectively, and hence is now higher than the premium required to be paid by the second individual we described before, i.e. for risk class 3, which goes down to 846.50 and 834.14 euros in the case of the NBI-Pareto and NBI-ELN models respectively, and to 820.41 and to 808.43 euros in the case of the PIG-Pareto and PIG-ELN models respectively. Moreover, we observe that regarding all combinations of both claim frequency models with the two corresponding claim severity models, the group of policyholders with the lowest expected claim severity are those who belong to the second BM category, live in a large city and have a car with HP between 0 and 1,400 cc, i.e. risk class 10, whereas the group of insureds with the highest expected claim severity are those who belong to the third BM category, live in a middle sized city and have a car with HP between 1,400 and 1,800 cc, i.e. risk class 23. On the other hand, when claim frequencies are also taken into account, the lowest premium payment is required by those insureds who belong to the second BM category, live in a small city and have a car with HP between 0 and 1,400 cc, i.e. risk class 12, whereas the highest premium payment is required by those policyholders who belong to the first BM category, live in a large city and have a car with HP greater than 1,800 cc, i.e. risk class 7.
A priori premium rates, NBI, Pareto, PIG and ELN regression models

Overall, as expected, Table 5 shows that small differences lie in the a priori premiums resulting from the Pareto and ELN claim severity models and also in those determined by their combinations with the NBI and PIG claim frequency models because, as is well known, in this case only the mean parameters of the Pareto and ELN models, which are modelled using the same covariate information, affect the estimation of the premium rates. However, on the path towards actuarial relevance where the Bayesian view will be taken to calculate the severity of the a posteriori corrections, it is the value of the dispersion parameter of the Lognormal mixing distribution that will consequently affect the calculation of the a posteriori, or BM, premium rates. In particular, as was previously mentioned, the ELN model which is less heavy-tailed than the Pareto model will show much less extreme relative a posteriori, or BM, premiums for policyholders with some claim experience.
4.4 Calculation of the a posteriori premiums
In this subsection, we examine how the ELN model responds to claim experience. Consider a policyholder i who was observed for t years of their presence in the portfolio with claim frequency history
 $k_i^1,...,k_i^t$
and denote by
 $y_{i,k}^j$
the loss incurred from their claim k for the period j, for i = 1, ..., n and j = 1, ..., t. Then, the information we have for their claim size history will be in the form of a vector
 $y_{i,1}^1,...,y_{i,k_i^t}^t$
and the total amount of their claims will be equal to
 $\sum\limits_{j = 1}^t {\sum\limits_{k = 1}^{k_i^j} {y_{i,k}^j.} } $
. The problem is to determine at the renewal of the policy the expected claim severity of the policyholder i for the period t + 1 given the observation of the reported accidents in the preceding t periods and observable characteristics in the preceding t + 1 periods and the current period. Applying Bayes theorem, one can find that the pdf of the posterior distribution of
 $z_i^{t + 1},$
, given claim size records
 $y_{i,1}^1,...,y_{i,k_i^t}^t$
and
 $x_i^1,...,x_i^{t + 1}$
individual characteristics records, is given by
 $$E(y_i^2 |{\bf{x}}_i ) = \frac{{\mu _i^2 B\left( {\nu + \frac{2}{\phi },\tau - \frac{2}{\phi }} \right)}}{{B\left( {\nu ,\tau } \right)}},{\text{for}} - \nu < \frac{2}{\phi } < \tau $$
where
 $f(y_{i,k_i^t}^j|{{\bf{x}}_i},{z_i})$
is the pdf of the Exponential distribution, which is given by equation (1), and where
 $g(z_i^{t + 1})$
is the pdf of the Lognormal prior distributionFootnote
5
which is given by equation (4). Using the quadratic loss function and the net premium principle, one can find that the mean of the posterior structure function given byFootnote
6
 $$E(z_i^{t + 1} |y_{i,1}^1 ,...,y_{i,k_i^t }^t ;{\kern 1pt} x_i^1 ,...,x_i^{t + 1} ) = _0^\infty z_i^{t + 1} g(z_i^{t + 1} |y_{i,1}^1 ,...,y_{i,k_i^t }^t ;{\kern 1pt} x_i^1 ,...,x_i^{t + 1} )dz_i^{t + 1} $$
The expectation in equation (38) does not have a closed form expression. However, it can be easily computed based on either numerical integration or a Monte Carlo approach since neither scheme requires knowledge of the pdf of the posterior distribution of
 $z_i^{t + 1}$
.
Based on the aforementioned methodology, we compute the a posteriori, or BM, premium rates resulting from the ELN model based only on different claim costs, i.e. the a posteriori criteria, and based both on different claim costs and the characteristics of the policyholder and the automobile, i.e. the a priori criteria. When both criteria are considered, we examine a group of policyholders who share the following common characteristics: We consider that the policyholder i belongs to the first BM category, lives in a large city and has a car with HP between 0 and 1,400 cc. The premium rates will be divided by the premium when t = 0, i.e. we calculate the relative premiums, since we are interested in the differences between various classes and the results are presented so that the premium for a new policyholder is 100. Table 6 (Panels A and B) shows comparable relative premiums for the Pareto and ELN distributions/regression models respectively, assuming that the cost of one claim in the first year of observation ranges from 1,000 euros to 20,000 euros. Table 6 (Panels A and B) shows that when the claim size increases the premium rates also increase. Furthermore, we observe that while for very small claim sizes up to 2,000 euros the bonuses awarded by the ELN and Pareto distributions/regression models are almost indistinguishable, in all other cases, as expected, the less heavy-tailed ELN distribution/regression model in general penalises policyholders who reported claims with moderate amounts significantly less severely than the Pareto distribution/regression model. For example, from Panel A, when only the a priori criteria are considered, we see that policyholders who had one claim size of 12,000 euros in the first year will have to pay a malus of 65.94% and 31.75% of the basic premium, while those who had one claim size of 15,000 euros in the first year will have to pay a malus of 87.27% and 40.62% of the basic premium in the case of the Pareto and ELN distributions respectively. Additionally, from Panel B when both the a priori and the a posteriori criteria are considered, we see, for instance, that policyholders who had one claim size of 14,000 euros in the first year will have to pay a malus of 86.28% and 39.88% of the basic premium, while those who had one claim size of 17,000 euros in the first year will have to pay a malus of 108.90% and 48.79% of the basic premium in the case of the Pareto and ELN regression models respectively.
A posteriori, or BM, premium rates, Pareto and ELN distributions/regression models

Let us now compute the BMSs with a frequency and a severity component using the net premium calculation principle. As far as the claim frequency component is concerned, similar to the severity component, employing a Bayesian approach and using the quadratic error loss function, one can easily see that the BM premium rates are given by the posteriorFootnote
7
mean
 $E\big( u_{i}^{t+1}|k_{i}^{1},...,k_{i}^{t};\,\chi _{i}^{1},...,\chi_{i}^{t+1}\big) ,$
, where
 $\chi _{i}^{1},...,\chi _{i}^{t+1}$
is the vector of individual characteristics. In what follows, based on the NBI and PIG distributions/regression models and the Pareto and ELN distributions/regression models for approximating the number and the cost of claims respectively, the relative premiums resulting from those systems are calculated via the product of the posterior mean claim frequency and the posterior mean claim severity, i.e.
 $E\big(u_{i}^{t+1}|k_{i}^{1},...,k_{i}^{t};\,\chi _{i}^{1},...,\chi _{i}^{t+1}\big)\times E\big(z_{i}^{t+1}|y_{i,1}^{1},...,y_{i,k_{i}^{t}}^{t};\,x_{i}^{1},...,x_{i}^{t+1}%\big) $
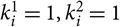
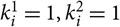
, assuming that the accumulative claim severities range from 1,000 euros to 20,000 euros when the age of the policy is up to j = 2 years. Tables 7 and 8 summarise our findings with respect to the a posteriori criteria in the case of the NBI-Pareto and NBI-ELN and PIG-Pareto and PIG-ELN distributions respectively. Also, Tables 9 and 10 present our results with respect to both the a priori and a posteriori criteria in the case of the NBI-Pareto and NBI-ELN and PIG-Pareto and PIG-ELN regression models respectively. Note that for the BMSs derived based on both criteria, since the explanatory variable BM category varies substantially depending on the number of claims of policyholder i for year j, the explicit claim frequency history determines the calculation of the premium rates resulting from the NBI, PIG, Pareto and ELN regression models and not just the total number of claims K, as in the case when only the a posteriori criteria are considered or when the policyholder is observed for a single year and both criteria are taken into account. Due to the aforementioned reason, in the examples presented in Tables 9 and 10, we consider two cases in which we specify the exact order of the claim frequency history in order to derive the relative premiums that must be paid by the same insured we described before when only the severity component was examined. Specifically, we assume that the specific policyholder has either reported one claim in the first year and another claim in the subsequent year, i.e.
 $k_{i}^{1}=1,k_{i}^{2}=1,$
, thus K = 2 at j = 2, or that they have made one claim in the first year and two claims in the subsequent year, i.e.
 $k_{i}^{1}=1,k_{i}^{2}=2,$
, hence K = 3 at j = 2. In what follows we discuss our findings. Firstly, from all Tables7–10, we observe that the systems resulting from the NBI-Pareto, NBI-ELN, PIG-Pareto and PIG-ELN distributions/regression models are fair since if the total accumulated number of claims K is kept constant the premium reduces over time while it increases proportionally to the total claim severity, whereas if time and the total claim size are fixed the premium increases when the total claim frequency increases. Secondly, for very small accumulative claim costs, specifically from 1,000 up to 5,000 euros in both the first and the second year of observation, when only the a posteriori criteria are considered, see Tables 7 and 8, and from 1,000 up to 5,000 euros and from 1,000 up to 7,000 euros in the first and the second year of observation respectively, when both criteria are taken into account, see Tables 9 and 10, we observe that the BMSs resulting from the NBI-ELN and PIG-ELN models punish slightly more those policyholders who had more than one claim in a given year than the systems determined by the NBI-Pareto and PIGPareto models respectively. On the contrary, those individuals who had only a single small claim in a given year of a cost which is equal to the total cost of those with more than one claim are, in the majority of cases, penalised slightly more under the BMSs provided by the NBI-Pareto and PIG-Pareto models. Those two observations imply that, regarding those claims with very small amounts, the ELN model generally puts more emphasis on the frequency component and hence distributes their burden among insureds in a more fair and equitable manner than the Pareto model. For instance, from Table 7, when j = 1, we see that policyholders who had one claim size of 4,000 euros will have to pay a malus of 94.61% and 88.06% of the basic premium, while those who had two claims with total size amounting to 4,000 euros will have to pay a malus of 144.75% and 157.13% of the basic premium in the case of the NBI-Pareto and NBI-ELN distributions respectively. From Table 7, when j = 2, we observe that policyholders who had one claim size of 4,000 euros will have to pay a malus of 75. 26% and 69.36% of the basic premium, while those who had two claims with total size equal to 4,000 euros will have to pay a malus of 120.43% and 131. 58% of the basic premium in the case of the NBI-Pareto and NBI-ELN distributions respectively. From Table 8, when j = 1, we see that policyholders who had one claim size of 4,000 euros will have to pay a malus of 90.02% and 83.62% of the basic premium, while those who had two claims with total size amounting to 4,000 euros will have to pay a malus of 175.42% and 189.35% of the basic premium in the case of the PIG-Pareto and PIG-ELN distributions respectively. From Table 8, when j = 2, we observe that policyholders who had one claim size of 4,000 euros will have to pay a malus of 65% and 59.43% of the basic premium, while those who had two claims with total size equal to 4, 000 euros will have to pay a malus of 132.69% and 144.46% of the basic premium in the case of the PIG-Pareto and PIG-ELN distributions respectively. From Table 9, when j = 1, we see that policyholders who had one claim size of 5,000 euros will have to pay a malus of 103.16% and 88.82% of the basic premium, while those who had two claims with total size equal to 5,000 euros in the first year will have to pay a malus of 128.93% and 130.69% of the basic premium in the case of the NBI-Pareto and NBI-ELN regression models respectively. From Table 9, when j = 2, we observe that policyholders who had claim frequency history
 $%k_{i}^{1}=1,k_{i}^{2}=2$ (i.e. total number of claims $K=3$ at $j=2$
(i.e. total number of claims K = 2 at j = 2) and the total size of their claims amounts to 7,000 euros will have to pay a malus of 131.49% and 121. 07% of the basic premium, while those who had claim frequency history
 $%k_{i}^{1}=1,k_{i}^{2}=2 $
(i.e. total number of claims K = 3 at j = 2) and the total size of their claims amounts to 7,000 euros will have to pay a malus of 164.96% and 170.98% of the basic premium, in the case of the NBI-Pareto and NBI-ELN regression models respectively. From Table 10, when j = 1, we see that policyholders who had one claim size of 5, 000 euros will have to pay a malus of 87.98% and 74.71% of the basic premium, while those who had two claims with total size equal to 5,000 euros in the first year will have to pay a malus of 135.12% and 136.92% of the basic premium in the case of the PIG-Pareto and PIG-ELN regression models respectively. From Table 10, when j = 2, we observe that policyholders who had claim frequency history
 $%k_{i}^{1}=1,k_{i}^{2}=1$
(i.e. total number of claims K = 2 at j = 2) and the total size of their claims amounts to 7, 000 euros will have to pay a malus of 108.76% and 99.36% of the basic premium, while those who had claim frequency history
 $k_{i}^{1}=1,k_{i}^{2}=2 $
(i.e. total number of claims K = 3 at j = 2) and the total size of their claims amounts to 7,000 euros will have to pay a malus of 157.25% and 163.10% of the basic premium, in the case of the PIG-Pareto and PIG-ELN regression models respectively. Finally, similar to the results presented in the Table 6, in every other case, Tables 7–10 show that the BMSs resulting from the NBI-ELN and PIG-ELN distributions/regression models penalise policyholders with moderate costs considerably less severely than the systems determined by the NBI-Pareto and PIG-Pareto distributions/regression models. For example, from Table 7, when j = 1, we see that policyholders who had K = 1 claim size of 14,000 euros will have to pay a malus of 221.48% and 145.73% of the basic premium, while those who had K = 2 claims with total size amounting to 14,000 euros will have to pay a malus of 304.31% and 241.97% of the basic premium in the case of the NBI-Pareto and NBI-ELN distributions respectively. From Table 7, when j = 2, we observe that policyholders who had K = 1 claim size of 17,000 euros will have to pay a malus of 223.79% and 135.12% of the basic premium, while those who had K = 2 claims with total size equal to 17,000 euros will have to pay a malus of 307.26% and 228.24% of the basic premium in the case of the NBI-Pareto and NBI-ELN distributions respectively. From Table 8, when j = 1, we see that policyholders who had K = 1 claim size of 14,000 euros will have to pay a malus of 213.89% and 139.93% of the basic premium, while those who had K = 2 claims with total size amounting to 14,000 euros will have to pay a malus of 354.98% and 284.83% of the basic premium in the case of the PIG-Pareto and PIG-ELN distributions respectively. From Table 8, when j = 2, we observe that policyholders who had K = 1 claim size of 17,000 euros will have to pay a malus of 204.81% and 121.34% of the basic premium, while those who had K = 2 claims with total size equal to 17,000 euros will have to pay a malus of 329.91% and 246.49% of the basic premium in the case of the PIG-Pareto and PIG-ELN distributions respectively. From Table 9, when j = 1, we see that policyholders who had K = 1 claim size of 15,000 euros will have to pay a malus of 232.52% and 145.14% of the basic premium, while those who had K = 2 claims with total size equal to 15,000 euros in the first year will have to pay a malus of 278.63% and 206.21% of the basic premium in the case of the NBI-Pareto and NBI-ELN regression models respectively. From Table 9, when j = 2, we observe that policyholders who had claim frequency history
 k_{i}^{1}=1,k_{i}^{2}=1$
(i.e. total number of claims K = 2 at j = 2) and the total size of their claims amounts to 18,000 euros will have to pay a malus of 278.73% and 191.82% of the basic premium, while those who had claim frequency history
 $k_{i}^{1}=1,k_{i}^{2}=2$
(i.e. total number of claims K = 3 at j = 2) and the total size of their claims amounts to 18, 000 euros will have to pay a malus of 333.51% and 262.86% of the basic premium, in the case of the NBI-Pareto and NBI-ELN respectively. From Table 10, when j = 1, we see that policyholders who had K = 1 claim size of 15,000 euros will have to pay a malus of 207.67% and 126.82% of the basic premium, while those who had K = 2 claims with total size equal to 15, 000 euros in the first year will have to pay a malus of 288.86% and 214.48% of the basic premium in the case of the PIG-Pareto and PIG-ELN regression models respectively. From Table 10, when j = 2, we observe that policyholders who had claim frequency history
 $%k_{i}^{1}=1,k_{i}^{2}=2$
(i.e. total number of claims K = 2 at j = 2) and the total size of their claims amounts to 18,000 euros will have to pay a malus of 241.53% and 163.15% of the basic premium, while those who had claim frequency history
 $%k_{i}^{1}=1,k_{i}^{2}=2$
(i.e. total number of claims K = 3 at j = 2) and the total size of their claims amounts to 18,000 euros will have to pay a malus of 320.90% and 252.30% of the basic premium, in the case of the PIG-Pareto and PIG-ELN respectively.
A posteriori, or BM, premium rates, NBI, Pareto and ELN distributions

A posteriori, or BM, premium rates, PIG, Pareto and ELN distributions

A posteriori, or BM, premium rates, NBI, Pareto and ELN regression models

A posteriori, or BM, premium rates, PIG, Pareto and ELN regression models

Overall, as was illustrated in Tables 6–10, it is reasonable to agree that in MTPL data sets like the one used in this study, where moderate observations constitute the largest proportion of our sample, whereas large observations have very low frequencies, under the Pareto model it is very likely that policyholders will bear the cost of claims themselves because of the growth in premium payments, while the employment of the new model is beneficial for the insurance company as it can enable them to adopt a generally more mild pricing strategy for policyholders who reported a large number of claims with moderate severities, leading to a discouragement of the Bonus– Hunger phenomenon.
5. Conclusions
The main purpose of this paper was to propose an EM type algorithm that reduces the computational burden for ML estimation in the ELN regression model. The ELN regression model extends the commonly used specification that assumes that claims costs are distributed according to the Pareto regression model which was widely accepted for designing merit rating plans in accordance with the a priori ratemaking structure of the insurance company. The ELN model has just the appropriate level of generality for deriving both a priori and a posteriori ratemaking mechanisms, since while its upper tail can sufficiently fit large size claims, the ELN model can be considered as a candidate model for approximating moderate claim severities with high frequencies. Furthermore, the ELN regression model is suitable for application not only in insurance ratemaking but also in survival analysis, since, as is well known, all the distributions with decreasing failure rate can be retrieved as mixtures of the exponential distribution, see, for instance, Proschan (Reference Proschan1963) and Barlow & Proschan (Reference Barlow and Proschan1975). Additionally, it should be noted that the novel EM type algorithm we developed in this study was based on the mixture representation of the ELN model, and did not require knowledge of its pdf, which could not be written in closed form, while it is computationally parsimonious and can avoid overflow problems which may occur via other numerical maximisation schemes. Therefore, it is obvious that the ML estimation scheme we presented has the considerable mathematical flexibility for fitting an abundance of mixed Exponential regression models stemming from several other mixing distributions which are not conjugate to the Exponential.
An interesting possible line of further research would be to go through the ratemaking exercise based on generalisations of the proposed model such as a finite mixture of the ELN model and two component mixture models, where the first component distribution is the ELN and the second component model can be a different more or less heavy-tailed claim severity distribution, thus providing alternative options to the insurer when they are deciding on their pricing strategies, see Tzougas, Vrontos & Frangos (Reference Tzougas and Frangos2014), and Ni et al. (Reference Ni, Constantinescu and Pantelous2014) and Tzougas, Vrontos & Frangos (Reference Tzougas, Vrontos and Frangos2018) respectively. The log-likelihood function of the general models can be maximised without special effort using standard techniques for finite mixtures, see Bohning (Reference Bohning1999). Finally, the data augmentation which was used in the paper to derive the EM algorithm can be the basis for constructing Bayesian estimation methods, including functional forms other than the linear proceeding along similar lines as Klein et al. (Reference Klein, Denuit, Lang and Kneib2014) in which Bayesian generalised additive models for location, scale and shape claim frequency models were employed for non-life ratemaking and risk management.
Acknowledgements
The research reported here was supported by LSE LIFE and LSE Teaching and Learning Centre. We would like to thank the anonymous referee for their constructive comments and suggestions that have greatly improved the article. We also would like to thank the participants at the 11th International Conference of the ERCIM WG on Computational and Methodological Statistics. The usual disclaimer applies.