The “Little Divergence” in real wages between northwestern and southern Europe is one of the most prominent features in the evolution of living standards in the pre-industrial period. Two decades after Robert Allen’s (Reference Allen2001) seminal contribution, the notion of a divergence in real wages preceding the Industrial Revolution is indeed a well-established “stylized fact” among many economic historians.Footnote 1 However, some aspects of the empirical evidence underpinning this narrative have not received enough attention.
On the one hand, this view is based on the study of a sample of leading European cities (Amsterdam, Florence, London, Paris, Vienna, etc.), while with few notable exceptions (Clark Reference Clark2005, 2007; Humphries and Weisdorf 2019; Pfister Reference Pfister2017), the evidence concerning smaller urban agglomerates and rural areas is still fragmented.Footnote 2 On the other hand, most of the literature has focused on construction workers, who represent only a fraction of urban occupations in a world that was still primarily rural. Accordingly, most of the claims about the dynamics of real wage divergence across countries rest on the assumptions that the real wages of leading cities are fully representative of the national experiences (Allen Reference Allen2001), and that developments in the construction industry adequately capture general patterns of economic growth.Footnote 3
Another important argument is related to the case of France, which has traditionally provided the most important point of comparison for assessing British economic performance between the seventeenth and nineteenth centuries.Footnote 4 In this regard, using a broad set of economic indicators, conventional wisdom has described France in terms of economic “retardation” relative to England.Footnote 5 While subsequent research has questioned this consensus, nuancing the contrasts between the French and English economies (Crouzet Reference Crouzet1966; O’Brien and Keyder Reference O’Brien and Keyder2012), France’s backwardness has clearly re-emerged in recent literature on comparative levels of real wages. Based on evidence from Paris and Strasbourg, Allen (Reference Allen2009b) has characterized eighteenth century France as a low-wage economy relative to England. This view has become mainstream and has laid the foundation for Allen’s (Reference Allen2009a) influential argument on the origins of the Industrial Revolution. In Allen’s view, low wages and high cost of energy in France could not stimulate adoption of machine intensive technology, despite the significant market opportunities offered by France’s large population. Quite surprisingly and notwithstanding France’s centrality in the debate on the origins of the Industrial Revolution, there is still very limited quantitative evidence on its economic performance before the nineteenth century. Indeed, despite the long research tradition emerging from the Annales group, existing contributions have an eminently localized character and mostly focus on the experience of specific regions or what might be called “local economies.”Footnote 6 As a consequence, the study of the historical evolution of real wages (and GDP per capita) in France has remained at a more rudimentary stage compared to other countries.Footnote 7
Georges d’Avenel (1898) was the first historian to venture a national reconstruction relying on a large body of quantitative evidence. While a landmark, the seven volumes of his Histoire économique were mostly based on evidence from Northern France and did not provide aggregate series of real wages.Footnote 8 Ernest Labrousse (Reference Labrousse1932) partially filled the gap by constructing new series of real wages for the eighteenth century, while subsequent research following the lead of François Simiand (Reference Simiand1932) established national indices beginning with the early nineteenth century (Bayet Reference Alain1997; Kuczynski Reference Kuczynski1946; Lévy-Leboyer and Bourguignon Reference Lévy-Leboyer and Bourguignon1985; Sicsic Reference Sicsic, Scholliers and Zamagni1995). Though fundamental in many respects, these contributions are too sparse and heterogeneous to permit formulating even tentative conclusions about long-term developments in real wages from a broader national perspective.
This study makes three main contributions. First, it presents five new series of real wages for male workers: French agricultural laborers, French building laborers, and French building craftsmen for the period 1250–1860, as well as Paris building craftsmen and Paris building laborers for the period 1300–1860. To accomplish this, I estimate new wage and price series using a regression approach, which allows me to combine a large number of observations drawn from a wide array of primary and secondary material, while properly controlling for the heterogeneity of the sources (Clark Reference Clark2005). To provide an international perspective, I construct real wages using Allen’s (Reference Allen2001) welfare ratio approach.
Second, this study reassesses the “Little Divergence” debate, focusing on the experiences of Paris–London and France–England. I find that London real wages had already begun to divergence from those in Paris by the fifteenth century. In contrast, estimates of real wages for England and France do not exhibit any systematic long-run behavior, but rather a sequence of divergence and convergence phases with no clear-cut trend until the second half of the eighteenth century. I suggest that this contrasting evidence can be accounted for by the different trajectories through which Paris and London emerged as the high wage regions of France and England, respectively. Overall, these findings challenge the notion of a late-medieval/early-modern Little Divergence in real wages between England and France and suggest that one should be cautious in inferring national trends from the experience of specific cities.
Third, this study contributes to the long-lasting debate on the comparative levels of development between France and England by extending the range of real wage comparison from the thirteenth to the second half of the nineteenth century. I also provide a reassessment of Allen’s (2015) notion of the British high wage economy as a key factor explaining the Industrial Revolution. Prior work in this area has disputed the high wage hypothesis (Humphries and Schneider Reference Humphries and Schneider2018; Stephenson Reference Stephenson2018). However, critiques mostly pertain to the internal consistency of the British series and focus on relative living standards of different occupations in Britain without taking a global perspective. In contrast, this study adopts an international comparative perspective by comparing English to French real wages. The results suggest that, in the century before the Industrial Revolution, the real wages of English construction workers were broadly similar to the levels prevailing in France. They slowly rose above the French standard in the second half of the eighteenth century, and definitely forged ahead in the second quarter of the nineteenth century. In contrast, the real wages of English agricultural laborers overtook French agricultural laborers only after the 1820s, in the “maturity phase” of the Industrial Revolution. These new findings indicate that for a significant share of the English male labor force, the high wage economy began to emerge during and not before the Industrial Revolution.
WAGES: SOURCES AND METHODOLOGY
The empirical analysis is based on construction of a new dataset of nominal daily wages covering several occupations in the agricultural and construction sectors.Footnote 9 Data are retrieved from collections of printed primary material, a large body of secondary sources, and new archival evidence. This comprises manorial accounts, published records of several building projects, wage bills from the account books of hospitals, municipal organizations, and religious institutions, as well as a large set of local and national enquiries from the late eighteenth and early nineteenth centuries.Footnote 10 Overall, the dataset includes 26,332 wage observations for the period 1250–1860 derived from more than 150 sources. Despite efforts to ensure comprehensive time coverage, the distribution of data over time is uneven and periods of high data frequency alternate with phases of lower data coverage (Online Appendix S1, Figure S1.1). Notwithstanding this limitation, the sample contains enough observations to allow estimation of new series of real wages that are significantly more dependable than those previously available.
The dataset has wide spatial coverage, drawing information from approximately 300 locations in 20 regions. About 30 percent of the wage quotations come from Northern France, 10 percent from the Paris district, 23 percent from the Center, 21 percent from the East, and the remaining share from the South.Footnote 11 Despite the unequal distribution of data across space, the sample is characterized by consistent spatial coverage, as observations from the five regions are collected systematically in each time period.
Potential Biases in Estimating Nominal Wages
A range of potentially relevant factors can affect the evolution of nominal wages. It is therefore important to identify these factors and check their effects on the estimates.
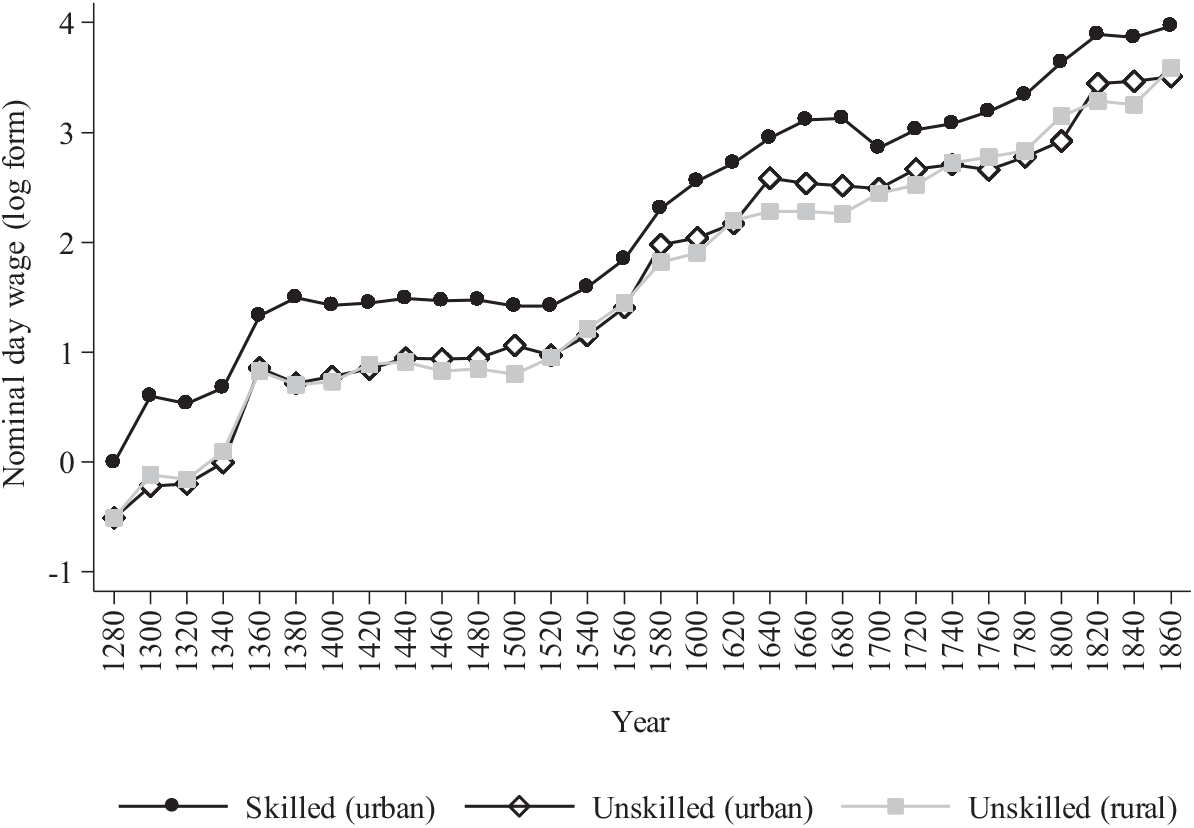
Pre-industrial labor markets were characterized by a remarkable degree of heterogeneity in terms of occupations and skill levels. To address this concern, I concentrate on construction workers because their wages are relatively homogeneous over time and space and allow me to make international comparisons because of their frequent use in historical studies of other countries. In addition, I focus on agricultural laborers. Since day-laborers in agriculture accounted for the largest group in the French labor force, study of their wages provides the best vantage point for formulating general propositions about the historical evolution of real wages in France in the pre-industrial period.Footnote 12 Although wages of masons and carpenters were the most frequently recorded, I identified 17 different professions among the building craftsmen. Wage differences were common in agriculture as well, but these were mostly related to the seasonal nature of the task accomplished. The archives provide rich source materials on the rates paid to day-laborers during harvest, haymaking, and vintage, which required a large quantity of manual labor for short periods. Conversely, it is more difficult to document employment activity of agricultural laborers during winter when the rhythm of work slackened.Footnote 13 In terms of skill levels, the wage structure nicely conforms with Emmanuel Le Roy Ladurie’s (1976, p. 108) characterization of the building industry as having a three-tier structure, with lower rates paid to women, children, and apprentices; intermediate to unskilled laborers; and higher rates to skilled craftsmen.Footnote 14 In contrast, the remuneration by skill in agriculture had a dual structure because the top rank was almost nonexistent. Excluding seasonal peaks, the most qualified farm workers, like the winegrowers and reapers, were paid less than craftsmen in the building trades. These patterns are also evident in the database using 20-year averages, as shown in Figure 1. Overall, almost 44 percent of the wage observations are for male building craftsmen, almost 23 percent refer to male building laborers, and 33 percent are for male unskilled casual workers employed in agriculture.
FRENCH NOMINAL WAGES BY CATEGORY: 20-YEAR AVERAGES

Another potential factor which can determine significant wage differences is seasonality. The writer of the Compte of Guillaume d’Oncieu illustrated this point clearly when it came time to rebuild the mills and re-establish ordinary communications on the Ain’ river in the dry summer of 1312: “Seventy-two other laborers working at the same task […] taking each twenty deniers per day, and they were more expensive because it was harvest time.”Footnote 15 From north to south, sources abound with references to the scarcity of labor in summer when the demand for farm labor peaked.Footnote 16 Furthermore, as manufacturing and agriculture became more specialized by the seventeenth century, competition across sectors grew in importance as a source of seasonality (Magnac and Postel-Vinay Reference Magnac and Postel-Vinay1997, p. 98). Clearly, seasonal variations in daily wage were the result of several other interacting factors that could create large regional variations, such as the length of the workday, skill level, or contracting system governing the recruitment process.Footnote 17 Until the early modern period, daily wages of construction workers in Avignon, Bayonne, and Dijon displayed astounding rigidity. Similarly, the amplitude of the seasonal movement was low in large urban agglomerates in the north, such as Paris or Troyes, as well as in Normandy, where the distinction between summer and winter wages had been progressively abandoned by the mid-fifteenth century (Beaurepaire Reference Beaurepaire1865, p. 237). Conversely, seasonal pay differences were large (about 50 percent) and persistent in the grain-growing areas of nineteenth century France but were almost nonexistent in areas where livestock raising was predominant (Magnac and Postel-Vinay Reference Magnac and Postel-Vinay1997, pp. 6–7).
Complicating the issue further, payment in cash coexisted with other forms of remuneration over the pre-industrial period. These included in-kind supplements of different types, which varied in relation to the nature of the work and length of employment. Wages in kind, mixed wages, or payment in the form of a proportion of produce spread to a fairly large section of rural society. Nevertheless, construction workers and agricultural laborers were paid primarily in money (Le Roy Ladurie 1987, p. 68). Moreover, most of the workers employed on a monthly or yearly basis received food and lodging (Geremek Reference Geremek1968, p. 85; Rosenthal Reference Rosenthal1992, pp. 103–4), while construction workers employed on short-term contracts were mostly paid in cash. In practice, it is often difficult to distinguish how labor was compensated because the sources are often elusive about the nature of the wages. However, as the in-kind component was a significant share of total earnings, undue neglect of this feature can lead to significant underestimation of actual income (Geloso Reference Geloso2018). Based on the different forms of remuneration, wage observations are classified into four categories: (1) “not-nourished,” when the source clearly indicates that the worker is paid in cash, (2) “nourished,” if the worker additionally receives an in-kind component, (3) “not-nourished assumed,” when the source does not state if the payment is in cash or in kind, but it is possible to identify how the worker is paid, and (4) “unknown,” when the form of remuneration is not indicated. To distinguish between in-cash and in-kind payments, I check whether a specific source reports the cash rates paid to nourished and not-nourished workers for the same task and period. Alternatively, I use a set of secondary sources that provide a long series of cash wages paid to nourished and not-nourished workers.Footnote 18 As payment in kind accounted for a large share of total remuneration, the cash component fell to implausibly low levels when the worker was nourished. Hence, wages in cash and in kind can be easily distinguished in these cases.Footnote 19 The final estimation sample includes wages of not-nourished workers and a limited number of observations of wages of nourished workers for which the value of in-kind payment could be imputed.
A final complicating factor in reconstructing annual incomes is the dearth of information on the days worked per year. For the sake of international comparability, I follow Allen (Reference Allen2001) and convert daily wages to annual incomes assuming 250 days per year. Still, one may wonder whether this assumption can be suitably applied in the French context.
Detailed information for agricultural workers is rare before the agricultural survey of 1852.Footnote 20 Nevertheless, it seems plausible to assume that agricultural laborers worked about 200 days per year between the seventeenth and eighteenth centuries, and that their working year increased only slightly to the middle of the nineteenth century (Postel-Vinay Reference Postel-Vinay, Grantham and MacKinnon1994, p. 65).Footnote 21 Despite that, it is difficult to interpret these numbers because employment was highly discontinuous for the overwhelming majority of workers, and households often integrated their earnings with other sources of income (Goubert Reference Goubert1986, pp. 101–04).Footnote 22 In contrast, the detailed pay records of a fairly large sample of building projects reveal that the work year of regular construction workers lasted about 250 days between the fourteenth and mid-sixteenth centuries, increasing slightly by the mid-sixteenth century with the reduction in number of festivities (Online Appendix S1, Table S1.6).Footnote 23 This evidence suggests the assumption of an average working year of 250 days is quite accurate for regular workers in the construction sector. In the absence of more precise information, and for the sake of international comparability, I assume the same “standard” duration for agricultural laborers.Footnote 24
The Regression Model
The construction of wage series from such a different array of sources requires particular attention to ensure the necessary degree of consistency in the aggregation process. For wide spatial coverage, I draw on several sources per time period, while I separately treat the observations from the Paris region to avoid oversampling from an area with a distinctively high wage labor market. The evolution of nominal wages in the rest of France was broadly similar over time and across space (Online Appendix S1, Figure S1.8). I estimate new series of nominal daily wages for male agricultural laborers and construction workers (both skilled and unskilled) in Paris and France using the following OLS regression model:Footnote 25
 $$\ln (w_{it} ) = \Sigma _i \alpha _i LOC_i + \Sigma _t \beta _t D_t + \Sigma _j \gamma _j DSEAS_j + \Sigma _k \delta _k DOCC_k + \Sigma _l \vartheta _l DSOURCE_l + \varepsilon _{it^, } 26$$
(1)
where wit is the nominal day wage in location i at time t; Dt is an indicator for each of the years with a wage observation; LOCi is a dummy equaling one if the wage comes from location i and zero, otherwise;Footnote 27 DSOURCEl and DOCCk are indicators for source and occupation, respectively. In particular, the occupational dummies (DOCC) allow me to deal with occupational heterogeneity and to control for those occupations (master craftsmen, reapers, and wine growers) that consistently received high wages compared to the rest of the workers. In the baseline specification in Equation (1), the standard unit of observation is the daily wage paid to a not-nourished worker for a particular task in a given season. However, while some observations are annual averages, seasonality is not observed for others (Online Appendix S1, Table S1.2). To limit the loss of information due to unobserved seasonality, I estimate Equation (1) including a seasonal indicator DSEASj for each of the following categories: autumn, spring, summer, winter, mean, and unknown, where the category “mean” refers to cases where the wage observation is an annual average, while “unknown” denotes observations for which seasonality is not observed.Footnote 28
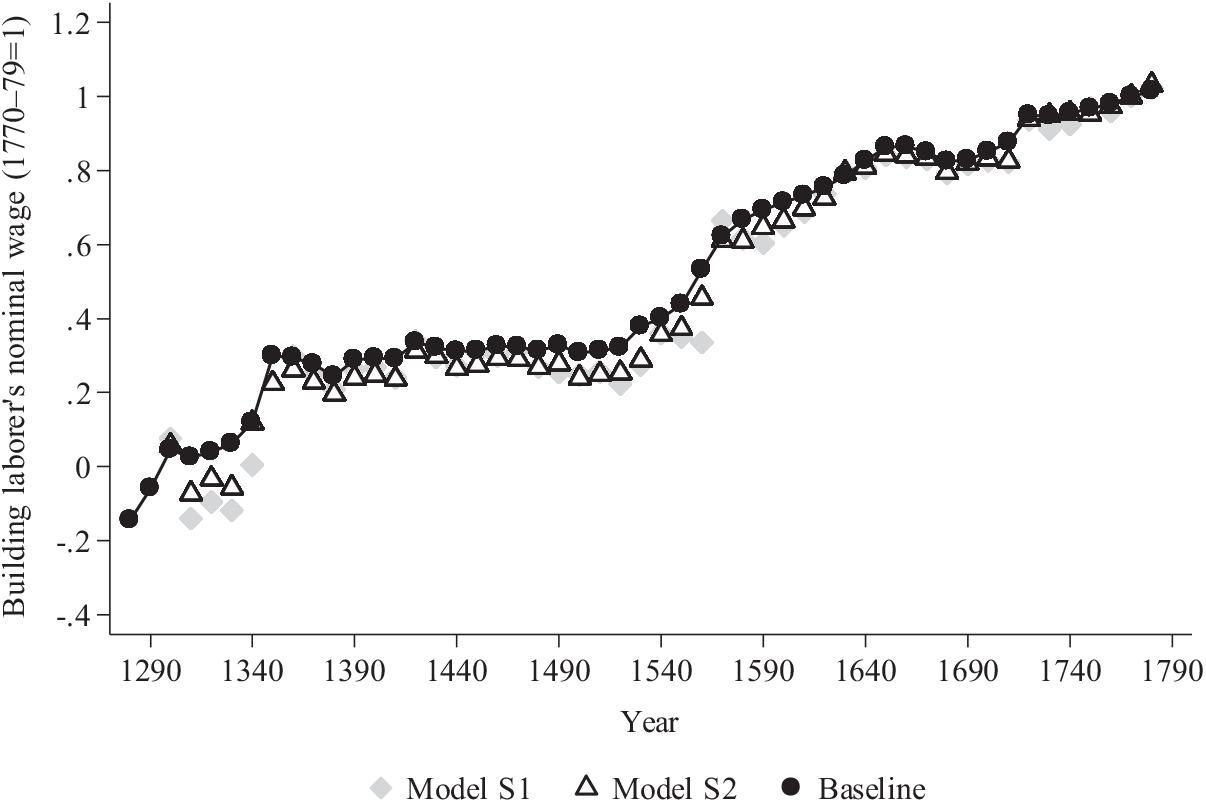
To test the consistency of this procedure, I re-estimate Equation (1) using two different sub-samples. The first is obtained by dropping the categories “mean” and “unknown” (Model S1), while the second excludes observations for which seasonality is not directly observed (Model S2). Figure 2 compares the predictions of Models S1 and S2 with the estimates obtained by fitting Equation (1) on the full sample (baseline model). These series all refer to not-nourished workers, setting the national average wage of a French helper mason paid in autumn as the base case.Footnote 29 Although the predictions of Models S1 and S2 are relatively more volatile, the overall trends match the predictions of the larger sample.
SEASONALITY: NOMINAL WAGES OF FRENCH BUILDING LABORERS

Furthermore, I check the consistency of the procedure to distinguish between “nourished” and “not-nourished” workers by fitting the benchmark regression model on the reduced sample of “not-nourished” workers (Model F1). Results reassuringly confirm that there are no significant differences between the baseline specification and Model F1 (Online Appendix S1, Figure S1.5). Finally, I explore the sensitivity of results to the unequal spatial distribution of the data by fitting a weighted regression model that assigns greater weight to observations that have less spatial coverage (Model W1). These weights indeed correspond to the inverse of the probability of an observation being selected into the sample and are calculated by taking the inverse of the sampling fraction in a certain decade. In addition, to control for differences in regional wage movements, I add an interaction term between period-dummies (an indicator for each of the 50-year intervals between 1250 and 1860), and a set of regional (Paris Basin, Center, East, North, South) and seasonal indicators (Model W2) to the basic specification. Inspection of Figure S1.10 in the Online Appendix S1 suggests that the predictions of models W1 and W2 are broadly consistent with the baseline specification.
PRICES: SOURCES AND METHODOLOGY
The price dataset includes around 46,600 quotes of 12 commodities, retrieved from a large set of printed primary and secondary sources. These data have been supplemented with new archival evidence from the account books of religious institutions, hospitals, and the records of several construction sites, which provide information on the price of bread, wine, and textile products.Footnote 30 Even if the price observations are unevenly distributed over time, the sample has wide spatial coverage with the Center and the South together supplying about 42 percent of the price data, followed by the East (31 percent), North (17 percent), and Paris district (10 percent).Footnote 31
I estimate the individual component price series of the consumer price indices for France and the Paris district using OLS regression models of the following form:Footnote 32
 $$\ln (p_{it} ) = \Sigma _i \alpha _i LOC_i + \Sigma _t \beta _t D_t + \Sigma _k \gamma _k DTYPE_k + \varepsilon _{it^, }$$
(2)
where pit is the price of a certain item in location i and time t; LOCi is an indicator for location i; Dt is a year dummy; DTYPE is a set of indicators that control for differences in the typology of source, quality, and the unit of measurement of individual commodities. I introduce these controls because ceteris paribus, both the quality of the product and the measuring unit can result in large price differences, even for the same good. Due to the dearth of direct evidence, I estimate the price of bread using Allen’s (Reference Allen2001) bread equation and follow an analogous procedure to derive meat prices (Online Appendix S2, Table S2.2). Finally, I deflate nominal wages using a Laspeyres consumer price index whose weights reflect the quantities consumed per person per year as originally proposed by Allen (Reference Allen2001).
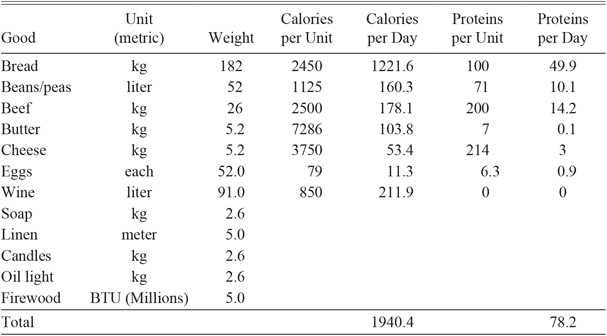
The consumption bundle provides 1,940 calories per day, sufficient proteins, and includes some expenditure on lighting, lodging, and clothing (Table 1). This weighting scheme represents a reasonable starting point to facilitate the international comparability of the series. However, in the Online Appendix S2, I depart from the benchmark index. Based on an examination of 116 French consumption baskets for the period 1343–1787 and a set of nineteenth century consumption bundles, I show the robustness of this specification to changes in the formula and weights used for construction (Online Appendix S2, Figure S2.3).

Figure 3 displays the evolution of consumption prices in France and the Paris district and compares their evolution with Allen’s (Reference Allen2001) index for Paris. Overall, my series implies a slightly higher level of prices in Paris. This difference can be ascribed to the fact that several prices Allen relies on come from Strasbourg, while the data used in this study are drawn from the account books of Parisian religious institutions and hospitals.Footnote 33 Nevertheless, the series predict similar trend improvements. Overall, consumption price evolution in France is characterized by a typical U-shaped trend between the 1340s and 1420s and two successive waves of long-run inflation between c.1500–1650 and by the beginning of 1700.Footnote 34 However, prices in Paris grew faster than in the rest of the country by the 1550s. Consumption prices increased fourfold in France but almost sevenfold in Paris.
CONSUMER PRICE INDICES (1770-79=1): FRANCE AND THE PARIS DISTRICT

THE LONG-RUN EVOLUTION OF WELFARE RATIOS IN FRANCE
Following Allen (Reference Allen2001), nominal wages and prices are used to construct welfare ratios by dividing the annual income of a notional family of four components (woman, man, and two children) by the cost of maintaining it.Footnote 35 Computations rest on the assumptions that the adult male worked 250 days per year and no other member of the family earned income. Total expenses are set equal to 3.15 times the price of the basket of goods to include a housing cost of 5 percent of total expenditure and support the entire family at the same standard of living as the male breadwinner.Footnote 36
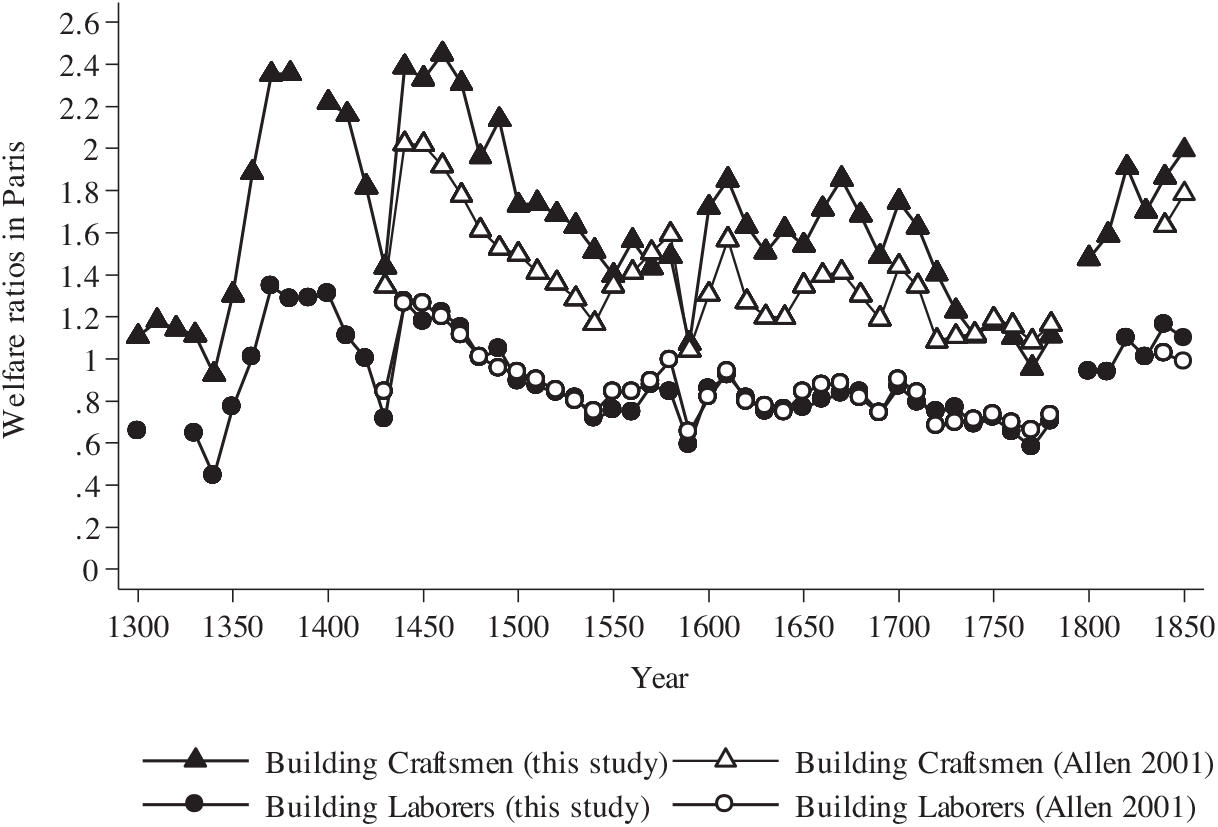
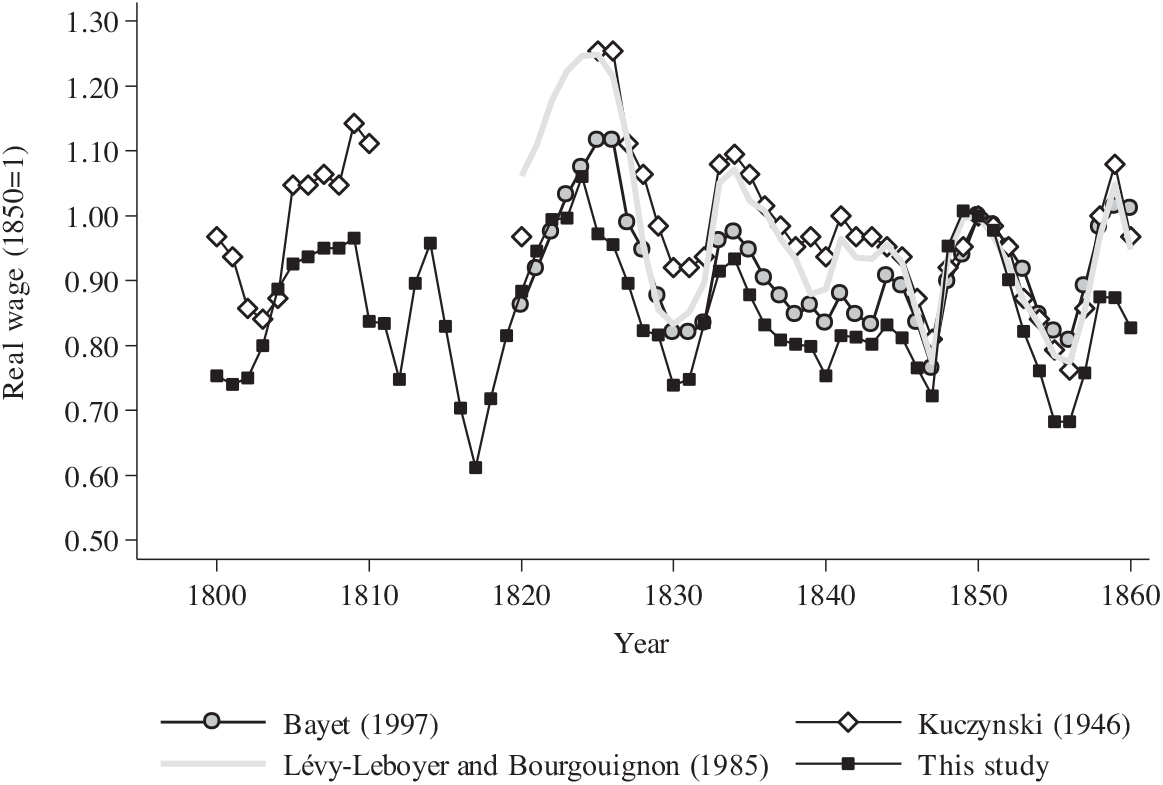
Figure 4 compares the welfare ratios of Paris building craftsmen and Paris building laborers with analogous series from Allen (Reference Allen2001). This comparison shows my series tracks Allen’s (Reference Allen2001) Paris welfare ratios closely when they overlap, even if Allen’s series implies slightly higher living standards for building laborers, reflecting the differences in consumption prices mentioned earlier. In contrast, my series predicts higher welfare ratios for Parisian craftsmen. The source of this deviation lies in the evolution of the skill premium in Paris before 1726. According to Allen, mason’s wages were 60 percent above Micheline Baulant’s (Reference Baulant1971) series of building laborers prior to 1726. In contrast, I found the wage differential between skilled and unskilled construction workers approached 100 percent during the fourteenth and sixteenth centuries (Baulant 1976, p. 980) but fell to 67 percent in the eighteenth century (Baulant Reference Baulant1971, pp. 480–81).Footnote 37 Baulant’s (Reference Baulant1971) series of building laborers is modified accordingly and these data have been used to integrate the direct evidence on building craftsmen’s wages. In the case of France, there are no series spanning the entire period that is considered in this study. Accordingly, comparisons are only possible since the nineteenth century when the first estimates of industrial workers’ real wages become available. Figure 5 shows that my series of building laborers’ wages tracks closely with the indices of Bayet (Reference Alain1997), Lévy-Leboyer and Bourguignon (Reference Lévy-Leboyer and Bourguignon1985), and Kuczynski (Reference Kuczynski1946) during the nineteenth century. However, my index is more volatile because it assigns greater importance to bread, which has relatively more erratic prices.
WELFARE RATIO OF PARISIAN CONSTRUCTION WORKERS

FRENCH REAL WAGES: COMPARISON WITH PREVIOUS ESTIMATES

REAL WAGES IN PARIS AND LONDON, 1300–1860
So far, I have described the new series of real wages in the context of existing literature on French real wages without providing a characterization of the main trends. In this section, I compare the long-run evolution of real wages in Paris and London, while in the following section, I move on to consider England and France. Such comparisons are important for understanding to what extent the comparative real wage history of London and Paris matched analogous developments taking place at the country level.
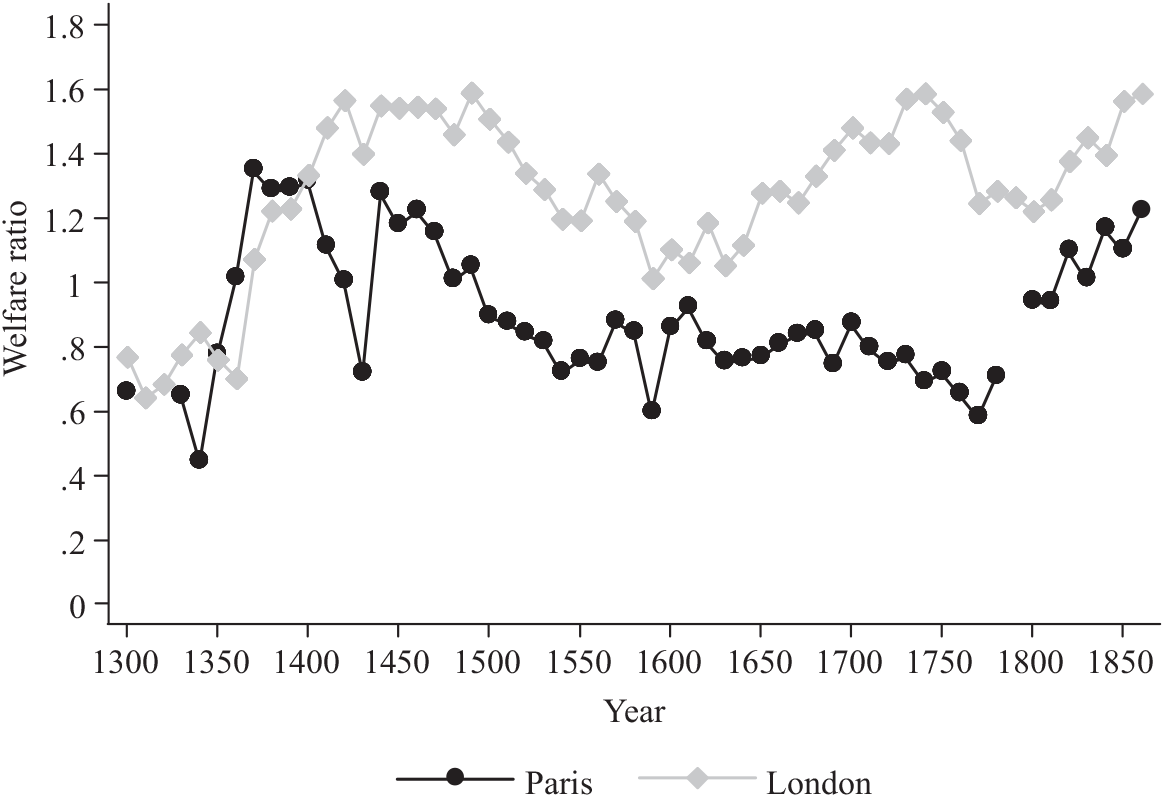
Figure 6 shows the welfare ratios of building laborers in Paris and London over the period 1300–1860.
WELFARE RATIOS OF BUILDING LABORERS IN PARIS AND LONDON

The substantive result emerging from this comparison is the almost steady trend of divergence between London and Paris welfare ratios dating back to the first decades of the fifteenth century when a large real wage gap first appeared. This trend anticipated by almost a half-century the well-known divergence in real wages between London and a wide set of southern European cities originally documented by Allen (Reference Allen2001). Internal conditions rather than factors peculiar to the international cycle of the construction industry were seemingly the source of the “precocious divergence” of real wages in Paris. The available evidence suggests that the declining trend in Paris welfare ratios was the result of the adverse combination of warfare and demographic factors. In Paris, unlike most European areas, the effects of the Black Death and its periodic visitations were compounded with the consequences of the Hundred Years’ War. Information from the account books of religious institutions indicates agricultural production saw a sharp decline during the three decades (les trois horribles) of greater political turmoil and military conflict (1410–1440), while prices increased dramatically after the monetary debasements of 1417, 1419, and 1420.Footnote 38 As daily wages adjusted only partially to prices, real wages in Paris fell rapidly between the 1410s and the 1440s. At the same time, London and the other leading European cities were experiencing the culmination of a process of real wage increases prompted by the Black Death. As a consequence, while the difference in real wages between Parisian and London building laborers was almost undetectable on the eve of the fourteenth century, by the 1430s London building laborers were already earning twice as much as their Parisian counterparts. When the conflict came to an end, real wages in Paris recovered part of the lost ground but never reverted to their pre-crisis levels, being, on average, about 50 percent lower than the levels prevailing in London between c.1450–1600.
By the early seventeenth century, the ratio between London and Paris welfare ratios widened dramatically and peaked in the 1740s at around 2.3:1. This trend primarily reflected the dynamism and growing diversification of London’s economy and the progressive consolidation of the capital as a high wage location in England (Allen 2015; Boulton Reference Boulton2000, p. 169). As the national government became more centralized, London established itself as the legal and financial center of the country, increasingly benefiting from its proximity to Westminster (Rappaport Reference Rappaport2002, p. 119). Furthermore, by the sixteenth century, the expansion of manufacturing and new industries that produced for domestic rather than overseas markets offset the crisis of traditional sectors associated with the cloth export trade and the unemployment caused by the city’s demographic boom (Dietz Reference Dietz, Beier and Finlay1986). However, London’s standing contrasted with Paris, whose economy grew more around the needs of the state than from the development of trade and manufacturing and never enjoyed anything comparable to the internal stability of London (Sheppard Reference Sheppard1998, p. 145–6; Biraben and Blanchet Reference Biraben and Blanchet1998). This situation changed after the second half of the eighteenth century when the difference between the earnings of London and Parisian building laborers fell sharply due to the rise in Paris real wages between the French Revolution and the first Empire. Even so, in the first half of the nineteenth century, London building laborers still earned between 20 and 30 percent more than their Parisian counterparts, consistently with Allen’s (Reference Allen2001) estimations. Overall, if used as the basis for nation-wide conclusions, this city-level evidence can only reinforce the argument that has dominated recent literature, positing that English preeminence was built gradually and dated back to the early modern period (Allen Reference Allen2001; Broadberry Reference Broadberry2015).
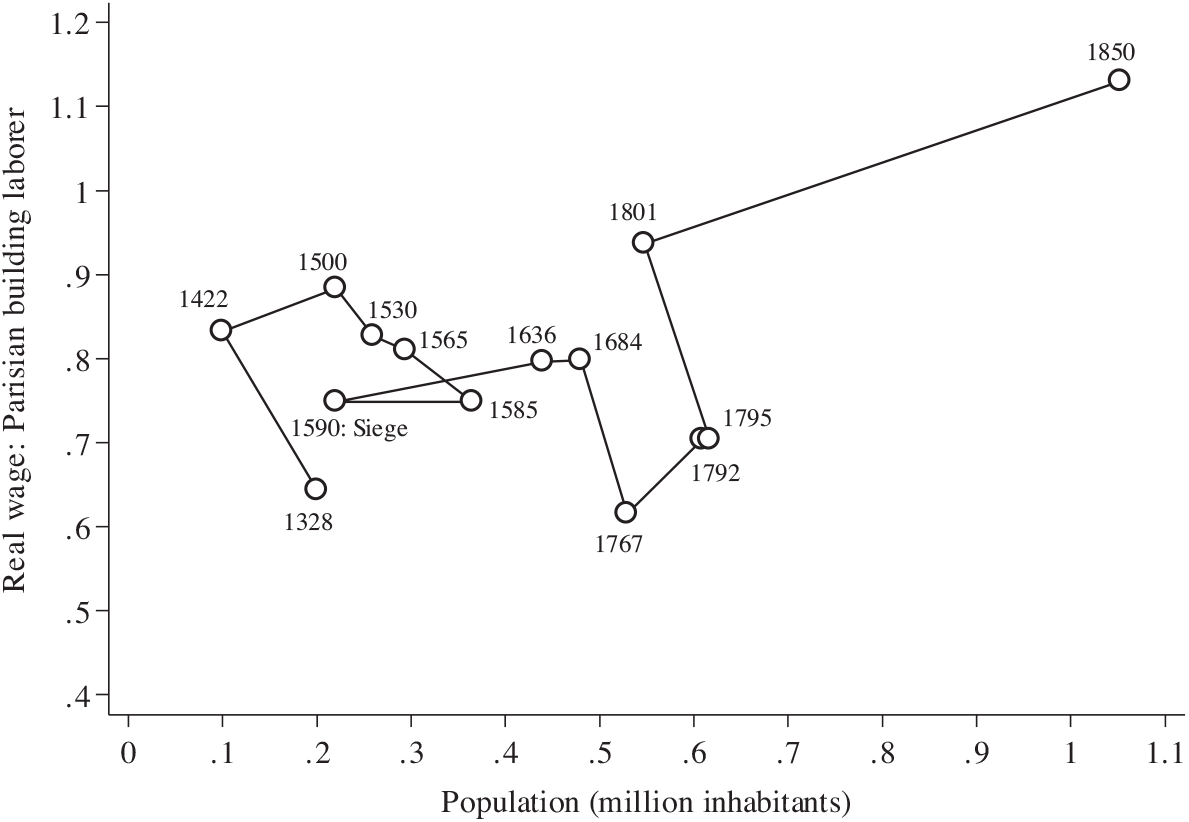
To understand the pattern of change in real wages in Paris, it is also convenient to examine some aspects of the demographic evolution that took place in this city and relate these changes to analogous developments occurring in London. The exact population of these cities is a matter of debate before the first nineteenth century censuses. In round figures, it appears that before 1500, population and real wages were characterized by a remarkably stable inverse relationship, which largely reflected the great demographic cycle fueled by the Black Death (Figures 7 and 8). Nevertheless, between 1500 and 1800, the experiences of Paris and London neatly diverged. Toward the end of the fifteenth century, the population of Paris returned to the level that prevailed before the demographic collapse of 1348, but witnessed rapid expansion thereafter. At the beginning of 1500, Paris had around 220,000 inhabitants, soaring to 400,000 inhabitants before the great siege of 1590–1592, reaching perhaps 500,000 inhabitants toward the end of the seventeenth century, and about 600,000 on the eve of the French Revolution. The rapid growth of the Parisian population (approximately 170 percent over the period 1500–1792) was paralleled by a prolonged phase of real wage decline (about 20 percent).Footnote 39 Overcrowding effects and excess labor supply are plausible candidates for explaining the decrease in real wages in Paris. The absence of homogeneous information on population density prevents any firm conclusion, but scattered evidence tentatively suggests that extremely low real wage values were reached during phases of rising population pressure, namely 1328, 1560–1570, and 1787–1788.Footnote 40
REAL WAGES AND POPULATION IN PARIS

This situation changed between 1792 and 1801, when the sharp rise in building workers’ earnings, fostered by the positive construction industry cycle (Potofski 2009) and the increasing and widespread scarcity of labor during the Consulate and the Empire (Chabert Reference Chabert1949), led to a radical shift in the relationship between population and real incomes.Footnote 41 From that period onward, real wages kept pace with population growth. This evidence suggests the Parisian economy’s growing diversification and the stimulus of public work in the construction industry could indeed assimilate the inflow of laborers to the capital without reducing workers’ living standards (Potofski 2009). On the other hand, with only about 50,000 inhabitants in the early sixteenth century, London was still a relatively small center compared to Paris. Despite that, in 1600 its population amounted to about 200,000 inhabitants, reached about 575,000 in 1700, and more than 1 million in 1801. Unlike Paris, in London the inverse relationship between real wages and population started to change in the seventeenth century when the rapid demographic expansion fueled by the city’s economic growth ran almost invariably parallel with rising real wages (Figure 8).
REAL WAGES AND POPULATION IN LONDON

REAL WAGES IN FRANCE AND ENGLAND, 1250–1860
In this section, I shift the focus from comparing Paris–London to comparing France–England. Building primarily on the price and nominal wage series estimated by Gregory Clark (Reference Clark2004, Reference Clark2005, Reference Clark2007), I construct new series of welfare ratios for building and agricultural laborers in England following the same procedure illustrated earlier for France.Footnote 42
Figure 9 shows the ratios of English to French welfare ratios of building and agricultural laborers in the form of decadal averages.
RATIO OF REAL WAGES BETWEEN ENGLISH AND FRENCH AGRICULTURAL AND BUILDING LABORERS

The comparison of English to French real wages reveals a sequence of convergence and divergence phases rather than the steady and almost continuous process of divergence featured in the London–Paris comparison. In addition, it suggests that England emerged as a high wage economy relative to France by the second half of the eighteenth century. Broadly speaking, it is possible to distinguish three distinct stages over the period 1250–1860 (Figure 9).
The first phase was characterized by the tendency of English real wages to converge to the French levels between the late thirteenth and first half of the fifteenth century. This trend gained momentum after 1348 when the real wages of English laborers almost doubled while those of their French counterparts experienced a much lower increase. This evidence calls for a deeper investigation.
Classic Malthusian dynamics, working through variations in labor supply, as well as “horsemen-effect” type mechanisms that more directly relate real wage changes to war and diseases via urbanization, cannot account for the evolution of per capita incomes in this phase.Footnote 43 Indeed, contrary to the predictions of these models, real wages in France did not shift to a higher equilibrium level but remained stagnant or even declined in spite of demographic contraction.Footnote 44 The fact that this particular form of evolution of real wages was not shared by other countries suggests that factors specific to France dominated in this phase.
There is a deeply ingrained tradition among historians of the Hundred Years’ War to play down the economic effects of war and political turmoil, stressing the episodic and intermittent nature of the conflict, its low impact on population as well as its unequal spread in French territory.Footnote 45 However, the behavior of real wages suggests the effects of war did more to shape the course of real incomes than most literature has previously assumed. Recent contributions have revealed that armed conflict was much more frequent than previously thought (Firnhaber-Baker Reference Firnhaber-Baker2010) and that major land wars had a long-run negative effect on the French economy. Philip Hoffmann (Reference Hoffman1996) has shown that total factor productivity fell by approximately 25 percent in the areas of France where fighting was more intense during the Wars of Religion and the Thirty Years’ War. This occurred because armed conflict destroyed capital, especially that invested in clearing land, which represented a large share of total investment in the pre-modern economy. In addition, when peasants fled from troops, they took refuge in cities, and this movement was a potent driver of urbanization in the long run (Dincecco and Onorato Reference Dincecco and Gaetano Onorato2016). Conflict could also provoke mortality crises (Weir Reference Weir, Walter and Schofield1989) and affect the distribution of population across space as well as the local dynamics of demand and supply of labor.Footnote 46 For instance, during the crisis of 1417–1418, waves of refugees flocked to Paris (Forquin 1964, p. 359) to find protection behind the city walls and the progressive inflow of migrants from outlying rural parishes emptied the latter and swelled the city’s population. It can be argued that these dynamics played a role in shaping the course of nominal wages and prices in this period. Furthermore, the exceptionally long duration of the conflict and its intermittent nature affected the timing and strength of real wage growth, which indeed was characterized by alternating peaks and troughs rather than by a steady trend of recovery.Footnote 47
The second phase covers the period 1450–1750. Figure 9 suggests that in this phase, the real wages of English laborers did not exhibit any clear trend of diverging from their French counterparts. Conversely, although on a smaller scale for both duration and intensity, between the late sixteenth century and the eve of the French Revolution, the history of real wages in Europe is characterized by a second long cycle of growth and decline in which French real wages temporarily overtook the levels prevailing in England. The pattern of real wage growth and decline taking place between c.1550–1750 was the result of a series of mortality crises (famines and epidemics) and war-related shocks that unevenly affected the demography of various European countries.Footnote 48 In Germany, the effects on population of the Thirty Years’ War replicated, just in the modern era, the demographic collapse of the Black Death, transforming this country into the high wage economy of the seventeenth century (Online Appendix S3, Figure S3.2). In France and Northern Central Italy, these shocks seem to also have had a positive impact on the growth of real wages (Capasso and Malanima 2007, p. 27) but on a much lower scale. In the most affected regions of Northern and Eastern France (Cambrésis, Alsace), production witnessed a major slump between the 1630s–1660s, and population probably fell by as much as 20 percent. In contrast, as one moves to the Center and the South the effects of war are reduced (Le Roy Ladurie 1987, p. 309).Footnote 49 Despite these regional differences, the series of nominal daily wages had remarkably similar trends across space, which suggests that the evolution of real wages probably reflected a more general context of demographic decline.Footnote 50
The third phase, covering the period after the 1750s, saw the progressive emergence of a real wage gap between English and French laborers. By the second half of the eighteenth century, population growth gained momentum, prices increased, and the real wages of French building laborers declined until the end of the eighteenth century. Unlike France, the real wages of English laborers remained remarkably stable, attesting to the higher resilience of the English economy in the face of population growth. Over the same period, England began to diverge from other areas of Europe, like Germany (Online Appendix S3, Figure S3.2) and Northern Central Italy (Malanima Reference Malanima2013). The analysis of other economic indicators can help test the plausibility of these results.
For example, the evidence on urbanization rates, which are frequently used as a proxy for income per capita, supports the previous conclusion, suggesting England became more urbanized than France between the 1700s and the 1750s, approximately the same period that real wages of building laborers in England were overtaking those in France.Footnote 51 In addition, the cycles of physical stature in the eighteenth century seem to be quite consistent with the evolution of real wages illustrated earlier.Footnote 52 Even if the size of the height gap between England and France is hard to ascertain given the fragile data, the evidence on the stature of male convicts and army recruits suggests that the British were taller than the French on the eve of the French Revolution and this fact has recently been associated with the higher quality of the British labor force in terms of human and physical capital (Kelly, Mokyr, and Ó Gráda Reference Kelly, Mokyr and Gráda2014).Footnote 53
So far, I have assumed that the timing of the Little Divergence in real wages between England and France was not affected by the various assumptions used to construct the welfare ratios. However, the results (based on a standard of 250 days of work) ought to be revised if these countries experienced a significant increase in the number of days worked per year. To address this concern, I compare the evolution of real wages in France and England obtained by assuming a fixed working year with alternative scenarios that imply “industrious revolutions” of varying intensity. I estimate trends in the actual working year in France and England by relying on a set of independent estimations and a large sample of French building projects that recorded the weekly number of days worked per person for the period 1320–1644.Footnote 54 I find the results are robust to changes in the days worked per year (Online Appendix S3, Figure S3.3). Indeed, consistent with the previous findings, real wages of English building laborers started to diverge from those of their French counterparts after c.1750.Footnote 55 As shown in Figure S3.4 of the Online Appendix S3, the timing of the Little Divergence in real wages is also robust to variations in the structure of consumption derived from estimating an oats-based basket (Allen et al. Reference Allen, Bassino and Ma2011, Tab. 4, p. 21) instead of a bread-based one.
Malthusian Dynamics in France and England
The different character of economic and demographic development between France and England has spawned a long tradition of comparative analysis. Anthony Wrigley and Roger Schofield (Reference Wrigley and Schofield1981) were among the first to emphasize these differences, distinguishing between a high-pressure Malthusian regime for France and the low pressure equilibrium prevailing in England. Thus, whereas French mortality rates were very sensitive to income movements (strong positive check) and fertility mechanisms were relatively ineffective (weak preventive check), in England, adjustments to equilibrium through fertility prevailed (strong preventive check) over mortality-driven mechanisms due to the lower elasticity of mortality to per capita incomes (weak positive check). These differences imply that, in equilibrium, population densities were higher in France than in England, while the reverse was true for wages. However, subsequent research has questioned this view. In particular, David Weir (Reference Weir1984) has shown that France did not conform to a high-pressure Malthusian regime because the preventive check in France was even more effective than in England, while the sensitivity of mortality to price changes was greater in France only prior to 1740.
A full analysis of these dynamics is beyond the scope of this study. However, using the newly constructed series of welfare ratios, in what follows, I highlight some of the differences between France and England in economic and demographic developments. I accomplish this in two ways.
First, I concentrate on a brief characterization of one of the basic tenets of the Malthusian model, namely the relationship between real wages and population. Figure 10a shows the evolution of the relationship from regressing the logarithm of the real wages on the log of population using a locally weighted scatter plot smoothing (LOWESS). I fit this regression starting with the period 1250–1550 and then sequentially expand the sample by adding 10-year windows until full coverage is reached (1250–1860).Footnote 56 Although this exercise admittedly provides only a partial guide to interpreting Malthusian dynamics, it allows me to introduce a simple characterization of the changing relationship between the new series of real wages and population over time. Now the scatter plot summarizing the trade-off between real wages and population for the period 1250–1550 points to an inverse relationship between the two variables, consistent with the Malthusian model’s prediction. Nevertheless, the scatter-plot is relatively flat for high values of real wages because real labor earnings stagnated in spite of the falling population during the 1370s–1450s. In addition, the scatter points for the periods 1250–1560, 1250–1570 up to 1250–1610 become more negatively sloped, suggesting that the structural features of the Malthusian relationship were still present in this phase. However, as the sample is progressively expanded to incorporate the decades after 1610, the scatters summarizing the trade-off tend to become flatter. This occurs because real wages show little sign of any trend while population almost doubles between the 1620s and the 1860s. However, this evolution was gradual and took place in two phases. The first, which occurred between the 1620s and 1790, was characterized by a slow “de-linking” of the relationship between real wages and population because per capita incomes remained roughly stable while population increased by around 37 percent. Nevertheless, population was still an important factor in determining real wage changes in this phase.Footnote 57
A clear break in the relationship occurred only after the 1790s, when the flattening of the curve proceeded at a faster pace because real wage increases kept pace with population growth.Footnote 58 In contrast, in England, the trade-off between real wages and population was characterized by a remarkably stable inverse correlation until the mid-sixteenth century and by a steady “flattening” of the pre-1550 relationship in the subsequent period (Figure 10b). This pattern can be interpreted as evidence of an expansion of labor demand possibly related to the growth of the state, proto-industrial sectors, and international trade (Allen Reference Allen2009a, chap. 5).Footnote 59
EVOLUTION OF THE TRADE-OFF BETWEEN REAL WAGES AND POPULATION: FRANCE (A) AND ENGLAND (B)

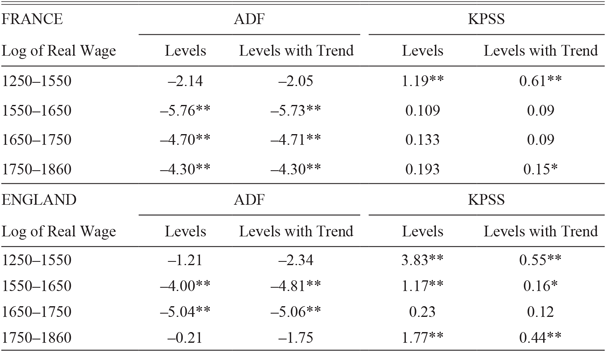
Second, I examine the statistical properties of the time series of real wages using formal unit root and stationarity tests which can provide a summary indication of the effectiveness of Malthusian checks over a certain period.Footnote 60 In a Malthusian economy, one should observe a tendency of real wages to revert to their long-run equilibrium level after a shock. In other terms, real wages should be stationary because there are checks to population growth working through variations in fertility (preventive check) and mortality (positive check) rates, which counteract deviations of real wages from equilibrium. On the contrary, if the series are non-stationary, shocks have a permanent effect on real wages and these could move away from equilibrium for a long period. This suggests the adjustment mechanism based on purely demographic forces (Malthusian checks) is weak and other forces exist that tend to favor deviations of real wage from equilibrium. These can include technological change, exogenous shocks to labor demand related to war and political instability, and the expansion of international trade. To analyze the statistical properties of the time series of real wages I use two tests: the augmented Dickey-Fueller (ADF) test and the Kwiatkowski-Phillips-Schmidt-Shin (KPSS) test. The former tests the null hypothesis that the time series has a unit root, while the latter tests the null hypothesis of stationarity of the series. Based on the test statistics of the ADF test, the null hypothesis of a unit root in the series of real wages of French building laborers is rejected both in level and in level with trend for various sub-periods (Table 2).Footnote 61 The results of the KPSS test lead to similar conclusions. Consistent with Weir’s (Reference Weir1984) argument, this evidence suggests the presence of strong preventive and positive checks, lending support to the Malthusian interpretation that shocks do not have permanent effects on French real wages. Conversely, the results of the ADF test reject the null hypothesis of a unit root in the series of English building laborers between the early modern period and the first half of the eighteenth century.Footnote 62 However, the test statistics of the ADF and KPSS tests clearly point to the non-stationarity of the series of real wages in levels and in levels with trend by c.1750 (Table 2).Footnote 63 This evidence suggests that the endogenous adjustment of population to real wages in England had been significantly weakened by the eighteenth century.Footnote 64
UNIT ROOT AND STATIONARITY TESTS OF REAL WAGE

Notes: Tests are performed on the real wages of building laborers. The optimal lag length of the ADF test is chosen on the basis of the Akaike information criterion, while for the KPSS the maximum lag Schwert criterion is used.
** p<0.01,
* p<0.05.
Sources: See notes to Figure 9.
REASSESSING REAL WAGE DIVERGENCE: LONDON–PARIS vs ENGLAND–FRANCE
The previous sections have provided contrasting accounts of the so-called “Little Divergence” in real wages, pointing to a late medieval real wage divergence between London and Paris and a late modern divergence between England and France. Fundamental differences in the real wage change patterns between Paris–France and London–England are behind this contrasting evidence. Table 3 explores these differences by considering a simple measure of real wage divergence, namely the difference in the growth rate of real wages between London–England and Paris–France over various sub-periods (figures in bold). In addition, I identify which variable, between wages and prices, was the main driver of divergence in the various sub-periods (figures in italics), and report the relative contribution of nominal wages and prices to the rate of divergence between London–Paris and England–France.

Prior to the 1750s, the growth rate in Paris welfare ratios was lower than in the rest of the country, mostly as a result of the faster increase in consumption prices (Table 3). Conversely, between the late fifteenth century and the first half of the eighteenth centuries, London real wages diverged from the rest of the country at the average rate of 0,12 percentage points per year. In this phase, the main driver of real wage divergence was the greater dynamism of London nominal wages (Table 3). These trends reversed by the second half of the eighteenth century. The growth rate of Paris welfare ratios outperformed the progress realized in the rest of the country and Paris started to emerge as France’s high wage area. The pace of real wage divergence between Paris and France proceeded at the rate of 0,28 percent per year over the period 1750–1789 and accelerated to 0,87 percent per year between the 1780s and 1840s due to the rapid increase in Paris nominal wages (Table 3). Clearly, Parisian construction workers benefited the most from the various urban plans of public spending implemented during the Revolution and Empire. In contrast, by the second half of the eighteenth century, the real wages of English laborers converged upwards towards the London standard (Allen Reference Allen2015). It is useful to distinguish two distinct stages in this process. In the first phase (1750–1789), the main source of convergence, explaining more than 80 percent of the overall variation, was the spectacular increase in English nominal wages relative to London. Underlying this tendency were key developments taking place at lower levels of aggregation by c.1750. In particular, England witnessed a reversal in the geography of English nominal wages between the 1760s and 1790s that resulted in the North and Midlands emerging as relatively high wage areas sustained by the growing dynamism of their expanding industrial regions (Hunt Reference Hunt1986). In contrast, real wages in London and the South declined compared to the earlier period because wages did not keep pace with rising inflation (Allen Reference Allen2015; Clark Reference Clark2001). Thus, it appears as if the rise of a new English growth pole centered on the north and midlands offset the downward pressure on real wages of rising population which characterized much of the rest of the country and ultimately prevented English real wages from falling (Rule Reference Rule2014, p. 176).
Sustained by the rapid increase in English nominal wages, the process of real wage convergence between London and England proceeded at an even faster pace (0,49 percent per year) after the 1790s. However, in this phase, the main factor accounting for real wage convergence was faster growing prices in London than in the rest of the country (Table 3).
Hence, while past commentators have traditionally focused on the much greater dynamism of London compared to the rest of the country to question the use of London real wages as the basis for nation-wide conclusions (Humphries Reference Humphries2010, Malanima Reference Malanima2013), I offer a broader perspective that delves into the complex relationship between capital cities and countries.
One important implication of the comparison of wages relative to the cost of living is that city-level, national-level, and sectoral comparisons provide contrasting accounts of the notion of England as a high wage economy.Footnote 65 The real wages of London building laborers stood out from those in Paris prior to the Industrial Revolution. In 1600–1649, these were already around 30 percent higher than in Paris, peaking at almost 100 percent in 1700–1749, then sagging to about 30 percent again in 1800–1849. Moving outside London, the situation was different. The building laborers of Southern England, whose standards of living were the highest in the country next to London, did not earn more than their French counterparts before the early eighteenth century. However, in the ensuing decades, their real earnings jumped about 20 percent above the levels prevailing in France. Overall, English building laborers fared even worse in relative terms. Before 1750, their real wages were similar to French real wages, slowly advanced in the second half of the eighteenth century, and in the last decades of 1700 peaked at around 20 percent above the French standard. At the same time, the “political arithmetician,” Arthur Young (Reference Young1792, vol. 2, pp. 436–7), concluded that English laborers’ standard of living was about 30 percent higher than that of French laborers. In the post-revolutionary phase, the real wage differential fluctuated widely but English real wages definitively forged ahead of France only in the second quarter of the nineteenth century, when the gap soared to more than 50 percent, consistent with Allen’s (Reference Allen2015, p. 10) benchmark estimation for 1833 (Figure 9).
Since pre-industrial economies were mostly rural, the evolution of real wages of construction workers was potentially not representative of national trends, and the experiences of other workers should also be considered. Agricultural laborers constitute a sensible comparator since they were the largest single occupational grouping in these countries (Humphries Reference Humphries2010). This exercise suggests the real wages of English agricultural laborers rose slightly above the levels prevailing in France only after the 1820s.
CONCLUSION
Much of our current understanding of the evolution of living standards in the pre-industrial period has been informed by the notion of a divergence in real wages between northwestern Europe (England and Holland) and the rest of the continent beginning around 1500. The empirical foundation of this argument lies in the study of a large sample of leading European cities, but the actual significance of this long-term trend beyond the experience of these leading urban economies is still largely unexplored. Using a novel dataset of prices and wages, and newly constructed series of real wages for male agricultural laborers and construction workers in France and the Paris district, I re-assess this argument by systematically comparing real wages in Paris–London and France–England over the period 1250–1860. The analysis highlights three main issues.
First, I show that at the country-level, the overall picture is evidently more complex than an early modern London–Paris divergence thesis would suggest. While real wages in London started to diverge from those in Paris by the first half of the fifteenth century, the comparative real wage history between England and France is characterized by the coexistence of both divergence and convergence phases with no unambiguous tendency between the two prevailing before the second half of the eighteenth century. Thus, at least for England and France, one might put forward a three-stage account with a long phase of real wage convergence between the 1250s and the 1400s where English real wages converged upwards to the French level; a second period spanning from the mid-fifteenth to the first half of the eighteenth century, during which the real wage differential between England and France fluctuated without trend; and a last period beginning c.1750 where English laborers’ real wages overtook those of their French counterparts. I show this contrasting evidence can be interpreted by looking at the different evolution of real wages in the capital city and the rest of the country in both France and England. Thus, London started to diverge from England by the late fifteenth century, while Paris emerged as a high wage area of France only after the French Revolution.
Compared to the national economy, urban economies were usually more sensitive to boom and growth reversals, especially in sectors characterized by high seasonality like the construction industry, where the demand for work varied widely over time and across space. The ties with international trade, finance, and government provide London real wages with a dynamism quite different from the rest of the country while the effects (positive or negative) of major institutional shocks, like the Hundred Years’ War and the French Revolution, were larger in the Paris district than in the rest of the economy because these were unevenly distributed over the French territory. These differences suggest that the experiences of individual cities constitute a poor testing ground for assessing the timing and causes of the Little Divergence in real wages.
Second, the results of this study have relevance for the characterization of England as a high wage economy. One important argument of Allen’s thesis is that before the Industrial Revolution, British wages were higher than French wages both at the exchange rates and relative to the cost of living, price of capital, and cost of energy (Allen Reference Allen2009b). Using the newly-constructed national series, I explore the first two dimensions along which English and French wages can be compared. I find that at the exchange rates, French wages were low relative to the English standard. However, since the lower wages earned by French workers in the eighteenth century were matched by low consumption prices, it appears that real wages of agricultural and building laborers in England were not higher than the levels prevailing in France before 1750. In this respect, while further research should be addressed to compare the relative living standards of other occupational groups (textile workers, workers employed on annual contracts) in France and England, these results provide suggestive evidence that still on the eve of the Industrial Revolution, a significant share of English male labor force did not participate in the high wage economy.
Third, this article contributes to the debate on the sources of real wage divergence. While most research has stressed demographic factors to account for the long-run evolution of real wages in pre-industrial Europe, the pattern of change in French real wages indicates the combination of institutional factors (warfare, political turmoil, debasement) and broad demographic trends could have had a long-lasting effect on French living standards. Specifically, during the worst stages of the Hundred Years’ War, real wages in Paris plunged. This fall initiated a long phase of decline relative to London and the Northern core, which anticipated by several decades the analogous divergence between northwestern and southern European cities. Similarly, during the most intense stages of the Hundred Years’ War, there was rapid convergence of English real wages upward to the French standards. These results are consistent with Hoffman’s (Reference Hoffman1996) argument, according to which warfare and political turmoil had a long-run negative impact on the French economy.