Introduction
Currently the availability of numerous, almost weekly, satellite high resolution images along with the trend of dense UAV data acquisition over different crop fields, form huge imaging datasets that can significantly contribute to timely optimal decisions for crop management and selective harvesting. In order to collect manage, process and analyze huge data streams a paradigm shift is required from per-image, per-acquisition, per-modality processing in a single desktop environment to a cloud-based, all available data processing and fusion infrastructure (Janssen et al., Reference Janssen, Porter, Moore, Athanasiadis, Foster, Jones and Antle2016; Karmas et al., Reference Karmas, Tzotsos and Karantzalos2016; Lokers et al., Reference Lokers, Knapen, Janssen, Randen and Jansen2016). In particular, through automated processing pipelines, after the required geometric and radiometric data calibration, these remote sensing big-data files are usually ingested in geospatial big data frameworks such as Rasdaman, MrGeo, Hadoop-based systems, etc. (Karmas et al., Reference Karmas, Tzotsos and Karantzalos2016). Under such a framework, all these datasets can be processed and analyzed on the fly, on the server-side with the same processing pipelines towards the creation of value-added maps, which indicate and describe in-field variabilities and quantitative information regarding various key agronomic parameters (e.g., LAI, canopy greenness, etc.).
Such a multitemporal analysis and mapping is crucial since the pattern of in-field variability across the crop growth cycle is fundamental for accurate diagnosis of crop condition and relative predictions (Bégué et al., Reference Bégué, Todoroff and Pater2008). Apart from the mapping products, time series observations, including current and historical data over a certain area of interest (e.g. a single crop parcel) offer, in addition, another layer of critical information for decision making. By fusing data from different modalities, one can directly compare all derived products and layers of information for crop, weed management and selective harvesting (Thorp and Tian, Reference Thorp and Tian2004; Wagner and Hank, Reference Wagner and Hank2013).
To this end, highly scalable platforms capable of handling and analyzing, in near real-time, diverse remote sensing information for precision agriculture applications are currently required. In this context, the main objective of this work was to expand the RemoteAgri WebGIS system (Karantzalos et al., Reference Karantzalos, Karmas and Tzotsos2015; Karmas and Karantzalos, Reference Karmas and Karantzalos2016), through the development of new processing modules and the integration of distributed analytical frameworks. The main contributions involve the (i) updating of the underlying architecture and (ii) implementation of new geospatial services for seasonality mapping and combined time series analysis.
In particular, the framework integrates numerous multitemporal satellite and UAV datasets over different crop fields and across the entire crop growth cycle. Several transparently interconnected software modules are responsible for the orchestration of the different image processing algorithms during both data preprocessing (i.e., radiometric, atmospheric, geometric, corrections, etc.) as well as data analysis (i.e., vegetation, detection, classification, indices, LAI, canopy greenness, etc.). More importantly, through RemoteAgri, due to the efficient parallel processing capabilities and multitemporal datasets, one can create multitemporal maps for monitoring continuously the crop growth cycle through seasonality mapping and time-series observations over selected regions of interest. Finally and importantly, these time series observations can cover not only just single annual periods but also e.g., the past five crop growth cycles, offering valuable information by linking weather statistical data with the start, the end and the duration of each growth cycle enabling critical decisions by direct comparison with the current crop growth state.
Methodology
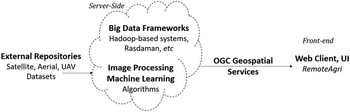
The effort in the present study extends the RemoteAgri WebGIS system and moves it another step forward. Various components and processing steps are involved in setting, running and utilizing the developed system. RemoteAgri, currently, features a full modular distributed architecture, integrating Hadoop-based systems and Rasdaman, to allow for seamless integration in the processing pipeline of various software modules, algorithms and databases in order to facilitate high performance remote sensing data analysis. Such flexible architectural schemes are the most promising ones regarding the efficient tackling of geospatial big data handling and processing demands (Karmas et al., Reference Karmas, Tzotsos and Karantzalos2016).
The main components of the system are shown in Figure 1. The core functionality of the developed framework, consists of a distributed database, namely, the Rasdaman Array DBMS (Baumann, Reference Baumann2009) mainly utilized for the storage of the remote sensing data as well of a Hadoop-based system mostly used for the fast production of value-added maps covering very large areas of interest.
The main components of the RemoteAgri system, which is able to ingest remote sensing data from external repositories, handle and process them on the server-side upon a user request for a given AOI.

Rasdaman facilitates the quick retrieval of the processing datasets and enables fast time series analysis, as it is able to extract rapidly time series information and statistics from vast datasets. The Hadoop-based system forms a distributed filesystem that allows for rapid processing and on the fly, on the server side analysis of the stored datasets for performing numerous calculation across a multitemporal datasets e.g., max NDVI per pixel, per year, etc.
The system integrates multi-modal data from various EO open and commercial datasets of different spatial, spectral and temporal resolutions (e.g. Landsat, Sentinel, RapidEye, Pleiades, WorldView) and it also integrates data from UAV acquisitions. Several processing queries fuse these datasets with information extracted from time series analysis in order to formulate constrained remote sensing problems and thus achieve robust analytical capabilities that can aid in the monitoring of the vegetation’s growth cycle towards providing support for the effective managerial decision-making according to the crops’ state. Moreover, the system in its current version integrates publicly available weather statistical data, which are used in correlation with the remote sensing data to guarantee more accurate and safer inferences regarding the actual crop state.
Certain data processing and machine learning software modules, exploiting multi-spectral imaging of various spatial resolutions, have been developed. In particular, the main services that have been developed and are currently provided by the system (Karantzalos et al., Reference Karantzalos, Karmas and Tzotsos2015) are the creation of color composites, the calculation of Band Ratios and Indices, the automated canopy greenness (green foliage density) estimation, LAI, etc., as well as seasonality mapping and time series analysis. These services utilize the stored datasets and OGC interface standards in order to derive remote sensing information and produce respective color maps as well as graph charts that hold this information. In particular, once a user of the system through the user interface (UI) indicates a specific area of interest (AOI) along with the particular product that is interesting in, the corresponding service (e.g., canopy greenness maps) is executed in the server-side while the produced map is served through standard OGC web services.
New Functionalities
The developed services, which have been implemented as separate software modules over Rasdaman database and Hadoop-based systems, are addressing important tasks like vegetation detection, seasonality mapping and time series analysis. In particular, the following fundamental services have been developed and validated in the developed system:
1) Vegetation Detection: Since the different Areas of Interest (AOIs) that the user can indicate for analysis (from single fields to broader agricultural areas) may contain areas with no vegetation or generally areas with arbitrary land cover, this service is responsible to classify a certain image into two classes i.e., vegetation and not vegetation through advanced supervised classification techniques.
2) Seasonality mapping: This service addresses the need for mapping key temporal characteristics during the crop growth cycle. RemoteAgri is capable of creating artificial color composites that pinpoint the specific Day of Year (DOY) for which a particular condition occurs for any given pixel of the stored remote sensing data. In the context of the present work, the main concern for seasonality mapping was to find the DOY for which the maximum value of NDVI (TCARI, MCARI, etc.) occurs for any given pixel of the stored images. The seasonality mapping Hadoop-based service’s value-added product is a cloud-free artificial color composite that provides the potential for seamless mosaicking when analysis of very large areas is concerned.
3) Time series: This particular service leverages RemoteAgri’s potential towards the accomplishment of time series analysis, as it is, capable of providing multitemporal information for any remote sensing index across the stored datasets. More specifically, the system is capable of calculating online and displaying in a time series chart multitemporal values of the NDVI index in a user-friendly and intuitive way. The system is also able to fuse information derived from different sensors in the same chart with the aim to provide dense remote sensing information regarding vegetation’s state. Moreover, for the same time-period the user can compare information from other open repositories like multitemporal weather data.
Both the Seasonality mapping and Time Series services can be calculated on all available datasets or a particular selected time-period. The availability is constrained mainly by the number of open or commercial remote sensing data that have been stored in the system and how cloudy a specific AOI was during the acquisitions.
Experimental Results and Evaluation
In order to validate the developed services, that feature multitemporal observations and time series analysis, several experiments in different agricultural areas of Greece were conducted. In the present section, certain experimental results are presented demonstrating the effectiveness of the developed system.
In particular, the derived time series graph from a selected vegetation index and its relation to the calculated canopy greenness maps as well as the corresponding weather data is discussed, towards quick and sound crop management decisions. Moreover, experimental results from the seasonality mapping service are presented. These results can add another layer of crucial information for optimal decision-making support in farm management and selective harvesting. The overall functionality and performance of the RemoteAgri platform along with some complementary material can be found here (http://users.ntua.gr/karank/Demos/RemoteAgri.html). Although, a quantitative performance evaluation is not provided in this paper the demo video sequences indicate the highly automated functionalities and the near real-time performance of the developed services.
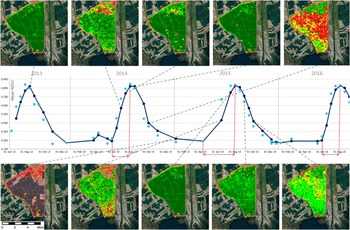
In Figure 2, results after the application of the developed time series service over an agricultural area near Chalastra, at Central Macedonia Region in Greece, are presented. The dominating crops that are cultivated in this region are rice, cotton and corn, with rice covering most of the parcels. Detecting the in-field and across the region spatial and temporal variability is crucial for managing rice paddy fields towards increased productivity and sustainability especially in such protected areas and valuable ecosystems. The AOI that was processed through RemoteAgri covers approximately 3,500 ha and demonstrates that the service can in near real-time, consistently provide time series information and other value-added products from numerous, high resolution, multitemporal remote sensing datasets.
The derived NDVI time series from all available satellite multispectral data over an agricultural area near Chalastra in Northern Greece. Season’s start and length can be observed (middle row) as well as the corresponding canopy greenness levels after the application of the developed geospatial services. With light dots represent the mean NDVI of the Areas of Interest (AOI) and with the dark blue the ones after the online, moving average curve fitting.

In Figure 2 (middle row), the derived NDVI time series from all available satellite data are shown. One can observe that the temporal pattern is approximately the same indicating that the same crops and practices have been cultivated and applied during the last 4 years. After a closer look one can observe the growing season’s start and length. For example, in 2015 the growing cycle started relative earlier and had also a longer length. The corresponding canopy greenness levels after the application of the developed geospatial services can also be extracted and compared with the information from the time series analysis and the online average curve fitting. Moreover, the canopy greenness maps are able to indicate the in-field variability and at the same time to offer a comparison across the entire agricultural region. In such a spatial scale (i.e., 10m–30m) and along with the information locally gathered by agronomists, government agencies, agricultural associations and agribusinesses, one can monitor crop growth and yield towards optimizing the consumption of field inputs and increasing both food quality and crop yield based on rationale and comprehensive decisions.
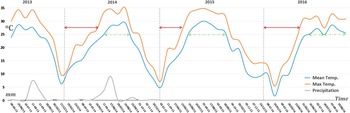
Moreover, this information can be fused with the available weather data (both historical and forecasted). In Figure 3, the historically derived multitemporal weather data indicating the mean/max air temperatures (in oC) and precipitation levels (in mm) are presented from a weather station near the Chalastra agricultural area of Figure 2.
Multitemporal weather data indicating the mean/max air temperatures (in oC) and precipitation levels (in mm) from a weather station near the agricultural area of Figure 2. The time intervals with air temperature above 25oC are shown with a dashed/green left-right arrow as well as the time intervals (with a solid/red left-right arrow) required for reaching 27oC from the beginning of the year.

The time intervals with air temperature above 25oC are shown with a dashed/green color left-right arrow. For example, during 2015 the time interval above 25oC reached a duration of almost 3 months and this is correlated and in agreement with the extended growth cycle duration that was observed in Figure 2. Moreover, one can observe in Figure 3 the time intervals (with solid/red color left-right arrow) required from the beginning of the year to reach 27oC. For example, years 2014 and 2016 follow approximately the same gradual increase in their pattern when compared with the more rapid 2015 one.
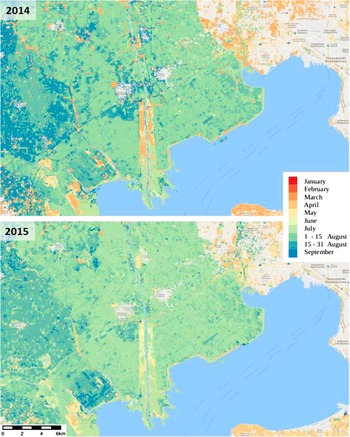
Another layer of crucial temporal information can be automatically derived from the developed seasonality mapping service. In Figure 4, two seasonality maps indicate the specific time (day) of year that NDVI reached its peak value. These maps have been calculated after processing on the server-side all the annual high-resolution multispectral data for 2014 and 2015.
Seasonality maps indicating the day of year (DOY) that NDVI reached its peak value are shown for 2014 and 2015 in an agricultural area near Thessaloniki in Northern Greece.

This is also an agricultural area near Thessaloniki in Northern Greece, which covers approximately a region of 1,200 sq. km. and contains in the lower left middle part the area of Figure 2. One can generally observe that the peak in all vegetation types occurred slightly earlier during 2014 than 2015. This is in accordance with the information derived from the weather data (Fig. 3) indicating that temperatures above 25oC had been reached relatively earlier in 2015. Moreover, in certain crop parcels the day of year has significantly changed, and this can indicate crop rotation, other management practices or land cover/use change. Such seasonal maps add another layer of crucial information towards optimal decisions for crop management and selective harvesting.
Conclusions
In this paper, the new functionalities of the RemoteAgri geospatial framework regarding the monitoring of crop growth through multitemporal observations, combined time series analysis and seasonality mapping services were presented. Powered by a fully modular distributed architecture allows for seamless integration in the processing pipeline of various software modules, algorithms and databases in order to facilitate high performance remote sensing data analysis. In its current version the developed services are addressing important tasks like the calculation of vegetation indices, vegetation detection, canopy greenness estimation, seasonality mapping as well as time series analysis towards improving crop yield estimation techniques and providing better support for critical crop managerial decisions.
By obtaining such information, agronomists are able to monitor seasonality, spot vegetation’s life cycle patterns, observe similarities/variances between different growth cycles and ultimately create vast amounts of historical data that can be used for the development of robust crop yield prediction models.