Introduction
The power amplifier (PA) is one of the essential components impacting the performance of transceiver chains, particularly in terms of linearity and energy efficiency. Its design has given rise to a variety of architectures (Doherty, LMBA, ...) and in the case of high-power radar or telecommunication applications, a classic multistage tree structure is usually considered.
PA modeling is an important research topic, especially with the generalization of active antenna array systems integrating tens or hundreds of power amplifier elements. With these new systems, the common circuit simulation tools, based on harmonic-balance (HB) or envelope-transient (ET) engines, often offer very limited capacity, due to prohibitive simulation cost and limited accuracy, especially with the large passive network modeling through electromagnetic analysis tools.
It becomes crucial to develop behavioral models that can effectively reproduce the nonlinear and dispersive effects of the PA within the high-power dynamics and large bandwidths targeted in these applications [Reference Wood and Root1–Reference Roblin, Root, Verspecht, Ko and Teyssier4]. Database necessary for derivation of the behavioral model can obtained either from circuit simulation or from physical measurements of the device, depending on the operational conditions. Of course, if conditions allow, a behavioral model closest to device response will be obtained from physical measurements of the device, to avoid circuit simulation accuracy limitations just mentioned. The behavioral model (usually termed system-level model) speeds up the system simulation by considering a system matrix reduced-order block-box modeling approach.
System-level models, historically limited to unidirectional block models, enable effective simulation of large systems at reasonable computational cost. Recently, some system-level simulation environments, such as the VISION™ system by AMCAD Engineering [5], offer extensions allowing integration of bidirectional models to account for load mismatch between blocks. The Volterra series based, Two-Path Memory (TPM) model [Reference Ngoya, Quindroit and Nébus6], developed at the University of Limoges, available in the VISION tool, has proved to be one very interesting model for the consideration of complex modulation signals in telecommunications and radar applications. However, the database necessary for the derivation of the model requires measurement of the device under continuous wave (CW) regime, from linear to saturation region, which can be problematic in the case of very high-power applications. Indeed, self-heating effects can lead to destruction of the PA during characterization. To try to overcome this problem, we investigate in this article a new model identification principle that requires PA characterizations under a pulsed RF regime.
In what follows, in Section 2, we briefly recall the structure of TPM model; it states the principle of differentiated identification of high-frequency (HF) and low-frequency (LF) memory paths of PA device, and notice its fundamental limitation. Section 3 introduces and evaluates the performance and limitations of the alternative approach to PA modeling, consisting of sensing the device output in the time domain with the pulsed RF signals, rather than in frequency domain with CW signals. Finally, Section 4 discusses the adaptation of the pulsed RF signal-based model into the TPM model structure, where it will be specialized for the processing of LF memory path only. The conclusion indicates the perspectives opened up by this work.
TPM model briefs
TPM principle
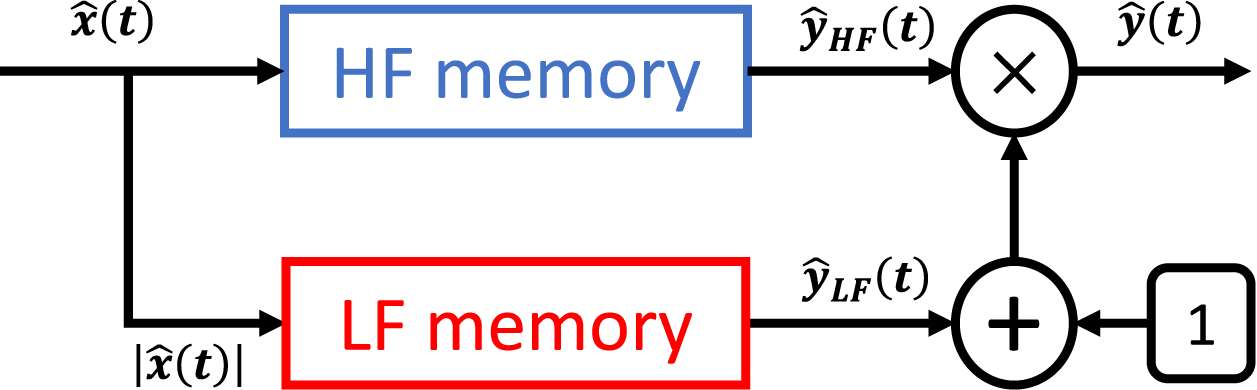
The TPM model is derived from Volterra series model simplifications [Reference Ngoya, Quindroit and Nébus6]; it is broadly based on a differentiated identification of nonlinear dynamics exhibiting short time constants to that exhibiting longer time constants. These are equivalently referred to as HF and LF memory effects. The HF memory effects grossly exhibit time constants in the order of the RF carrier period (e.g., due to RF group delay of transistor, frequency dispersions of filters and matching circuits, etc.), and conversely, LF memory effects exhibit time constants much higher, in the order of modulation signal speed (e.g., due to slow changes in transistor self-bias point, self-heating temperature conditions, electronic traps, etc.). The model block diagram is therefore as sketched in Fig. 1, where each memory path is represented by a different kernel.
TPM model topology.

To identify the TPM model, it is necessary to perform two series of device characterizations, in the frequency domain, using elemental CW signals. The first series of characterization is carried out by driving the device with a single-tone non-modulated CW carrier signal, i.e.,  $x(t)=X_0.\text{cos}(2\pi.f_0.t)$; it allows to identify the HF kernel of PA.
Then, a second characterization is carried out driving the device with a low-index modulated CW carrier signal, i.e.,  $x(t)=X_0.\text{cos}(2\pi.f_0.t)+\delta X.\text{cos}(2\pi.(f_0+\delta f).t+\delta \varphi)$; it allows to identify the LF kernel, as described [Reference Gapillout, Mazière, Ngoya and Mons7]. The response of each path in the model (HF and LF paths) expresses a Hammerstein model convolution integral:
 \begin{equation}
\hat{y}(t)=\hat{y}_{HF}(t).\left({1+\hat{y}_{LF}(t)}\right)
\end{equation}
 \begin{equation}
\hat{y}_{HF}(t)=\int_0^t h_{HF}(|{x(t-\tau})|,\tau).x(t-\tau)\; d\tau
\end{equation}
 \begin{equation}
\hat{y}_{LF}(t)=\int_0^t h_{LF}(|{x(t-\tau})|,\tau).x(t-\tau)\; d\tau
\end{equation}
Extraction of the TPM model consists, from the above measurements, in identifying the frequency domain, the two transfer functions  $H_{HF}(X_0,f)$ and
 $H_{LF}(X_0,f)$, corresponding respectively to Fourier transforms of the two time-domain kernels
 $h_{HF}(X_0,\tau)$ and
 $h_{LF}(X_0,\tau)$ in the above equations. To perform a complete characterization of the PA it is necessary to sweep the signal amplitude X 0 over the entire power operating range of the PA, from the linear to saturation region. Similarly, the carrier frequency f 0 as well as the modulation frequency
 $\delta f$ must be swept to cover operating bandwidth of the PA.
Fundamental limitation
As mentioned in the introduction, the TPM model has shown satisfactory modeling of RF PA response, regardless of the modulation signal used, both on narrowband and wideband applications. However, a structural limitation of TPM model arises from the fact that, as described above, the measurements necessary for model identification need to be carried out in the CW regime, from linear to saturation region. Indeed, in the case of high-power applications, self-heating of the PA can lead to its destruction in the saturation region. In the next section, we investigate the alternate approach based on PA characterization in the time domain, using pulsed RF excitation, offering the possibility for self-heating control by monitoring the pulse duration.
Time-domain approach: the non-linear impulse response model
Principle of the NIR model
The principle of PA modeling on the basis of time-domain pulsed RF measurements has already been adopted in the past, in several works, under the designation Nonlinear Impulse Response (NIR) model [Reference Soury, Ngoya and Nébus8–Reference Verspecht, Horn, Betts, Gunyan, Pollard, Gillease and Root10]. In this work, we re-evaluate the NIR principle, to investigate to what extent it could be useful in solving the fundamental limitation of TPM model indicated above.
Considering both the envelopes  $\hat{x}(t)$ and
 $\hat{y}(t)$ of the input and output signals to the PA, the simplest expression of NIR model is given by the convolution integral below:
 \begin{equation}
\hat{y}(t)=\int_0^\infty h(|{\hat{x}(t-\tau})|,f_{\hat{x}}(t-\tau),\tau).\hat{x}(t-\tau)\; d\tau
\end{equation}
 \begin{equation}
f_{\hat{x}}(t)=\frac{d\varphi_{\hat{x}}(t)}{dt}
\end{equation}
where  $|\hat{x}(t)|$ and
 $f_{\hat{x}}(t)$ are time-varying magnitude and instantaneous frequency of the input envelope signal, and the kernel
 $h(|\hat{x}|,f_{\hat{x}},\tau)$ stands for the nonlinear impulse response of the device [Reference Roblin, Root, Verspecht, Ko and Teyssier4]. For the sake of simplicity, we may neglect dependence on instantaneous frequency and impulse response reduces to a two-dimensional kernel in (6).
 \begin{equation}
\hat{y}(t)=\int_0^\infty h(|{\hat{x}(t-\tau})|,\tau).\hat{x}(t-\tau)\; d\tau
\end{equation}
Construction of the non-linear impulse response model
PA characterization principle
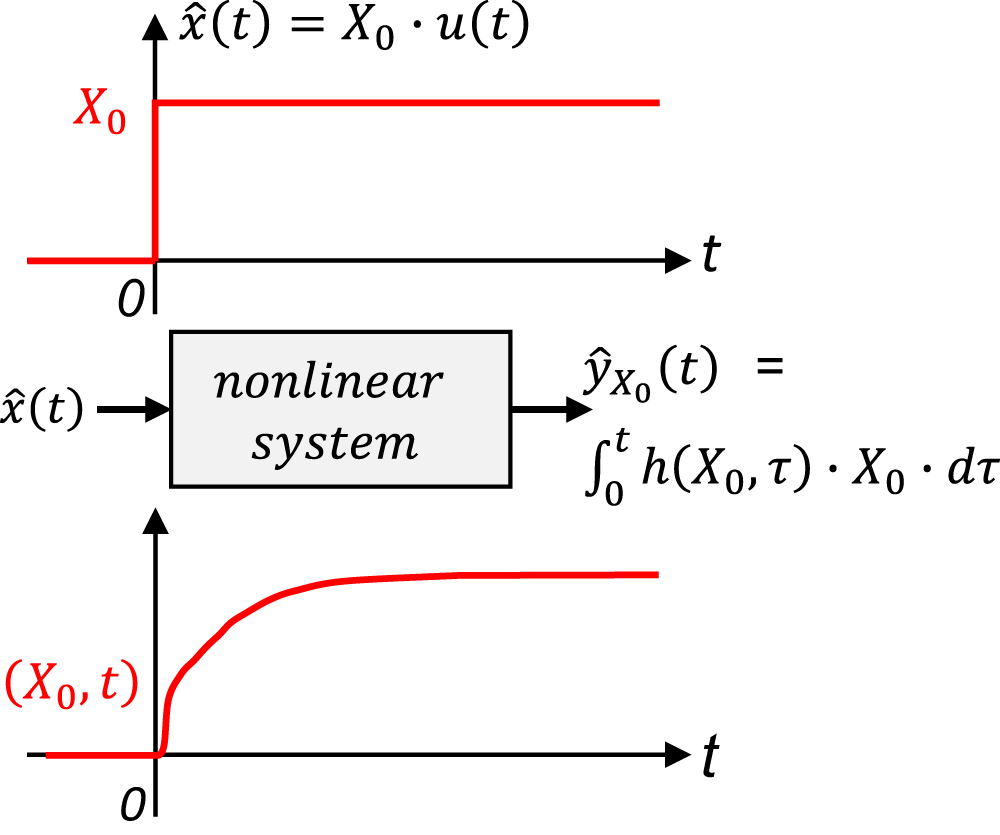
From the above equations, the optimal identification stimulus of the PA impulse response is easily determined as a unit time step function, as sketched in Fig. 2.
Characterization stimulus for NIR model identification.

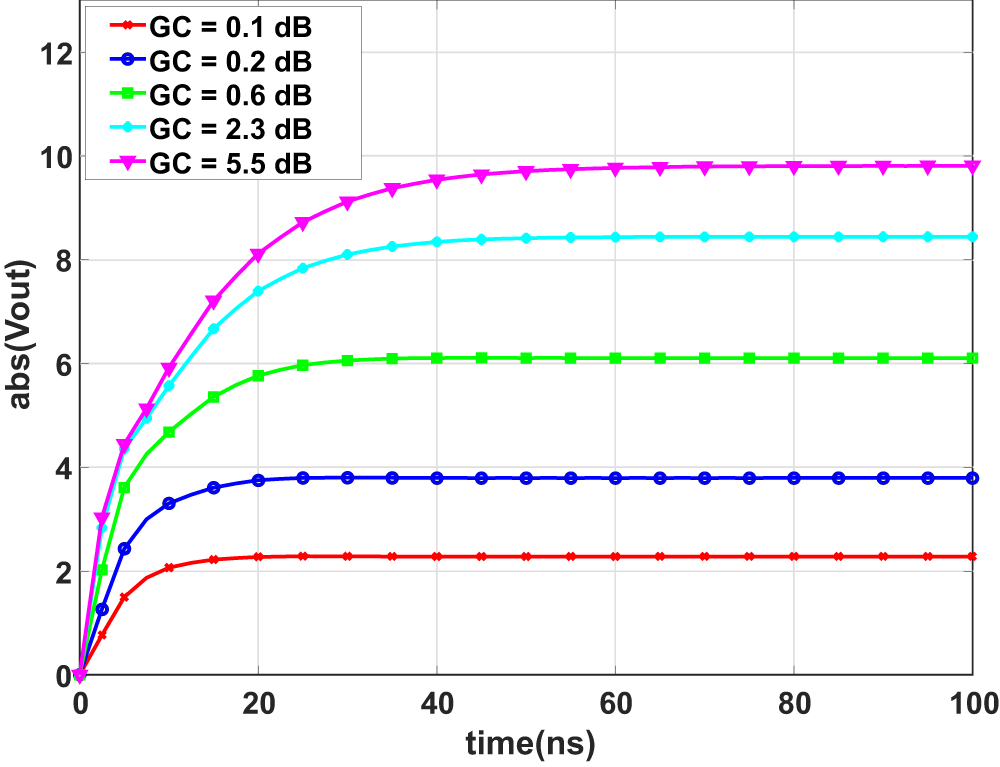
PA characterization for NIR model therefore requires driving the device with a series of unit step signals (RF pulses),  $X_0.\text{cos}(2\pi.f_0.t).u(t)$. For complete characterization, amplitude X 0 of the pulse is swept to cover the power operating range (linear to saturation region) of the PA. The corresponding step responses will then be used to identify the nonlinear impulse response. This type of characterization could be carried out in a measurement lab using an equipment like VST (Vector Signal Transceiver) incorporating a VSG (Vector Signal Generator) and a VSA (Vector Signal Analyzer) sharing the same local oscillator to ensure the phase coherence of the input-output signals. In this article focusing on the evaluation of theoretical principles, we will consider characterizing the PA only from the circuit simulation engine, using the circuit-envelope tool in the ADS simulator. For illustration purposes, we show in Fig. 3, the characteristics of a single-stage LDMOS PA, simulated with ADS circuit-envelope. We observe the step responses, for RF pulses applied at center frequency
 $f_0 = 830\, \text{MHz}$, of the PA. The four pulse amplitudes considered cover the PA operating region from 0.1 to 5.5 dB power Gain Compression (GC). We may observe from the time slopes of the step responses a shortest time-constant around 3 ns and a longest around 100 ns. It may be noted that, because the LDMOS transistor model did not consider electrothermal and trapping effects, the long-time-constant is only due to self-biasing effects.
Pulse responses of LDMOS PA (ADS circuit-envelope) at  $f_0 = 830\,\text{MHz}$.

Identifying the nonlinear impulse response
As defined in equation (6), the impulse response,  $h(X_0,t)$, of the PA is a function with two variables, amplitude, and integration time, contained in the convolutional integral giving rise to step response of the PA. There are different methodologies for identifying impulse response
 $h(X_0,t)$ from the step response
 $Y(X_0,t)$. Optimal methodologies, minimizing the impact of inevitable measurement errors ensuring good numerical stability to the model, assume that response
 $Y(X_0,t)$ can be expanded into a series of separable basis functions in the dimensions X 0 andt. Thus,
 \begin{equation}
h(X_0,t)=\sum_{k=1}^K S_k.\alpha_k(X_0).\beta_k(t)
\end{equation}
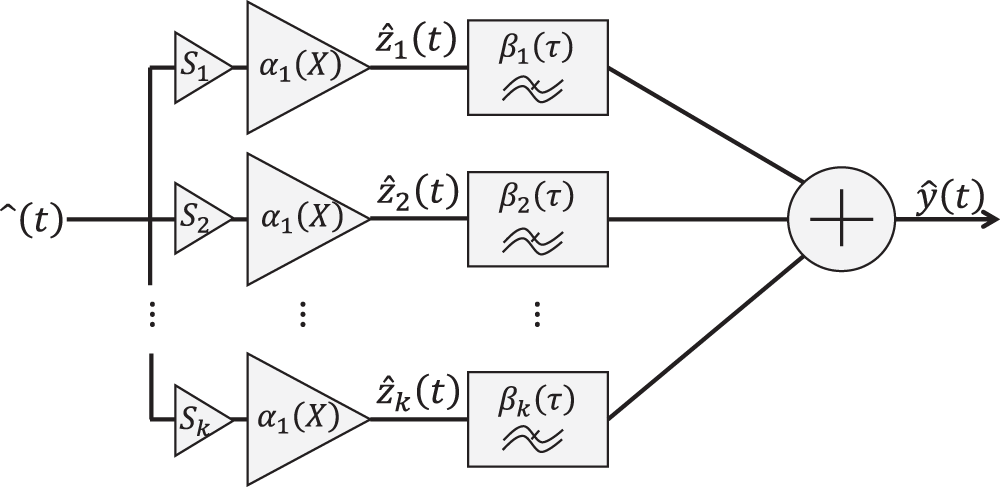
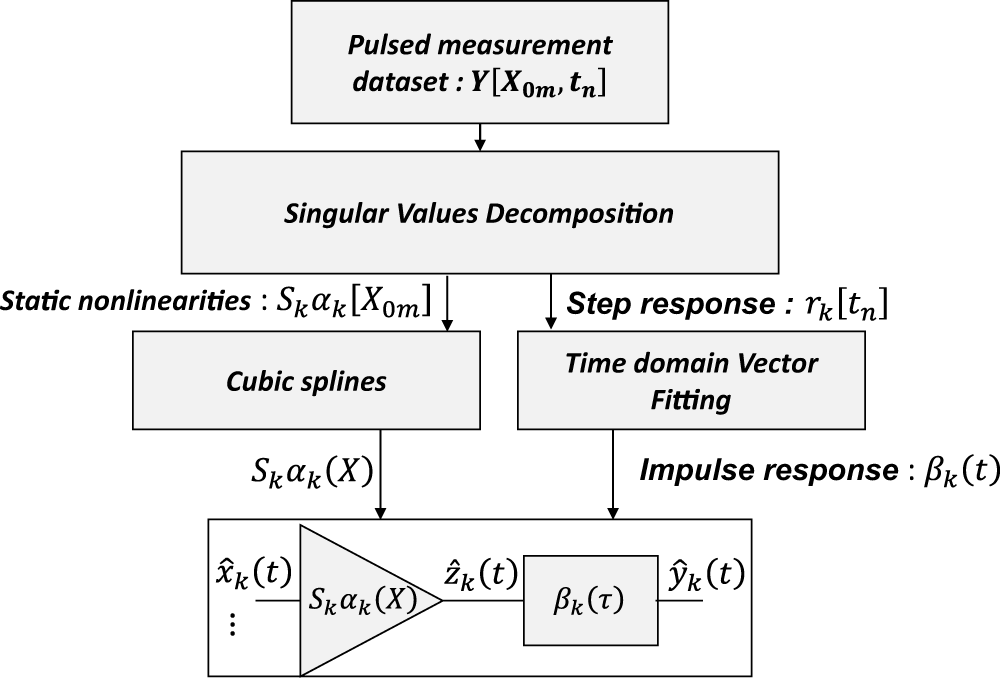
This formulation infers that the model can be represented by a set of parallel Hammerstein models, as shown in Fig. 4. Each branch consists of a static gain nonlinearity  $S_k.\alpha_k(X_0)$, followed by a linear impulse response filter
 $\beta_k (t)$. This arrangement is particularly useful for implementing the model in simulation environments.
NIR model topology.

From the above postulate, it follows that an optimal expansion (i.e., minimal expansion size and orthogonal basis functions αk and βk) can be obtained using the singular value decomposition (SVD) method, as described in [Reference Ngoya, Quindroit and Nébus6].
To do so, we form a two-dimensional matrix from database of the PA step responses  $Y(X_{0m},t_n)$;
 $m = 1,\dots,M$;
 $n=0,\dots,N-1$, where M and N are respectively the numbers of step amplitudes and time samples. Applying SVD to the matrix we obtain the form
 \begin{equation}
Y(X_0,t)=\sum_{k=1}^K S_k.\alpha_k(X_0).r_k(t)
\end{equation}
where we readily identify that basis functions  $r_k(t)$ in (8) are the step responses corresponding to the desired filter impulse responses
 $\beta_k(t)$ in (7), i.e.:
 \begin{equation}
r_k(t)=\int_0^t \beta_k(\tau).u(t-\tau)\;d\tau
\end{equation}
It is worth noticing that knowledge of the singular values of measurement database allows for an easy truncation of the series in (7), which will determine the number of parallel channels in Hammerstein model. In practice, a 60 dB relative threshold  $S_K/S_1$ guaranties good accuracy to the model, while filtering out major measurement errors.
Interpolation of the basis functions
It is important to note that the set of basis functions  $\alpha_k (X_0)$ and
 $\beta_k(t)$ obtained from the procedure, are known only at discrete points
 $X_{0m}$ and tn of the two variables, corresponding to the set of measurement points. In order to use the model under arbitrary excitation conditions, it is necessary to interpolate the basis functions between the measurement points. For reasons of robustness, interpolation by cubic splines is usually recommended for static nonlinearities
 $\alpha_k(X_0)$. For the impulse response of the filters,
 $\beta_k(t)$, it is more appropriate to use rational function interpolation; the most popular and effective method being that Vector Fitting (VF) [Reference Gustavsen and Semlyen11], briefly recalled. VF method was initially developed for frequency domain identification of linear transfer functions in the form:
 \begin{equation}
H(\Omega)=\sum_{n=1}^N \frac{C_n}{j\Omega-a_n}+d
\end{equation}
It was later on extended to the direct time-domain identification of linear impulse response, as the Time-Domain Vector Fitting (TD-VF) method [Reference Grivet-Talocia12]. Thus, if we reconsider the pole relocation technique introduced in [Reference Gustavsen and Semlyen11] into (10),
 \begin{equation}
\sum_{n=1}^N \frac{C_n}{j\Omega-\tilde a_n}+d=\left({\frac{\tilde C_n}{j\Omega-\tilde a_n}+d}\right).H(\Omega)
\end{equation}
Where  $\tilde C_n$ and
 $\tilde a_n$ are the relocated poles and residues of the original equation (10). Then considering from (10), that the transfer function
 $H(\Omega)$, is ratio of system output to input spectrum,
 $Y(\Omega)$ and
 $X(\Omega)$, we get:
 \begin{equation}
\left({\sum_{n=1}^N \frac{C_n}{j\Omega-\tilde a_n}+d}\right).X(\Omega)=\left({\frac{\tilde C_n}{j\Omega-\tilde a_n}+d}\right).Y(\Omega)
\end{equation}
Applying the inverse Laplace transform, we get the time formula of TD-VF below:
 \begin{equation}
\sum_{n=1}^N C_n.x_n(t)+d.x(t)=y(t).\sum_{n=1}^N \tilde C_n.y_n(t)
\end{equation}
Where
 \begin{equation}
x_n(t)=\int_0^te^{\tilde a_n(t-\tau)}x(\tau)\;d \tau
\end{equation}
 \begin{equation}
y_n(t)=\int_0^te^{\tilde a_n(t-\tau)}y(\tau)\;d \tau
\end{equation}
Finally, considering discrete integral over time in (14) and (15), we obtain a linear system equation that can be solved identically to the original frequency domain VF method [Reference Grivet-Talocia12]. As a summary, the different stages of NIR model identification and implementation are sketched in the block diagram below, Fig. 5.
NIR model identification and implementation.

Applying the above NIR principles allows for PA modeling using pulsed RF signals. This open up possibility to overcome the problems for PA destruction by self-heating, through adjustment of pulse duration.
Evaluation of the NIR model
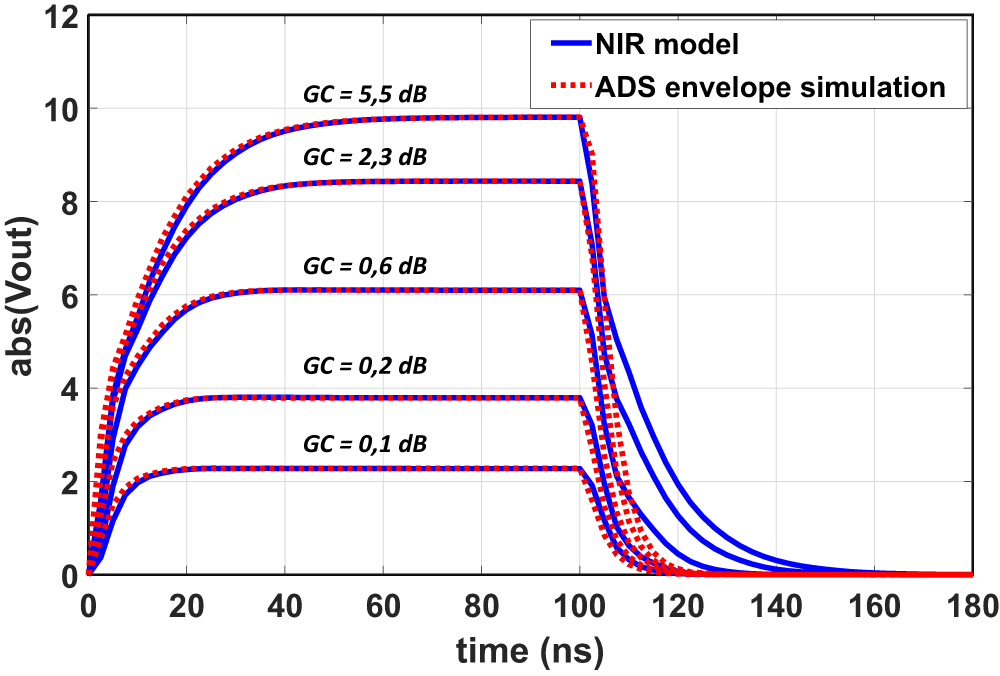
We have applied the above methodology to the LDMOS amplifier schematic indicated previously, and extracted the corresponding NIR model. The model evaluation results are shown in the figures below, for two different excitation conditions; RF pulse response test and frequency domain single-tone CW test. Figure 6 shows the response to the PA RF pulse excitation, where we have varied the pulse amplitude to cover 0–5 dB of gain compression range. The carrier frequency is located at PA bandwidth center frequency, 830 MHz. We compared the NIR model response with ADS circuit-envelope simulation. We may observe that the NIR model can reproduce accurately enough the rising front of the RF pulse response. However, it exhibits a large discrepancy on the falling edge, as the input amplitude grows into a gain compression region. This phenomenon is unfortunately a known characteristic of the Hammerstein model, identified as symmetry of the response [Reference Verspecht, Horn, Betts, Gunyan, Pollard, Gillease and Root10].
Pulse response test – comparison: NIR model and ADS circuit-envelope simulation.

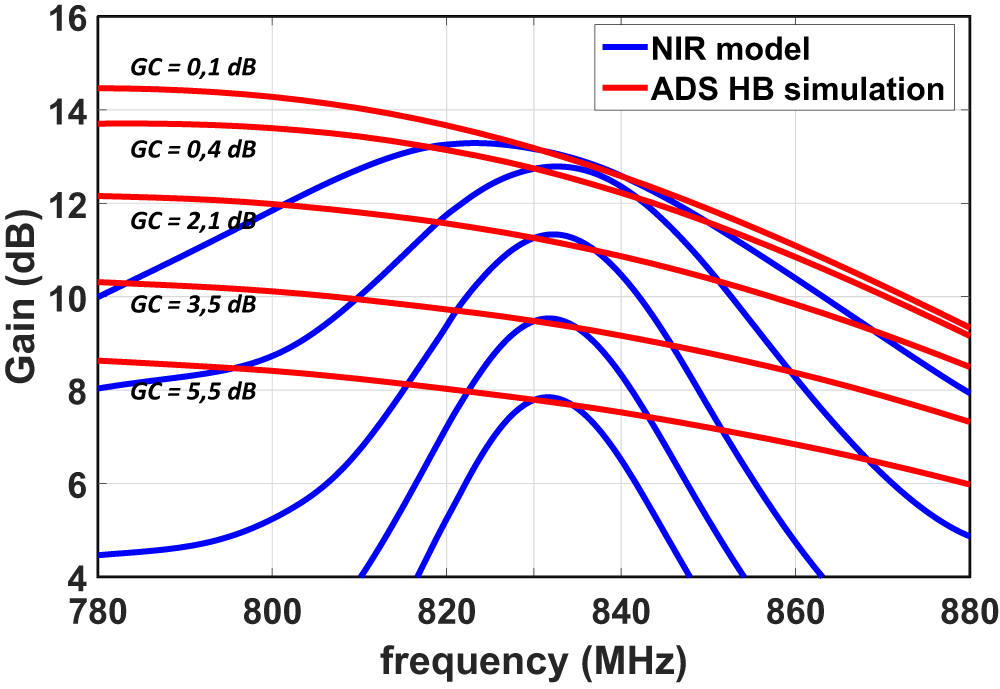
CW response test – comparison: NIR model and ADS HB simulation.

Figure 7 shows single-tone CW gain of the PA, with input power varied to cover a range from 0 dB to 5 dB of gain compression, over a frequency bandwidth of 100 MHz around 830 MHz center frequency. NIR model matches with ADS harmonic-balance (HB) simulation only at a very small vicinity of the center frequency. As we move from center, NIR model results are inconsistent.
A first-order analysis of the NIR model shows that the poor performance observed comes mainly from an intrinsic limitation of its characterization and identification principle. In fact, accuracy of the NIR model is intrinsically limited by the constraint on the pulse envelope sampling time step. Indeed, the sampling time step for observing the envelope signal cannot be less than half of the carrier period, because this would lead to spectrum aliasing between harmonics of the carrier frequency. In the present test case, the time step cannot be less than 2/830 MHz = 2.5 ns. This much large time step does not allow to effectively discriminate between HF (short-term memory) and LF (long-term memory) effects. Extensions of the NIR model have been proposed in an attempt to improve its performance [Reference Ngoya and Mons13]; the most relevant approach being the one proposed in [Reference Verspecht, Horn, Betts, Gunyan, Pollard, Gillease and Root10]. This proposes an identification of the core of the model on the basis of a series of two-level RF pulses, instead of single-level RF pulses we have used. A two-level pulse provides more information on the nonlinear transitions on rising and falling fronts, allowing us to overcome the response symmetry problem. However, this principle does not allow us to overcome the limitation due to the sampling step which impacts the model CW response. In addition, two-level pulse characterization introduces significant measurement complexity since the number of variables is increased from two to three (the two pulse levels and observation time). To conclude, we may nevertheless notice from the pulse response test, Fig. 6, that the long time-constants of the PA are rather well reproduced by the NIR model on the rising edge of the pulse. This is a good indication of NIR model’s ability to accurately capture LF memory effects of the PA. There in the next section, we consider a pragmatic solution to consider a combination of the NIR model with the original TPM model, where there is an explicit separation between the HF and LF memory effects. Thus, in this combination, the NIR model will be specialized to capture only LF memory effects, while HF memory effects continue to be characterized with conventional CW measurements, as described in Section 2.
Combined TPM and NIR models
TPM-NIR model principal
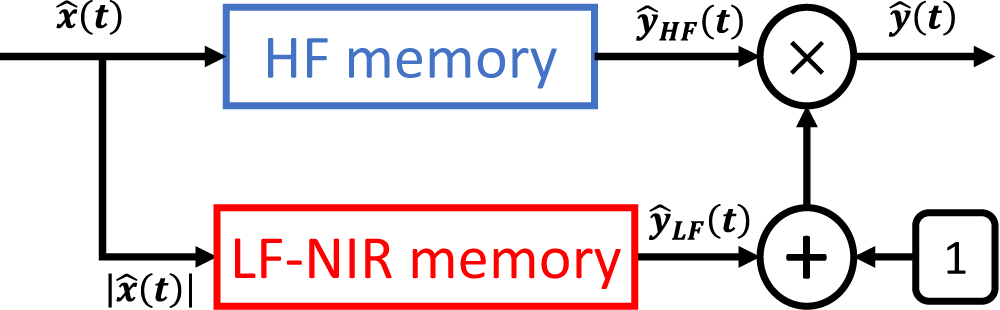
The combined TPM-NIR model has a structure identical to the original TPM model, Fig. 8, presented in Section 2. The only difference lies in the methodology for identification of the LF memory kernel. We will not delve into the principle for HF model kernel identification, which is extensively described in previous work [Reference Ngoya, Quindroit and Nébus6, Reference Ngoya and Mons13]. This is, similar to the above description of NIR principles, based on SVD decomposition, and two-way interpolation scheme (cubic splines for input amplitude and VF for CW frequency) of the CW measurement database.
TPM-NIR model topology.

Output signal  $\hat y_{LF}(t)$ of the LF-NIR path is expressed exactly as in equation (3) of the original TPM model, Section 2. In order to identify kernel of the LF-NIR path, it is essential to isolate the step response
 $\hat y_{LF}(t)$ resulting from its output, when the PA is excited by an RF pulse. To do this, we start by identifying the model of the HF path, as indicated in Section 2, using the CW characteristics. Then, in a second stage, we characterize the PA, as described in the previous section, using RF pulses. A simple analysis of the TPM-NIR block diagram shows that we can easily isolate the step response of LF memory path output as below:
 \begin{equation}
\hat y(t)=\hat y_{HF}(t).\left({1+\hat y_{LF}(t)}\right)
\end{equation}
 \begin{equation}
\hat y_{LF}(t)=\frac{\hat y(t)}{\hat y_{HF}(t)}-1
\end{equation}
Knowing the model of HF memory path, we can then construct a corresponding measurement database as seen from the LF memory path output. Finally, we can reapply the methodology of previous section to identify kernel of the LF memory path.
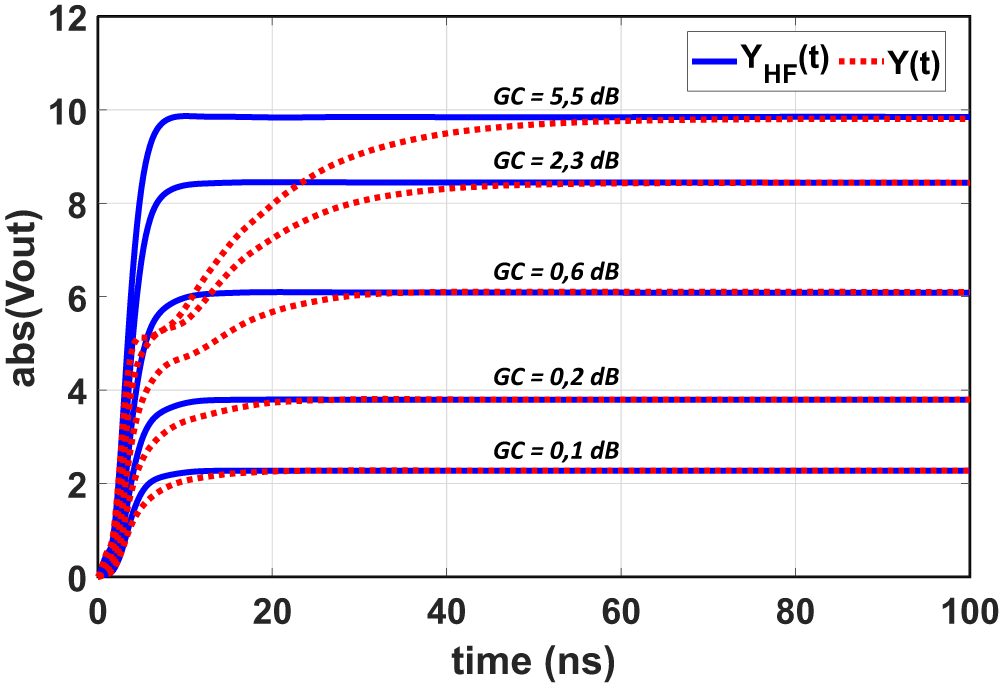
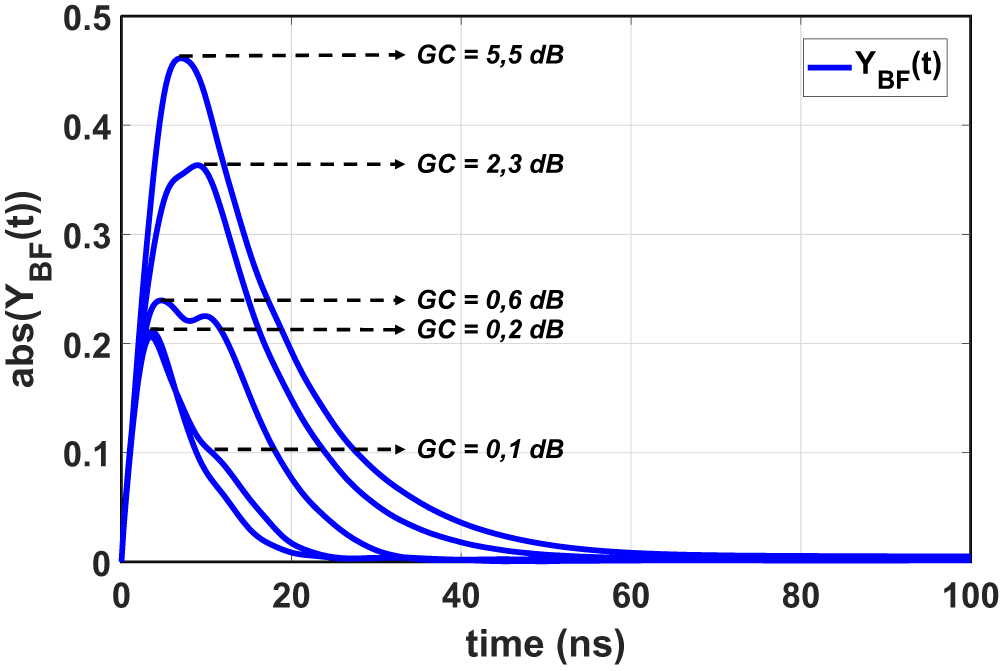
For illustration, we have applied the above process to the previous LDMOS PA circuit, from which we obtain the characteristics shown in Fig. 9 and Fig. 10. Figure 9 shows the superposition of total PA circuit step response and LF memory path step response, for various values of gain compression. Figure. 10 shows the corresponding step response as seen at the output of the LF memory path. We can then distinctly observe differences in time-constants between HF and LF memory paths.
Total PA pulse response  $\hat{y}(t)$, HF memory path pulse response
 $\hat{y}(t)$.

LF memory path pulse response  $\hat{y}_{LF}(t)$.

Evaluation of the TPM-NIR model
From the above methodology, we have extracted the TPM-NIR model of the PA. The kernel of each memory path has been represented by a parallel Hammerstein model. SVD expansion method allowed to select three parallel channels for each memory path. A convenient number of poles was found to be 3 for the HF kernel and 5 for the LF kernel. An evaluation of the model performance is given below for different excitation stimuli, with a comparison between the original TPM model, extended TPM-NIR model and ADS circuit simulations.
RF pulse response
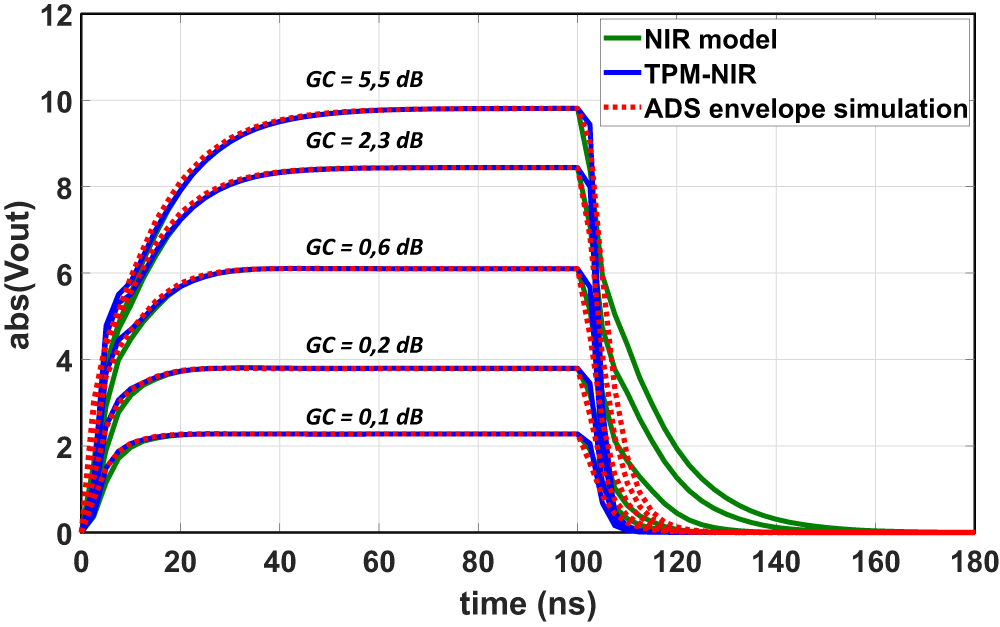
Figure 11 shows the comparison of the pulse responses of the NIR and TPM-NIR models with the circuit-envelope simulation, for varying gain compression level. A good TPM-NIR prediction can be observed on both rising and falling fronts of the pulse, all over gain compression range.
The response symmetry observed with the integral NIR model has been resolved. We may nevertheless notice a small mismatch with ADS circuit-envelope simulations on both fronts, which are rather attributed to an inaccuracy of the circuit-envelope simulation due to the limitation of envelope sampling time step already mentioned.
Pulse response test – comparison: NIR, TPM-NIR model and ADS circuit-envelope simulation.

Single-tone CW response
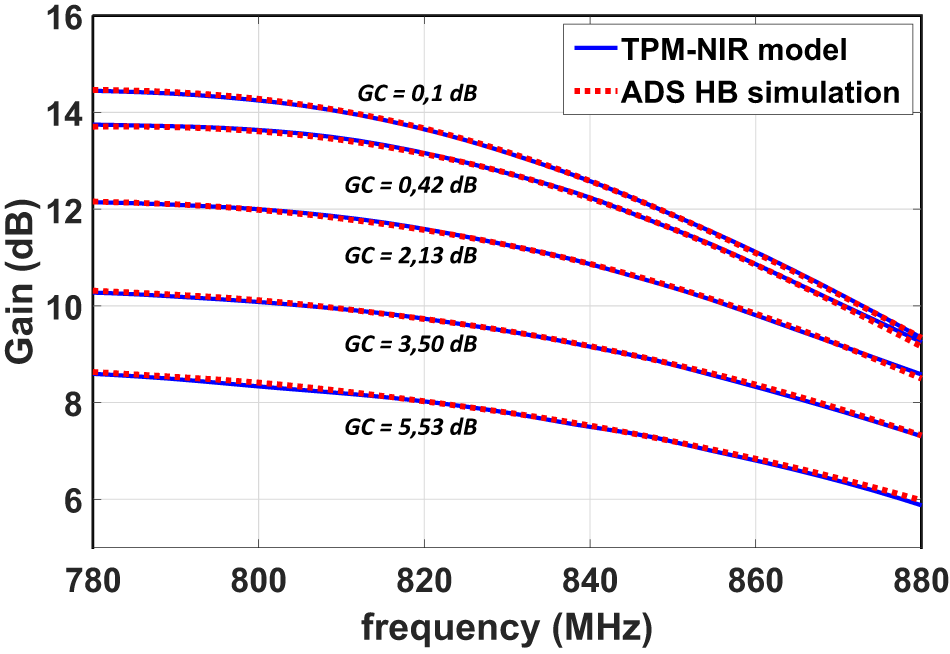
Figure 12 compares single-tone CW of the PA, from TPM, TPM-NIR model and ADS circuit simulation, for varying PA gain compression in 100 MHz bandwidth. We can observe a perfect agreement on these CW characteristics.
CW response test – comparison: TPM-NIR model and ADS HB simulation.

Third-order intermodulation distortion (IMD3)
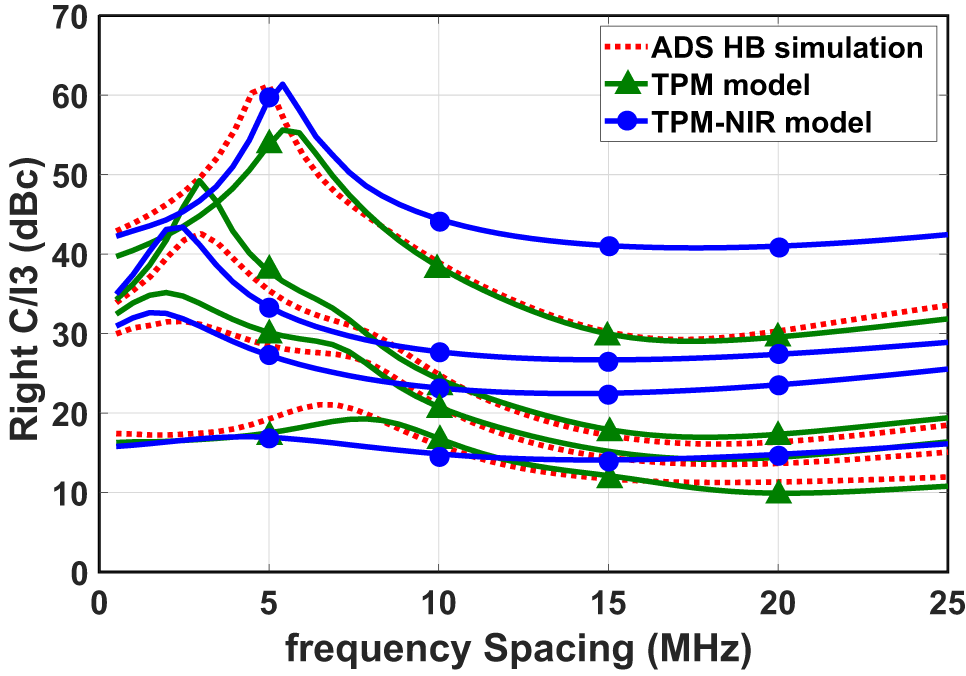
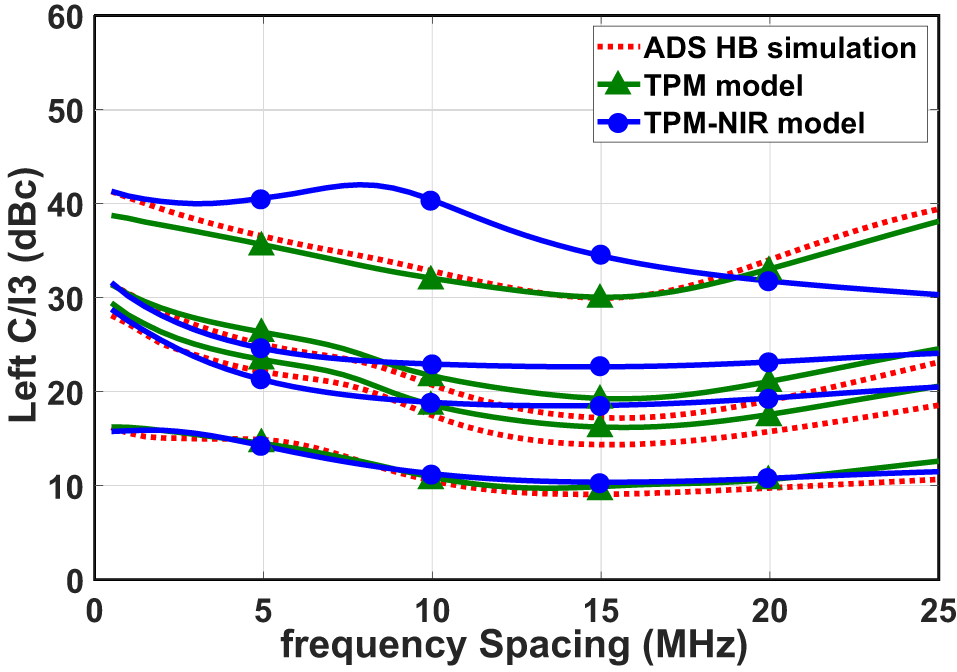
The PA has been simulated using an equal-amplitude two-tone excitation. The two tones are placed at an equal distance from the bandwidth center of 830 MHz. Ratios of IMD3 have been recorded for varying input tone power, from 0 to 5 dB gain compression, and two-tone distance from 1 to 25 MHz. The results are presented on Fig. 13 and Fig. 14, for the left and right carrier to IMD3 ratios (C/I3), respectively, with a comparison between original TPM, TPM-NIR model and ADS circuit simulation.
Right C/I3 – comparison: TPM, TPM-NIR models and ADS simulation.

Large left and right IMD asymmetry as well as important resonances are observed on the characteristics, indicating the presence of strong LF memory effects in the PA.
The results of the TPM-NIR model, as well as the original TPM model, are not in perfect agreement with the ADS simulation, but the overall variation trend against tone distance and input power is obtained. It should be noted that two-tone IMD3 response, because of the resonance phenomena taking place, is the most difficult test to satisfy for a behavioral model, which in its globalizing concept aims to reproduce the average dynamics.
Left C/I3 – comparison: TPM, TPM-NIR models and ADS simulation.

Modulated signal test
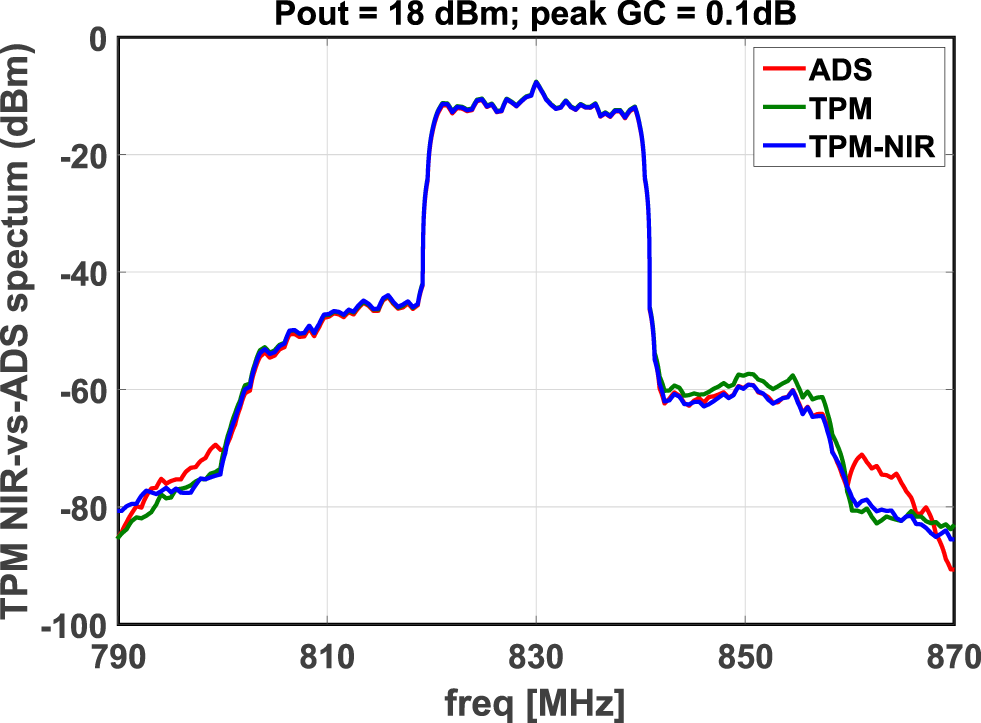
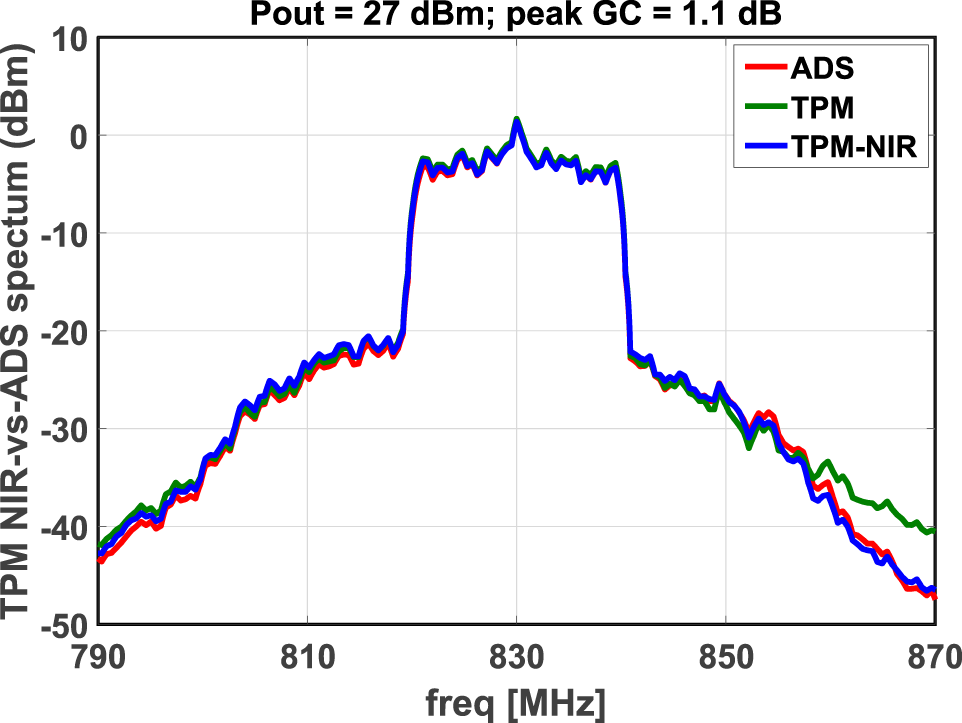
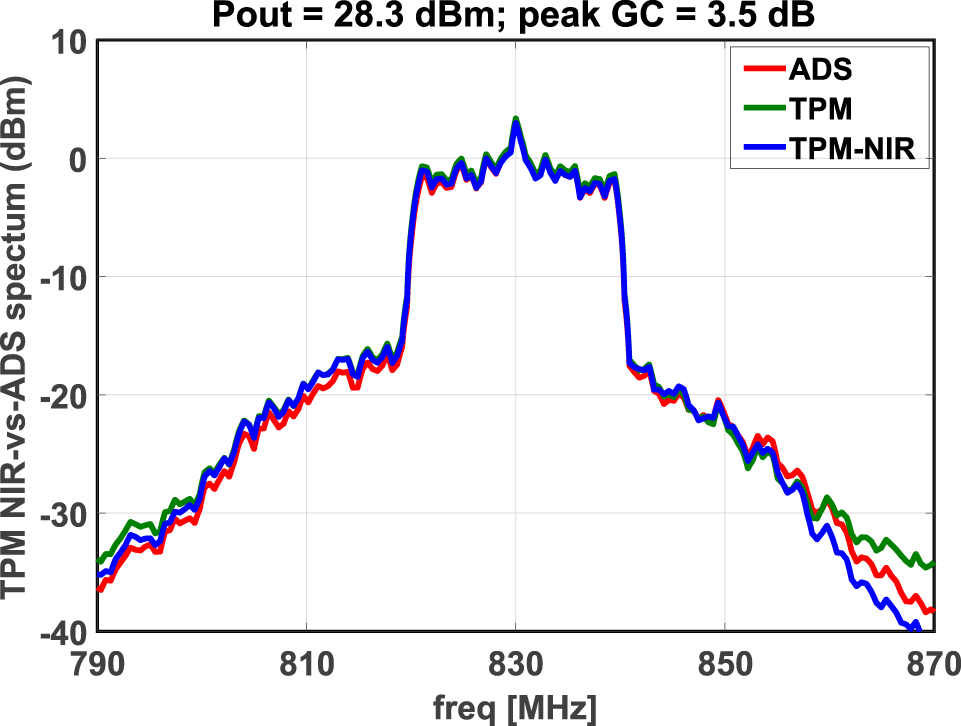
The last test concerns a 16-QAM modulation signal of 20 MHz bandwidth. In Fig. 15, Fig. 16 and Fig. 17, we present power spectrum of the output signal for 3 average power levels (Pin), corresponding to a peak gain compression level peak GC = 0.1 dB, 1.1 dB, 3.5 dB, respectively. The corresponding average output powers are also indicated in the figures. The figures compare the results of the two TPM models with the ADS simulation. As in the previous IMD3 figures, we observe a large left-to-right asymmetry of power spectral regrowth. The performance of the two TPM models is equivalent and in good agreement with the ADS simulation. Computational time comparisons between models and ADS simulation in a ratio greater than 100.
Output power spectrum 16-QAM,  $BW = 20\,\text{MHz}$,
 $P_{in} = 5\,\text{dBm}$.

Output power spectrum 16-QAM,  $BW = 20\,\text{MHz}$,
 $P_{in} = 16\,\text{dBm}$.

Output power spectrum 16-QAM,  $BW = 20\,\text{MHz}$,
 $P_{in} = 20\,\text{dBm}$.

Conclusion
System-level modeling of PA in RF communication chains is essential in order to reduce simulation and design times. In this context, the TPM model has demonstrated good performance both in computation time and prediction accuracy of PA in various architectures and technologies, whether on telecom or radar applications. However, its usage for very high-powerapplications is often problematic because it is not possible to characterize the PA in the saturated CW regime, at risk of damage due to self-heating effect.
In this paper, we have presented an alternate approach to the original TPM model based on a characterization of the PA in a pulsed RF regime, which would potentially allow control heating of the PA by monitoring pulse duration. The resulting model, known as the nonlinear impulse response (NIR) model, unfortunately showed limited performance in considering the combined effects of HF and LF memory. Subsequently, we combined the NIR model principles and original TPM model in an association, called the TPM-NIR model, in which the NIR model considers only the effects of LF memory. This combination has given satisfactory prediction results on the various test signals we considered. However, the fact that the TPM-NIR model association continues to include an HF memory path whose characterization requires measurements in the CW regime, does not solve the problem of destructive measurements posed in the beginning. Nevertheless, in view of the good results of the TPM-NIR model, a more in-depth study indicates that it would be possible to obtain the CW characteristics, other than by direct measurements in the CW regime. Indeed, the analysis of the results in Fig. 5 shows that it would be possible to obtain the CW characteristics of the PA from an extrapolation of NIR model response. In this perspective, all the measurements required for the TPM-NIR model could be done in a pulsed RF regime. Therefore, the perspective opened up by this work is twofold: investigate model identification of the HF memory path on the basis of pulsed RF measurements and to experiment with transposition to a VST-type physical bench of the principles so far developed on the basis of circuit simulations.
Acknowledgements
We would like to thank AMCAD Engineering for the advice and technical assistance provided, as well as the DGA-MI for its support in the framework of the “ICARE” project.
Competing interests
The authors declare none.

Jean Ortali received an engineer degree in electronics and telecommunication from the ENSIL-ENSCI school, University of Limoges in 2022. He is now a Ph.D. student in nonlinear electronics in the XLIM laboratory, Limoges. His main research interests are the behavioral modeling of power amplifier.

Sébastien Mons received the Ph.D. degree in electronics from the University of Limoges, Limoges, France, in 1999. He was with the Microwave Laboratory, CNES, Toulouse, France, from 1999 to 2001. Since 2001, he has been a Researcher with the French CNRS, XLIM Institute, University of Limoges. His current research interests include the modeling and simulation of RF frontends at the system level and nonlinear analysis of microwaves circuits. Dr Mons serves as a Technical Program Committee (TPC) member of the IEEE INMMiC Conference and was the TPC Chair of the IEEE INMMiC in 2018.

Tibault Reveyrand received the Ph.D. degree from the University of Limoges, Limoges, France, in 2002. From 2002 to 2004, he was a Post-Doctoral Scientist with CNES (French Space Agency), Toulouse, France. Since 2005, he has been a CNRS Engineer with the XLIM Institute, University of Limoges. From 2013 to 2016, he was a Visiting Researcher with the University of Colorado, Boulder, CO, USA. His current research interests include the characterization and modeling of RF and microwave nonlinear components and devices. Dr. Reveyrand was a Technical Program Review Committee (TPRC) member of IEEE MTT-S IMS and a reviewer for many IEEE journals. He was the recipient of the 2002 European GaAs Best Paper Award.

Edouard Ngoya received the Ph.D. degree in electronics from the University of Limoges, France, in 1988. He was an R&D Engineer with CAROLINE and RACAL-REDAC in 1988 and 1989. In 1990 he joined the French Centre National de la Recherche Scientifique (CNRS) as a Senior Researcher at XLIM-University of Limoges. He has initiated key circuit simulation and modeling techniques like Envelope-transient and Dynamic Volterra series, and contributed to the development of several ADE tools for nonlinear RF and microwave circuits. He co-founded the ADE company Xpedion Design Systems acquired by AGILENT technologies and is author of the GoldenGate™ RFIC simulation tool. His current domains of interest include full-chip RFIC simulation techniques, behavioral modeling of RF and microwave subsystems, and PA linearization techniques.

Christophe Mazière was born in Limoges, France, in 1977. He received the M.S. and Ph.D. degrees in electrical engineering from the University of Limoges, Limoges, France, in 2001 and 2004, respectively. In 2006, he joined AMCAD Engineering, Limoges, France, where he is involved with the development of advanced test benches for high-power device characterization. Since 2009, he has developed the activity of behavioral modeling with multiharmonics models. His research concerns behavioral modeling of nonlinear devices.