I. INTRODUCTION
Biogenic crystals i.e., crystals produced by living organisms, have attracted considerable attention in recent years because of their structural diversity, and fascinating micro- and nanostructures. Reference Mann1–Reference Skinner, Ehrlich, Turekin and Holland3 Biomineralization can occur in different parts and tissues in the human body, including kidney, gallbladder and pancreas. Reference Bazin, Daudon, Combes and Rey4–Reference Pak6 The genesis of pathological biomineralization Reference Ehrlich7 is a multifactorial complex process mediated by infections, metabolic, and genetic syndromes. Reference Taylor and Curhan8,Reference Guinerbretiere, Menet, Tardivon, Cherel and Vanel9 Apart from substantial suffering and associated morbidity, the deposition of minerals in the human urinary or biliary system (commonly called calculi or stones) is linked to several conditions ranging from poor voiding to renal, gastroenterological, or pancreatic dysfunction. Different aspects of such calcification, particularly the phase composition, quantification, and morphological features at the mesoscopic scale, must be taken into account for a deeper understanding of the processes leading to their formation and the development of appropriate prophylactic measures. Reference Gracia-Gracia, Millan-Rodriguez, Rousaud-Baron, Montanes-Bermudez, Angerri-Feu, Sanchez-Martin, Villavicencio-Mavrich and Oliver-Samper10,Reference Mukherjee11
In comparison to numerous reports on the composition, crystalline properties, structural and morphological features of kidney and gallbladder stones, Reference Ghosh, Basu, Chakraborty and Mukherjee12–Reference Yu, Pan, Huang, Huang, Yao, Hsiao and Wu17 only few studies focused on the mineralogy and mechanism of formation of pancreatic stones (PSs). Reference Narasimhulu, Gopal, Rao, Vijayalakshmi, Natarajan, Surendran and Mohan18,Reference Schultz, Moore, Geevarghese and Pitchumoni19 Traditionally, pancreatic calcifications have been largely associated with chronic pancreatitis from alcohol abuse and malnutrition. Reference Bimmler, Graf, Scheele and Frick20 Knowledge of entities causing such calcifications and their morphological appearance can help in an accurate diagnosis. The morphology of pancreatic calculi depends on several factors such as, the nature of crystalline phases, kinetics of crystal growth, metabolic disorder, and presence of organic components. Reference Bazin, Daudon, Combes and Rey4 In this context, the pancreatic protein, a 144 amino acid glycoprotein (15.5 kDa), also plays an important role. Reference Narasimhulu, Gopal, Rao, Vijayalakshmi, Natarajan, Surendran and Mohan18 Consequently, a given crystal species may induce PSs with different topological features reflecting the conditions prevailing during their formation.
The composition of PS can be classified into two parts, an organic matrix that includes proteins, glycosaminoglycans, fatty acids and cellular elements, and biominerals. Reference Beger, Warshaw, Carr-Locke, Neoptolemos, Russell and Sarr21 The most abundant mineral present in the PSs is calcium carbonate in the form of calcite (CAL). Other polymorphs of calcium carbonate (aragonite, ARG and vaterite, VAT), calcium phosphate, brushite, and hydroxyapatite have also been reported. Reference Rodgers and Spector22
Analytical methods such as chemical analysis, optical microscopy, infrared (IR) and Raman spectroscopy, scanning electron microscopy (SEM), thermogravimetric (TG) study and powder x-ray diffraction (PXRD) are generally used for compositional and morphological characterization of calculi samples. Reference Bazin, Daudon, Combes and Rey4,Reference Hesse, Kruse, Geilenkeuser and Schmidt23–Reference Malet, Dabezies, Huang, Long, Gadacz and Soloway25 Among the various physical methods available for characterizing PSs, PXRD has an obvious advantage of high specificity providing information on crystalline phases of the same chemical species that may imply different lithogenic conditions. With the development of x-ray powder profile-fitting structure refinement using the Rietveld method, Reference Rietveld26–Reference Young28 the quantitative estimates of mineral phases in urinary or PSs can now be accomplished with an increased accuracy. Reference Ghosh, Basu, Chakraborty and Mukherjee12,Reference Ghosh, Bhattacharya, Chatterjee and Mukherjee13,Reference Orlando, Kuplich, de Souza, Belich, Depianti, Orlando, Medeiros, da Cruz, Martinez, Corrêa and Ortiz29 This method also provides the microstructural features intrinsic to crystalline environment, e.g., grain size, microstrain, and preferred orientation. These factors are important when attempting to elucidate the mechanism for in vivo crystal growth. While the traditional methods of analyzing PXRD patterns use only selective parts of the x-ray data, the Rietveld method utilizes the entire diffraction profile during the analysis, thereby enhancing the reliability of the final result. The implementation of quantitative x-ray powder analysis of PSs via the Rietveld method has been hindered by the fact that most of the calculi samples are crystallographically heterogeneous and contain a considerable amount of organic matter. In addition, the variable degrees of crystallinity of calculi components further complicate such analysis. This is reflected in conspicuous paucity of studies Reference Ghosh, Basu, Chakraborty and Mukherjee12,Reference Ghosh, Bhattacharya, Chatterjee and Mukherjee13,Reference Orlando, Kuplich, de Souza, Belich, Depianti, Orlando, Medeiros, da Cruz, Martinez, Corrêa and Ortiz29 on the quantitative phase analysis of urinary stones using the Rietveld method.
The present paper reports the structural characterization and morphological analysis of nine PSs, collected from patients admitted in the R. G. Kar Medical College and Hospital, Kolkata, using FT-IR spectroscopy, PXRD, thermogravimetric analysis (TG–DSC) and SEM. To the best of our knowledge, the present work describes the first successful quantitative phase estimation of PSs using the Rietveld analysis of PXRD data.
II. EXPERIMENTAL
A. Materials
The pancreatic stones (PS1–PS9) used in the present study were made available to us following normal surgery from patients admitted to the R. G. Kar Medical College and Hospital, Kolkata, India, with chronic pancreatitis; seven patients were alcoholic (AL) and two non alcoholic (NAL). The calculi, with sizes 0.5–1.2 cm, were cleaned using surgical spirit and thoroughly washed with distilled water, followed by drying at ambient temperature (28 °C). The dry calculi samples were sawn into two halves using a jewelry saw. One part was used for the SEM study and the remaining part was crushed into powder using an agate pestle and mortar for FT-IR, PXRD, and TG–DSC analyses. For each sample, the patient history was also recorded.
B. Analytical methods
The FT-IR spectra of PSs were recorded as KBr pellets in the range 400–4000 cm−1 using a Shimadzu FT-IR spectrometer (model 8300 S; Shimazdu Corp., Kyoto, Japan). The PXRD data were collected on a Bruker D8 Advance powder diffractometer (Bruker AXS, Karlsruhe, Germany) using the Bragg–Brentano para-focusing geometry and Cu Kα radiation (λ = 1.5418 Å). X-ray diffraction data were recorded at room temperature (295 K) with a step size of 0.02° (2θ) and counting time of 4 s/step over the range 10° < 2θ < 120°. The morphology of PSs was examined with a field emission scanning electron microscope (FESEM, model FEI INSPECT F 50; FEI Company, Eindhoven, Netherlands) operating at an acceleration voltage of 5–20 kV. The PS samples were mounted on aluminum stubs using carbon tape and sputtered with gold. TG analyses were carried out using a Universal V4.2E TA instrument (TA Instruments, New Castle, Delaware) under a nitrogen flow in the temperature range 300–1173 K with a heating rate of 10 K/min.
C. Structural and microstructural characterization
The phase identification of PSs, PS1–PS9, was carried out using the Search/Match procedure of DIFFRAC.SUITE data evaluation software (EVA, version 14.0, Release 2008; Bruker AXS, Karlsruhe, Germany) and the powder diffraction file (ICDD PDF-2, Release 2003). Three polymorphic forms of calcium carbonate, CAL (PDF-01-081-2027), ARG (PDF-01-071-2396), and VAT (PDF-01-074-1867) were identified. Quantitative phase analysis and microstructural characterization have been performed via the Rietveld refinement of x-ray powder diffraction data with the Material Analysis Using Diffraction (MAUD) software. Reference Lutterotti30 In this process, a diffraction pattern is simulated from a series of structural (lattice parameters, atomic coordinates, occupancy factors, displacement parameters, etc.) and microstructural (crystallite size and lattice microstrain) parameters, the sample characteristic features (preferred orientation, absorption, etc.) as well as the profile parameters and background coefficients. The simulated pattern is compared with the observed x-ray powder diffraction profile following an iterative least-squares procedure through minimization of residual parameters. Reference Young28
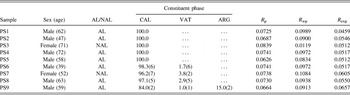
The peak profiles were fitted with pseudo-Voight functions with asymmetry correction at low angles. The background was described by a polynomial function of degree 9. Initially, the scale factor, zero shift (2θ), background coefficients, and profile parameters were refined. The structural and microstructural parameters of constituent phases were alternately refined in the next stage along with the earlier parameters. The occupancy factors and isotropic displacement parameters were held fixed at, respectively, the stoichiometric values and B eqv obtained from the corresponding single-crystal structure analysis. The starting atomic coordinates were taken from Maslen et al. Reference Maslen, Streltsov and Streltsova31 for CAL, from Caspi et al. Reference Caspi, Pokroy, Lee, Quintana and Zolotoyabko32 and Bail et al. Reference Bail, Ouhenia and Chateigner33 for ARG and VAT, respectively. No absorption correction was considered. For preferred orientation, the generalized spherical harmonic model Reference Sitepu34 correction was applied. The crystallite size and microstrain values were evaluated using the isotropic model as incorporated in the MAUD program. The quality of fit was assessed from various numerical criteria such as, the residual factor (R P), weighted residual factor (R wp), and expected residual factor (R exp) (Table I).
Rietveld refinement parameters of pancreas stones PS1–PS9 with patient histories.

The quantitative phase abundance of different crystalline phases was estimated using the relation
 $${w_i} = {\raise0.7ex\hbox{${{S_i}{{\left( {ZMV} \right)}_i}}$} \!\mathord{\left{\vphantom {{{S_i}{{\left( {ZMV} \right)}_i}} {\mathop \sum \nolimits_j^N {S_j}{{\left( {ZMV} \right)}_j}}}}\right.\kern-\nulldelimiterspace/\lower0.7ex\hbox{${\mathop \sum \nolimits_j^N {S_j}{{\left( {ZMV} \right)}_j}}$}}\quad ,$$
where w i is the weight fraction of each phase, i is the value for a particular phase j among the N phases, S j is the refined scale factor, Z is the number of formula units per cell, M is the molecular weight of the formula unit, and V is the volume of the unit cell. Reference Young28,Reference Lutterotti, Scardi and Maistrelli35
III. RESULTS AND DISCUSSION
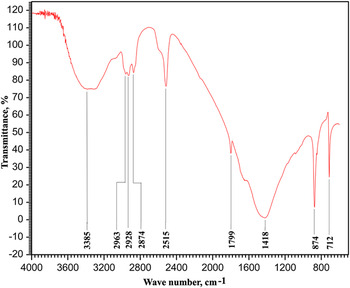
The FT-IR spectra of PS1–PS9 are essentially similar and show characteristic absorption bands corresponding to calcium carbonate. While the intense absorptions at 712 and 874 cm−1 for PS1 (Fig. 1) are due to the out-of-plane bending and asymmetric C–O stretching of the carbonate group, the broad band around 1418 cm−1 can be assigned to the in-plane bending of the CO3 2− ion. Reference Adler and Kerr36 The weaker IR bands at 2515 and 1799 cm−1 in Fig. 1 arise from the combination of fundamental vibration frequencies of the carbonate ion. The observed broad band around 3385 cm−1 in PS1 is attributable to the OH stretching vibration of adsorbed water molecules in the PSs. This was subsequently confirmed by the TG–DSC study. A similar adsorption of water by bulk calcium carbonate (major constituent of PSs) has been reported in the literature. Reference Al-Hosney and Grassian37 PSs are known to contain a significant amount of acidophilic protein. Reference Montalto, Multigner, Sarles and De Caro38 The presence of PS protein in PS1 was indicated by the protein amide as well as the C–H stretching bands at 2963, 2928, and 2874 cm−1, respectively, in the IR spectra (Fig. 1). Reference Narasimhulu, Gopal, Rao, Vijayalakshmi, Natarajan, Surendran and Mohan18,Reference Jin, Naruse, Kitagawa, Ishiguro, Kondo, Hayakawa and Hayakawa39
FT-IR spectrum of pancreas stone PS1.

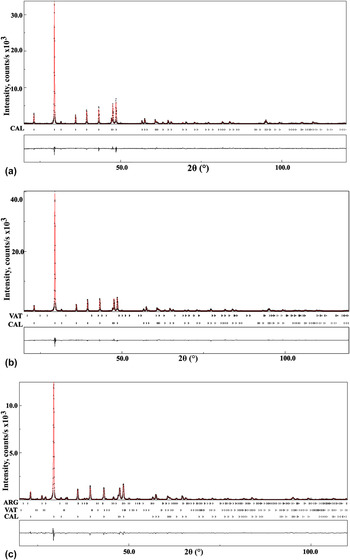
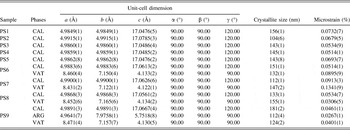
The results of the Rietveld refinement of PS1–PS9 along with the histories of the patients are summarized in Table I. The agreements between the observed and calculated powder patterns of selected pancreatic calculi (PS1, PS7, and PS9) are illustrated in Figs. 2(a)–2(c), respectively. The major composition of PSs, PS1–PS9, was calcium carbonate, which can occur as three anhydrous crystalline polymorphs, trigonal CAL, orthorhombic ARG, and hexagonal VAT. The refined unit cell parameters of constituent phase(s) in PS1–PS9 are listed in Table II. The results indicate that the unit cell of CAL (the major crystalline phase in all calculi samples studied) preserves its rhombohedral symmetry but the lattice parameters reveal anisotropic distortions as compared to the geological or synthetic CAL. Reference Maslen, Streltsov and Streltsova31 The highest lattice distortion of CAL was observed in PS2 with ∆c/c = 0.16% along the c-axis; the corresponding distortion along the a-axis in PS2 was about two times lower (∆a/a = 0.08%) than that along the c-axis. Similar lattice distortions of up to about 0.2% have been detected in biogenic CALs. Reference Pokroy, Fitch and Zolotoyabko40 It was suggested that these distortions result from the interaction of organic macromolecules and the crystalline phases in biogenic CALs. Reference Zolotoyabko and Pokroy41
Final Rietveld plots of (a) PS1 (b) PS7 (c) PS9. Profile observed (black cross), calculated (red), and difference (black).

Refined unit-cell dimensions and microstructural parameters of the constituent phases of pancreas stones PS1–PS9.

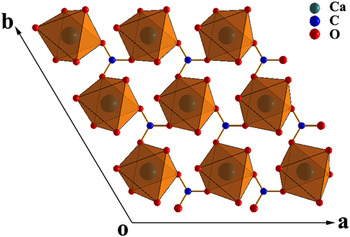
The quantitative phase analysis using the Rietveld whole powder profile-fitting structure refinement showed that five pancreas stones (PS1–PS5) were monophasic i.e., composed entirely of CAL (Table I), and three calculi samples (PS6–PS8) contained small amounts of VAT (1.7–3.8 wt%) in addition to the major phase CAL (96.2–98.3 wt%). The remaining stone (PS9) was a mixture of CAL (84.0 wt%), ARG (15.0 wt%), and VAT (1.0 wt%). The results of quantitative phase analysis of PS1–PS9 are in good agreement with the earlier reports, Reference Narasimhulu, Gopal, Rao, Vijayalakshmi, Natarajan, Surendran and Mohan18,Reference Schultz, Moore, Geevarghese and Pitchumoni19,Reference Rodgers and Spector22 which indicated CAL as the major crystalline component of PSs. This is also consistent with the fact that at ambient conditions, the most thermodynamically favorable polymorph of calcium carbonate is CAL. Reference Maslen, Streltsov and Streltsova31 A recent study Reference Yu, Pan, Huang, Huang, Yao, Hsiao and Wu17 of 68 gallbladder calcium carbonate stones, however, indicated that the ratio of CaCO3 polymorph concentrations for ARG:CAL:VAT was 64:20:16, is quite different from that observed in PSs. A possible reason for this anomaly can be the different etiology of gallbladder and PS formation. The structural parameters of CAL in PS1–PS9 agree closely to those reported for synthetic and biogenic CALs. Reference Maslen, Streltsov and Streltsova31,Reference Zolotoyabko, Caspi, Fieramosca, Von Dreele, Marin, Mor, Addadi, Weiner and Politi42 Considering PS1 as the representative of pancreas calculi studied, the observed C–O (1.286 Å) and Ca–O (2.365 Å) bond distances are comparable to possibly the most reliable C–O (1.282 Å) and Ca–O (2.359 Å) bond lengths determined using synchrotron radiation. Reference Maslen, Streltsov and Streltsova43 The Ca cation is surrounded by six O atoms from different CO3 groups forming a distorted CaO6 octahedron. Adjacent Ca-centred polyhedra are connected through corners sharing to form two-dimensional sheets parallel to the (001) plane (Fig. 3). Interlinking of two-dimensional sheets via carbonate groups of layers lying above and below generates a three-dimensional network structure of CAL.
View of the CAL structure in PS1, projected onto the (001) plane.

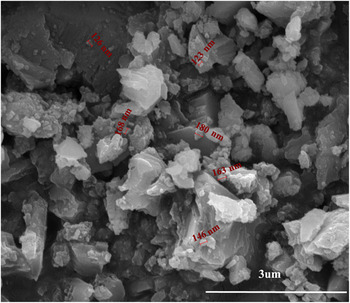
The estimated average crystallite size of CAL in PS1–PS9 from x-ray analysis, ranging between 104(6) and 180(2) nm, agrees well with the corresponding size, 100–200 nm, of biogenic CALs separated from two calcitic sea shells and determined from a high-resolution synchrotron powder diffraction study. Reference Pokroy, Fitch and Zolotoyabko40 The observed average SEM particle size (∼150 nm) in PS1 (Fig. 4) is comparable to the corresponding crystallite size obtained from the x-ray line-broadening analysis. The microstrain parameters of CAL in PS1–PS9 (Table II) are higher (0.05–0.09%) than that of geological CAL (0.02–0.03%). An increase in the microstrain fluctuations in biogenic CALs with respect to their geological counterparts is caused by organic macromolecules which are an integral part of pancreatic calculi.
SEM micrograph of pancreatic stone PS1.

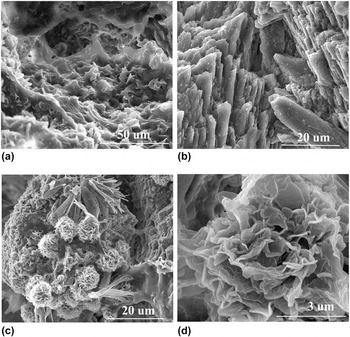
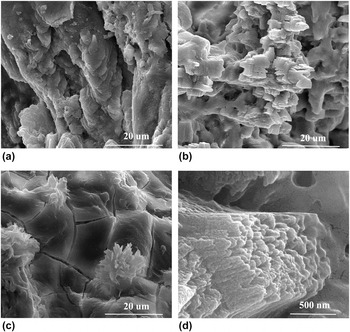
The morphology of CAL crystallites in PSs is studied and their structures at the mesoscopic scale have been analyzed using SEM. Synthetic CAL crystals are known to exhibit a regular {104} clevage rhombohedral crystal habit. In natural samples like oysters, avian egg shells, mollusk shell nacre, etc., however, flexible morphologies of CAL crystals such as dumbbells, spherulites, disks, and elongated laths have been observed. Reference Addadi and Weiner44–Reference Dauphin46 A possible mechanism by which smaller units of CAL can aggregate to form PSs is selected by competition. Small CAL crystallites in pancreas compete for the available space and only those favorably oriented continue to grow (along the c-axis of CAL) outward and impede the growth of others. The SEM images selected from numerous micrographs taken at different magnifications and orientations of PS7 and PS9 are representatives of characteristic morphologies of the PSs examined. A section of PS7 shows a modulated microtexture of predominant subhedral to anhedral CAL crystallites forming orbicular arrangements with abundant internal voids [Fig. 5(a)]. Characteristic columnar morphology of CAL crystallites is easily recognizable in PS7 [Fig. 5(b)]. The SEM image of PS7 [Fig. 5(c)] shows sponge like CAL spherulites of 8–10 μm diameter surrounded by irregular clumps. On higher magnification, the CAL spherulite appeared as an assembly of thin plates with a texture resembling rose flower petals [Fig. 5(d)]. While some regions of PS9 showed numerous ridges and depressions that included CAL crystallites having a texture like a cave interior [Fig. 6(a)], prismatic CAL crystals were also observed in other areas [Fig. 6(b)]. The foliated microstructure of the PS9 surface revealed fractured CAL crystallites with varying dimensions [Fig. 6(c)] and many crystal prisms have gently curved edges. The lath morphology of CAL crystallites was clearly visible in PS9 [Fig. 6(d)], which indicated an aggregation of parallel cylindrical CAL crystallites along the crystallographic c-axis. The results undoubtedly revealed the formation of nano-structured CAL crystallites during biomineralization in pancreas.
SEM micrographs of PS7 showing (a) modulated surface topology (b) columnar morphology of CAL crystallites (c) CAL spherulites (d) CAL crystallites with a flower texture.

SEM micrographs of PS9 showing (a) CAL crystallites forming a cave interior morphology (b) prismatic CAL crystals (c) fractured CAL crystallites (d) lath morphology of CAL.

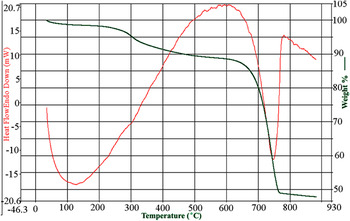
The TG and DSC curves of a powdered bulk sample of PS1 are shown in Fig. 7. The TG curve consists of three weight loss steps. The first gradual weight loss (∼4.0%) in the temperature range 300–525 K can be assigned to the loss of adsorbed water and it is an endothermic process centered at 400 K. The second step of weight loss (8.2%) between 525 and 910 K is due to the exothermic degradation of organic matter in pancreas stone PS1. The third step is a steeper one and the associated weight loss (41.1%) between 910 and 1040 K with a sharp endothermic peak at 1025 K in the DSC curve is caused by the decomposition of CAL into calcium oxide. The observed weight loss (41.1%) in PS1 agrees well with the corresponding value (41.3%) reported for calcium carbonate containing a small amount (5%) of citric acid. Reference Singh and Singh47 The results indicate that the decomposition temperature of CAL in PS1 (1025 K) is decreased by about 150 K compared to that of synthetic CAL (1173 K). The difference in the decomposition temperatures can be attributed to the biogenic origin of the PS sample PS1.
TG–DSC curve of pancreas stone PS1.

IV. CONCLUSIONS
The pancreatic stones (PS1–PS9) collected from the patients suffering from chronic pancreatitis have been characterized structurally and morphologically using a combination of FT-IR, PXRD, SEM, and TG–DSC methods. The FT-IR spectra of PS1–PS9 indicated that calcium carbonate was the major constituent of all pancreatic calculi studied. The Rietveld analysis of PXRD data clearly demonstrated that five out of nine PSs were composed of exclusively CAL, whereas the remaining four calculi samples were a mixture of phases containing small amounts of VAT (1.0–3.8 wt%) and ARG (15.0 wt% in PS9) in addition to the major phase CAL. The SEM images of PSs revealed a modulated surface topology at the mesoscopic scale with abundant voids. The CAL crystallites in PSs exhibit different morphologies from thin plates, rhombohedral prisms, and spherulites to cylindrical laths. The TG analysis revealed a significant lowering of decomposition temperature of biogenic CAL (1025 K) compared to that of synthetic CAL (1173 K). The methodology presented in this paper can provide precise quantitative phase abundance as well as the structural and morphological features of PSs at the nanometer scale. The results will be useful in understanding correlations between the PS compositions and specific pathophysiological conditions during their formation.
ACKNOWLEDGMENT
Financial support from the Department of Science and Technology (DST), Government of India, New Delhi, to A.K.M. through Grant No. SR/S2/CMP-75/2012 is acknowledged.