



Introduction
Malaria is a life-threatening disease that affects human and animals. Four different species of Plasmodium cause malaria in human, including P. falciparum, P. vivax, P. ovale and P. malariae. Although human patients are sometimes infected with animal pathogens of Plasmodium, such as P. knowlesi (Antinori et al., Reference Antinori, Galimberti, Milazzo and Corbellino2012; Elmi et al., Reference Elmi, Hajialiani, Asadi, Orujzadeh, Kalantari Hesari, Rahimi Esboei and Gholami2019). The disease caused by P. falciparum in human is the most dangerous and fatal as compared with other species. In 2018, there were an estimated 405 000 deaths from malaria globally, compared with 416 000 estimated deaths in 2017 and 585 000 in 2010 (WHO, 2019).
The drugs used to treat malaria, artemisia annua, primaquine, chloroquine, mefloquine and lumefantrine have shown side-effects such as anorexia, stomach ache, diarrhea, nausea, vomiting and visual disturbances. Also, some of these drugs are contraindicated in pregnancy, kids and G6PD deficient subjects. The side-effects of drugs as well as drug resistance observed in parasite, raised some problems in their application, hence raising the need for an alternative medicine (Braga et al., Reference Braga, Martins, Cayotopa, Klein, Schlosser, da Silva, de Souza, Andrade, Filgueira-Júnior, Pinto and da Silva-Nunes2015; Guo, Reference Guo2016; Ghimire et al., Reference Ghimire, Singh, Ortega, Rijal, Adhikari, Thakur and Marasini2017). To improve the efficiency of anti-malarial drugs, nowadays, the combination therapy is recommended. Artesunate plus amodiaquine or amodiaquine plus sulfadoxine-pyrimethamine is more commonly used therapies. Although the synergistic effects of drugs cause a better therapy, but their side-effects may also increase. Thus, finding a new nanodrug combination with herbal-chemical nature may reduce the risk of unintended side-effects in patients (Tagbor et al., Reference Tagbor, Bruce, Browne, Randal, Greenwood and Chandramohan2006; Faye et al., Reference Faye, Ndiaye, Ndiaye, Dieng, Faye and Gaye2007; Lu, Reference Lu and Lu2015).
Currently, the nanotechnologists have created carriers to improve drug effectiveness. Studies carried out on antibiotic loaded on nanoparticles have shown their enhanced antibacterial effect and when different drugs including amphotericin B were loaded on nanoparticles, less nephrotoxicity has been reported (Mukherjee et al., Reference Mukherjee, Patra, Dutta, Banik and Basu2016; Zia et al., Reference Zia, Mohammad, Rauf, Khan and Zubair2017). Recently, there has been a growing interest in the use of dendrimer as a nano-drug carrier (Namazi et al., Reference Namazi, Motamedi and Namvari2011).
Dendrimers are nanometre-sized, highly branched molecules with highly regulated structure and end groups located on the peripheries. The spaces between its branches are favourable for drug encapsulation (Lo et al., Reference Lo, Kumar, Hsieh and Sun2013; Abbasi et al., Reference Abbasi, Aval, Akbarzadeh, Milani, Nasrabadi, Joo, Hanifehpour, Nejati-Koshki and Pashaei-Asl2014). The biocompatible and biodegradable dendrimer of citric acid–polyethylene glycol–citric acid (CPEGC) is a good candidate of these types, which its 1–3 generations as drug delivery systems were synthesized by Namazi and Adeli (Reference Namazi and Adeli2003) and the controlled delivery of mefenamic acid and diclofenac with these carriers is already examined (Namazi and Adeli, Reference Namazi and Adeli2005). These dendrimers are biocompatible, have high potential as carriers in drug delivery, and increase drug solubility if combined with hydrophobic drugs (Haririan et al., Reference Haririan, Alavidjeh, Khorramizadeh, Ardestani, Ghane and Namazi2010). However, the represented synthesis method for these dendrimers is difficult and needs various steps for purification which is time consuming and reduces efficiency. Furthermore, the harmful and toxic substances such as dichloromethane and diethyl ether were used in its synthetic pathway (Alavidjeh et al., Reference Alavidjeh, Haririan, Khorramizadeh, Ghane, Ardestani and Namazi2010; Haririan et al., Reference Haririan, Alavidjeh, Khorramizadeh, Ardestani, Ghane and Namazi2010). Therefore, this study is conducted with the aim of finding a new and simple method, without using toxin and harmful materials, for the synthesis of CPEGC of second generation (G2). One of the herbal drugs that has been approved for its anticancer, antibacterial and anti-parasitic effect is curcumin. Curcumin is the active compound in curcuma longa which, due to its low hydrophilicity, has faced troubles in pharmacological applications. Various strategies were used to improve the solubility of the drug, namely the use of high-water soluble nanodendrimers (Tyagi et al., Reference Tyagi, Singh, Kumari, Kumari and Mukhopadhyay2015; Tiwari et al., Reference Tiwari, Pahuja, Kumar, Rath, Gupta and Goyal2017; Rahmani et al., Reference Rahmani, Alsahli, Aly, Khan and Aldebasi2018).
Conjugation of chloroquine with this nanocomposite was anticipated to increase its effectiveness on the plasmodium parasite. Since nanodendrimer G2 increases drug uptake by cells, they require lower dosages to have the same anti-parasitic effects, hence reducing the side-effects (Tallarida, Reference Tallarida2011). On the other hand, if there is a synergistic effect between curcumin and CQ, the new drug combination, at a lower dose, will have a greater effect on plasmodium parasite. In the current study, with the aim of assaying the effects of the synthesized nanocomposite on plasmodium parasite, the parasite metabolic profile was studied by the 1H NMR method, and then compared with the control group. The most important advantage of studying metabolomics (metabolomics method) over other methods is the simultaneous and network analysis of metabolites and the study of the relationships between metabolites (Tyagi et al., Reference Tyagi, Singh, Kumari, Kumari and Mukhopadhyay2015; Tiwari et al., Reference Tiwari, Pahuja, Kumar, Rath, Gupta and Goyal2017; Mehrizi et al., Reference Mehrizi, Ardestani, Molla Hoseini, Khamesipour, Mosaffa and Ramezani2018).
The found results might be useful in achieving specialized markers, for finding new and effective drug targets, in treating fatal disease of malaria. The present study aimed to examine the nanocomposite effect of G2 dendrimer + curcumin + chloroquine (NDC-CQ) on P. falciparum in vitro. The aim of the present study was to synthesize a novel chloroquine based anionic linear globular dendrimer-curcumin nano-conjugate and investigation of its antiplasmodial effect on metabolome of P. falciparum by pfLDH assay and 1H NMR-based metabolomics analysis.
Materials and methods
Nanocarrier synthesis
First, nanodendrimer G2 (ND) was synthesized using the modified method of Namazi and Adeli (Reference Namazi and Adeli2005) (2 mL of polyethylene glycol 600, 5 mL dimethyl sulfoxide, 1.2 g N,N’-dicyclohexylcarbodiimide and 1.2 g citric acid). In order to conjugate curcumin to nanodendrimer G2 (NDC) as a nanocarrier, 100 mg curcumin was added to 500 mg nanodendrimer G2 in ethanol. A total of 2.2 mg calcium chloride with 280 mg 1-ethyl-3-(3-dimethylaminopropyl)carbodiimide was added to the compound. The reaction was completed under reflex reaction at 110°C after 72 h. The solutions were removed by a rotary evaporator, and using chromatography G-75 (MERCK, Germany), nanocarrier was purified. Finally, the resulting solution was lyophilized to obtain a dry powder.
Novel nanocomposite synthesis
To synthesize the novel chloroquine-based anionic linear globular dendrimer–curcumin nano-conjugate (NDC-CQ) as the nanocomposite, CQ was loaded into the nanocarrier (Mehrizi et al., Reference Mehrizi, Ardestani, Molla Hoseini, Khamesipour, Mosaffa and Ramezani2018). A total of 100 mg synthesized nanocarrier was dissolved in 4 mL ethanol (70%), and then 40 mg CQ was added to solution and rotated for 7 days. The achieved solution was then centrifuged with 21 728 × g for 30 min. The sediment was then washed with PBS 1× three times and lyophilized. Different dilutions of the finalized novel nanocomposite were prepared to assess their anti-malarial effects.
Using spectroscopic analysis, the absorption ratio of different dilutions of curcumin and CQ was recorded and the respective standard curve was drawn. The loading percentage was then calculated after using a NanoDrop set at a wavelength of 429 nm to assess the absorption of 100 mg mL−1 of the nanodrug (Bruni et al., Reference Bruni, Stella, Giraudo, Della Pepa, Gastaldi and Dosio2017; Mehrizi et al., Reference Mehrizi, Ardestani, Molla Hoseini, Khamesipour, Mosaffa and Ramezani2018).

Nanocomposite characterization
Determining form, size and distribution of the particle was carried out using dynamic light scattering (DLS) and scanning electron microscope (SEM). The nanodendrimer G2 was confirmed by using liquid chromatography-mass spectrometry (LC-MS). Further, nuclear magnetic resonance (NMR) in D2O solution and Fourier-transform infrared (FTIR) spectroscopy were also applied to confirm dendrimer–curcumin conjugate (NDC) and nanocomposite (NDC-CQ) synthesis respectively (Mehrizi et al., Reference Mehrizi, Ardestani, Molla Hoseini, Khamesipour, Mosaffa and Ramezani2018).
Nanocomposite solubility and cellular absorption
To calculate nanocomposite solubility, 1 mg free curcumin, CQ and synthesized nanocomposite were prepared in water and after centrifugation and removal of the sediments, their absorption were measured in wavelengths of 200–800 by a NanoDrop set. Flow cytometry (FCM) was used to determine the amount of drug uptake by cells. Untreated cells were used as the negative control group.
Drug release
Dialysis sets were utilized in pH 7.4 and various time periods to record the nanocomposite release rate. The amount of the nanocomposite released was assessed using spectrophotometry and utilizing the relative standard curves.
Hemolytic assay
The protocol provided by Memar et al. (Reference Memar, Jamili, Shahbazzadeh and Bagheri2016) was employed for hemolytic assay of the drug. A total of 5 mL of freshly drawn blood was centrifuged along with 50 μL of EDTA for 10 min at 804 × g. The sediment was dissolved in 4 mL of PBS 1× buffer and again was centrifuged for 10 min at 804 × g. The final erythrocyte was then dissolved in 80 mL of PBS 1×. A total of 190 μL blood plus 10 μL of different dilutions of the nanocomposite were then added to each microplate well. The first well was designated as negative control (PBS 1×) and the last one was positive control (triton×100). The samples were finally incubated at 37 °C for 30 min before measuring their absorption at 540 nm with a spectrophotometer (Memar et al., Reference Memar, Jamili, Shahbazzadeh and Bagheri2016). The hemolysis percentage was calculated using the following formula:

MTT assay
Vero cells were provided by Tehran University of Medical Sciences and cultured in DMEM + 10% FBS + 1% PenG/Strep medium. Cell viability was assessed using the MTT assay upon tetrazolium salt decomposition by the mitochondrial succinate dehydrogenase in the live cells. After 48 h of drug introduction to the plates, 10 μL of MTT solution and 100 μL of DMSO were added, respectively. Finally, absorbances were read on a microplate reader at 570 nm and at a reference wavelength of 630 nm (Lazaro and Gay, Reference Lazaro and Gay1998).
P. falciparum culture
The Trager and Jensen (Reference Trager and Jensen1976) modified method was used to culture P. falciparum. Protozoans of P. falciparum 3D7 strain were cultured in 7 mL RPMI1640 medium with 10% human serum, hematocrit 2%, HEPES 5.958 g L−1, NaHCO3 (g L−1), hypoxanthine (13.6 mg L−1), gentamicin (25 g L) and D-glucose (4.5 g L−1). The medium was changed every 48 h, and incubated with CO2 5% in 37°C.
Antiplasmodial activity of nanocomposite
After suitable growth of parasite in culture medium (parasitemia 1% and hematocrit 2%) 150 μL of falcon contents were transferred to microplate sinks. Afterwards, 50 μL of various concentrations of drug (0.1, 0.5, 1, 1.5, 2 and 2.5 μg mL−1) were added to microplates. The first and final well of the microplate were negative and positive controls respectively. The microplate was finally transferred to a candle jar, and incubated at 37°C for 48 h. The tests were repeated in three microplate rows to confirm the results. Finally, the parasitemia was estimated by the microscopic and enzymatic (pfLDH) methods.
Microscopic counting method
Thin smears were prepared from each well and then stained with Geimsa stain to determine the percentage of parasitemia by microscopy.
Lactate dehydrogenase (LDH) assay
Parasitemia was determined by measuring the pfLDH activity using spectrophotometry, according to a modified version of the method of Makler and Hinrichs (Reference Makler and Hinrichs1993). In summary, 100 μL of Malstat reagent (0.11% v/v Triton-100; 115.7 mm lithium L-lactate; 30.27 mm Tris; 0.62 mm 3-acetylpyridine adenine dinucleotide) with pH 9 and then 25 μL of PES/NBT (1.96 mm nitro blue tetrazolium chloride; 0.24 mm phenazine ethosulphate) were added to each well of a 96-well plate. Finally, 20 μL of a suspension culture medium containing 0.5% parasitemia, 1.5% hematocrit and different concentrations of the nanocomposite were added to the previous solution and the absorbance was then read at 650 nm. The first and last wells were contained the negative (blood without parasites) and positive controls (blood containing parasites), respectively. The percentage of parasitemia was calculated using the following formula:

Isolation of parasites
To purify the ring stage of P. falciparum (isolation of parasites), the test flask contents were centrifuged at 289 × g for 5 min, the supernatant was removed, and parasites were isolated by adding 40 times the volume of 0.02% saponin in PBS 1×. The solution was then kept on ice for 30 min before it was centrifuged at 4°C for 20 min at 2057 × g and washed three times with PBS 1×. The purified sedimented parasite was centrifuged at 25 200 × g at 4°C for 5 min and the supernatant was removed (Parvazi et al., Reference Parvazi, Sadeghi, Azadi, Mohammadi, Arjmand, Vahabi, Sadeghzadeh and Zamani2016).
Parasite metabolites extraction
A total of 3 mL of physiological serum (0.9%) was added to the falcon tube containing purified parasites before homogenizing the sample with 9 KHz for 5 min using sonification. The sample was then centrifuged for 10 min at 12 857 × g. 200 μL of cold 1.8 mm perchloric acid was added to the plate for every 108 parasites. The fluid pH was then adjusted and maintained at 6.8 by adding 5.4 M KOH. To induce acid sedimentation, the liquid was kept in ice for 60 min before centrifuging at 12 857 × g for 10 min and lyophilized. Finally, 1 mL D2O was added to the remaining powder to prepare the sample for NMR spectrophotometry (Parvazi et al., Reference Parvazi, Sadeghi, Azadi, Mohammadi, Arjmand, Vahabi, Sadeghzadeh and Zamani2016).
1H NMR spectra analysis
The spectra were directly entered into ProMetab in MATLAB software and were processed into a proper format for statistical analysis. Spectra of each sample was divided into 1624 segments between 0 to 10 ppm chemical shifts and the peak attributed to water at 7.4 ppm was also removed. They were then converted to Excel files which were then entered into Metabo-Analyst website and analysed by partial least square-discriminate analysis. Differentiating metabolites were identified from their chemical shifts by the loading plots using the Human Metabolome Database. These identified metabolites were then entered into the MetaboAnalyst website using pathway analysis and biochemical pathways involved in the antimalarial properties of nanocomposites were identified.
Statistical analysis
After evaluation of data and confirming their normal distribution, the data were statistically analysed using SPSS V. 18 by one-way ANOVA, Student's t-test and nonlinear regression (sigmoidal dose-response model). P values <0.05 were considered statistically significant.
Results
The results of the nanocomposite characterization
Investigation of the size and weight of the synthesized nanoparticles using DLS and SLS revealed that the synthesized NDC with a size range of 90 nm, as a drug carrier for drug delivery into cells, and also the synthesized NDC-CQ with a size of 239 nm have suitable and acceptable sizes for the present study (Fig. 1). The molecular weight of NDC-CQ (kDa) by using the SLS method was reported on average 31.7 ± 3.02. The SEM also confirmed DLS results (Fig. 2).
DLS showing the size distribution of NDC (A) and NDC-CQ (B). Polydispersity index is related to the distribution of the nanocomposite. The polydispersity index (PDI) average was 0.23 ± 0.01 (the PDI value which is close to 0 shows the homogeneous nanoparticle solution while the PDI value above 0.5 indicates the heterogeneous nanoparticle solution).

SEM image of NDC-CQ showed proper morphology with magnification 100 and 200k× respectively.

Liquid chromatography-mass spectrometry (LC-MS)
LC-MS was used to confirm the nanodendrimer G2 (Fig. 3). The peaks at 569 and 652 m z−1 in the figure represent 8 and 9 repeating units (CH2-CH2-O, M w = 4) of PEG with a citric acid group, respectively. There is also a 44-unite difference between other breaks. The difference is equal to the molecular weight of each CH2-CH2-O repeating unit of PEG molecule in the nano dendrimer G2.
LC-MS spectrum of dendrimer G2.

Confirmation of covalent conjugation of nanodendrimers to curcumin
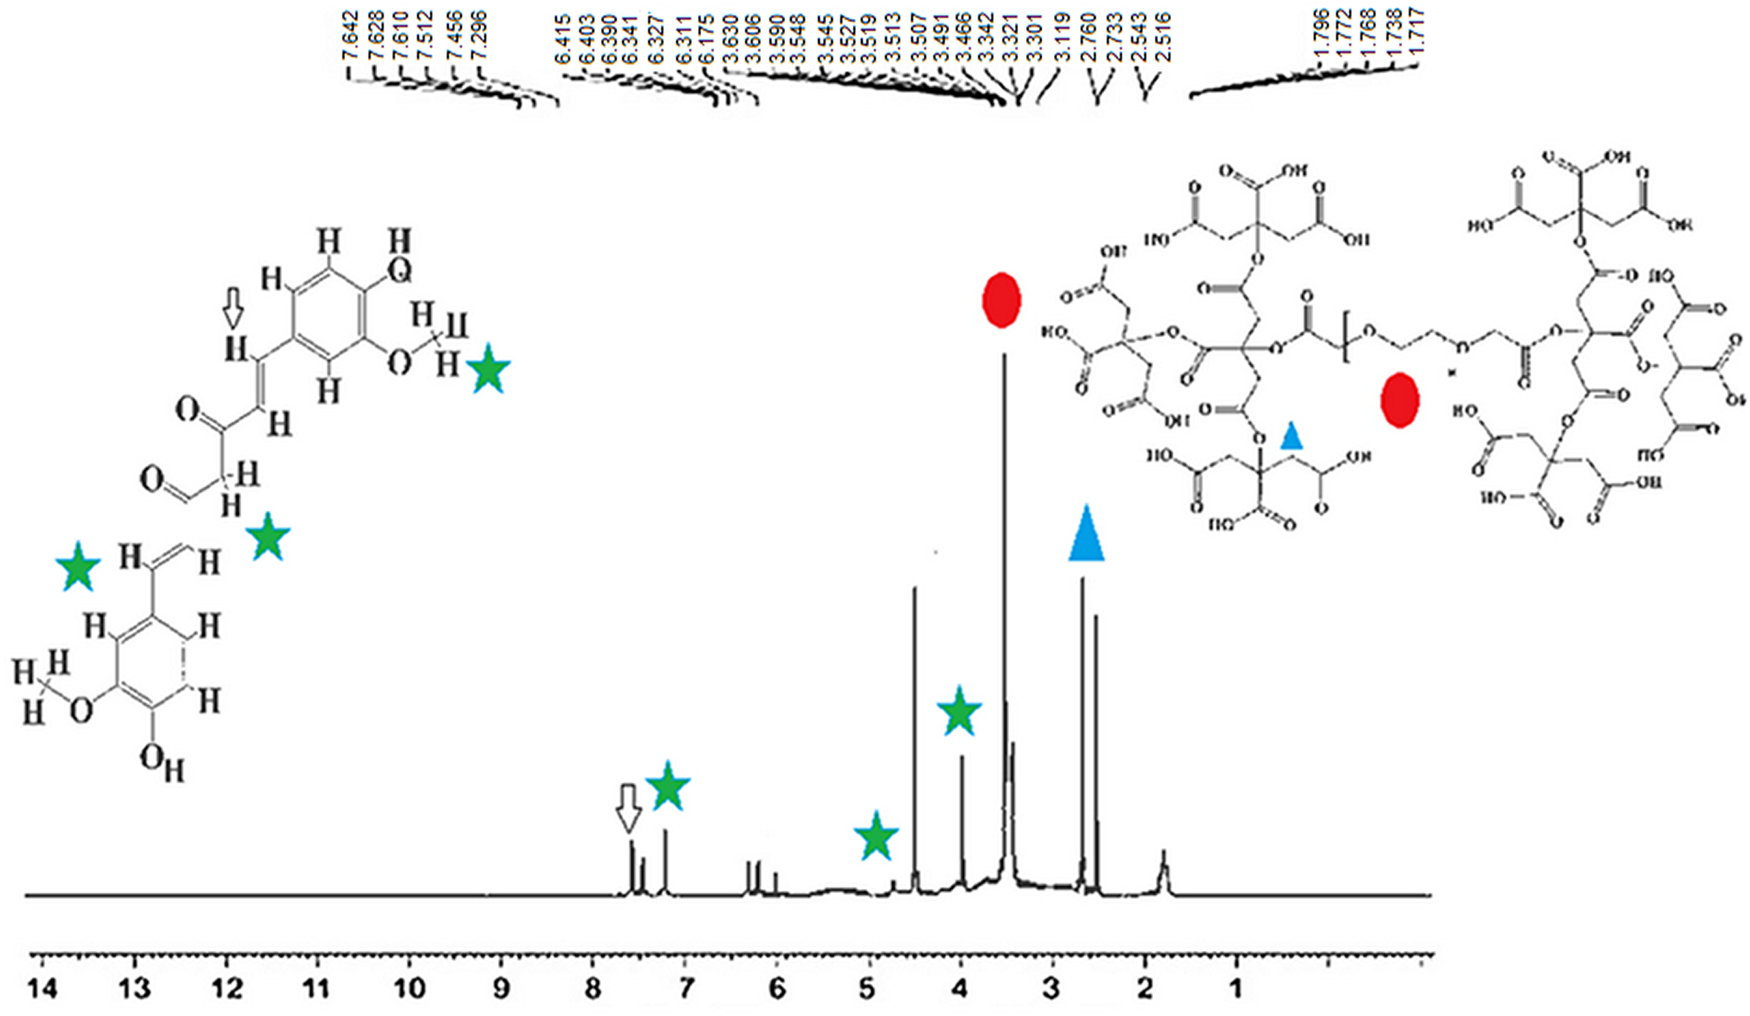
1H NMR spectroscopy was used to confirm the nanodendrimer–curcumin conjugate (NDC) as a nanocarrier. There were simultaneously two binary peaks in the region of 2.5–3.5 ppm that these peaks indicated the presence of citric acid. In addition, a hydrogen peak and curvature in the regions of 3.8 and 5.5 ppm indicated the presence of polyethylene glycol in the composition and also the synthesis of the dendrimer G2. The presence of curcumin and covalent conjugation of nanodendrimer to curcumin were confirmed by peaks in the region of 7.6–6.6 ppm (Fig. 4).
1H NMR spectra to confirm the covalent conjugation of nano-dendrimer to curcumin as the drug carrier (NDC).
Fourier-transform infrared (FTIR) spectroscopy
To confirm the structure of the synthesized nanocomposite (NDC-CQ), FTIR spectra were taken from different stages of synthesis. The peak at 2925 cm−1 belonged to the ester carbonyl group (−CO−) confirmed the synthesis of the dendrimer G2. Also, the presence of the peak belonging to the ester bond in the curcumin–dendrimer conjugate and the peaks belonging to dendrimer G2 and curcumin confirmed the conjugation (NDC). Broader absorbance peaks at 1590–1700 cm−1 clearly indicate that CQ was loaded into NCD (Fig. 5).
FTIR spectra of ND (A), NDC (B) and NDC-CQ (C). The distinct peaks for each compound are shown. As the picture shows, CQ is loaded into NDC-CQ.

Drug-loading efficiency
According to the standard chart of CQ and curcumin (Supplementary Fig. 1), drug-loading efficiency for the synthesized NDC-CQ was estimated to be 87%.
Drug release study
The results of the drug release study at 7.4 pH showed a controlled drug-release pattern for the synthesized NDC-CQ, so that 92% of loaded drug was released within 48 h (Fig. 6).
The cumulative release curve of NDC-CQ from NDC. As the graph shows, the pattern of drug-release from nanoparticles follows the slow release pattern.

Solubility and cellular uptake of the synthesized nanocomposite
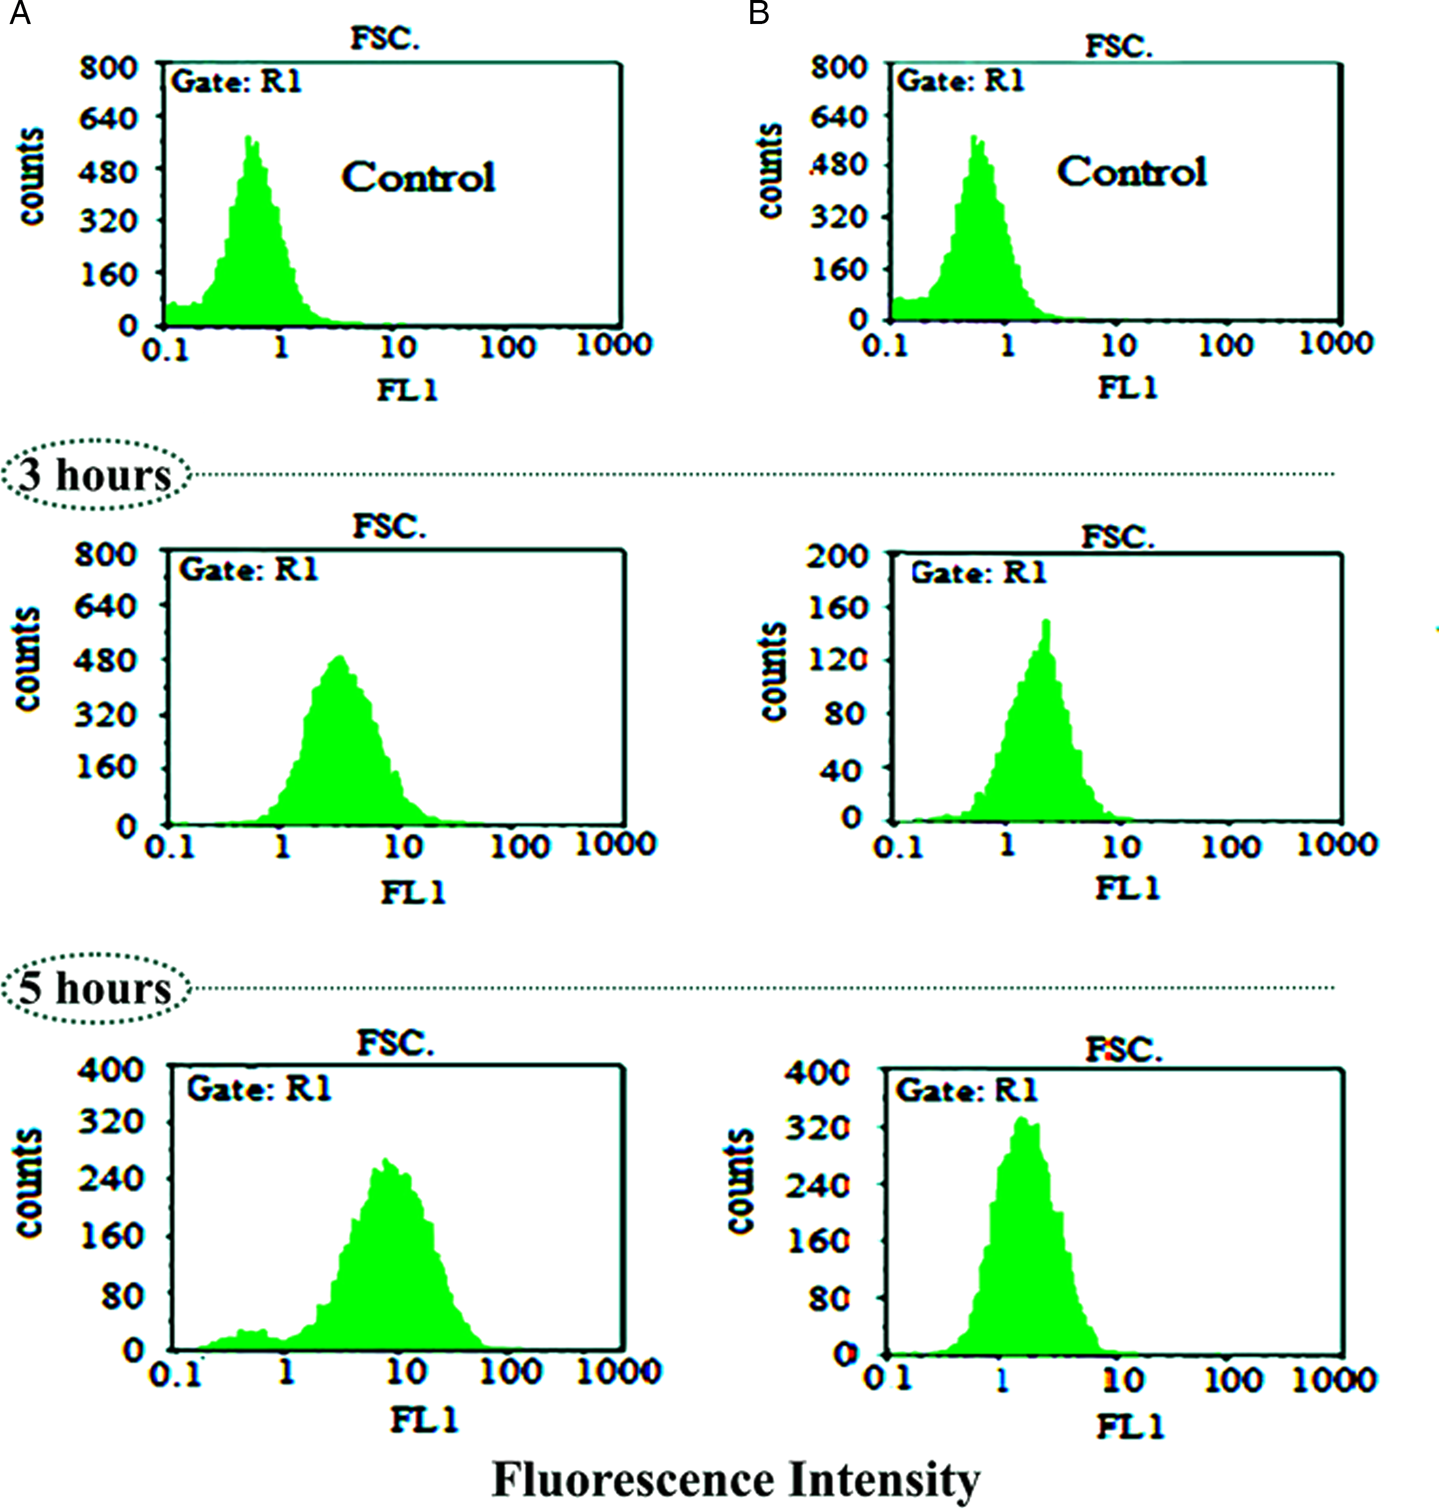
The highest absorbance (400 nm) was obtained by spectrophotometry and according to the obtained results, the solubility of free curcumin, CQ and NDC-CQ was estimated to be 1, 71 and 92%, respectively. Therefore, the synthesized nanocomposite significantly increased the solubility of curcumin and CQ in water (P < 0.05). FCM results showed that fluorescence intensity of cells exposed to higher concentration of the nanocomposite was significantly higher than that of free curcumin and with increasing drug-exposure times, the rate of drug entry into the cell increased (Fig. 7).
Evaluation of cellular uptake of NDC-CQ (A) and curcumin as a control (B) at different times by FCM.
Cytotoxicity activity
The results of the MTT assay on Vero cells are shown in Fig. 8. According to the diagram above, the toxicity of the synthesized NDC-CQ is 36% lower than that of CQ. The 50% cytotoxic concentration (CC50) of NDC-CQ was observed at a concentration of 70 μg mL−1, which was much higher than the concentration needed to inhibit the growth of P. falciparum (IC50: 1.52 μg mL−1) in the present study. Therefore, the synthesized nanocomposite at therapeutic dose had no toxic effect on Vero cells.
Percentage of survival of Vero cells exposed to synthesized NDC-CQ compared to CQ and the control group within 48 h. The viability effects showed that 20 μg mL−1 NDC-CQ and NDC were perfectly nontoxic on the Vero cells compared with the control group. The values are expressed as mean ± standard deviation from three independent experiments with P < 0.001.

Effects of nanocomposite on the lysis of human RBCs
The synthesized nanocomposite at the therapeutic dose had no hemolytic effect on the human erythrocytes used for culture of P. falciparum parasite (Supplementary Fig. 2).
Antiplasmodial activity of the nanocomposite
In order to evaluate the effect of the synthesized nanocomposite on P. falciparum parasite in culture medium, the number of live parasites in the medium was determined by microscopic and enzymatic methods (pfLDH). Analysis of the results showed that there was no significant difference between the above two methods in recording the results (P > 0.05). The number of P. falciparum parasites in the control group (placebo) was increased after 48-h incubation at 37°C (Table 1). Examination of microplate wells showed that the greatest cytotoxic effect of the NDC-CQ was at 2.5 μg concentration, which was able to eliminate 82.6% of the parasites compared to the control group. Whereas the cytotoxic effect of CQ at this concentration (2.5 μg) was 55%, that this difference was statistically significant (P < 0.05) (Table 1). According to the results presented in Table 1, the synthesized NDC-CQ had more inhibitory effect on P. falciparum parasites than the CQ and curcumin alone. Nonlinear regression was used to obtain the IC50 value of the synthesized nanocomposite using the obtained results, the IC50 value of the nanocomposite was 1.52 μg mL−1 (Supplementary Fig. 3).
The growth inhibition percentage of P. falciparum in different groups, in vitro

The similar letter in the table indicates that there is no significant relationship between the groups (P > 0.05).
*The difference between the microscopic and enzymatic (pfLDH) methods (the statistics were regarded significant at P < 0.05).
Metabolomics of P. falciparum in the presence of nanocomposite
The 1H NMR spectra of metabolites of P. falciparum ring stages in the testing groups compared with control groups are shown in Fig. 9. The analysis of the data showed that there was a significant difference between metabolites, of P. falciparum ring stages, in the control group and the group receiving nanocomposite. These changes were mainly in the metabolic pathways of pyrimidine, TCA cycle, glutathione metabolism, aminoacyl-tRNA biosynthesis and glyoxylate and dicarboxylate metabolism (Table 2). Metabolic changes of the parasites exposed to CQ, as drug control, are listed in Fig. 14. Comparison of the obtained results showed that the metabolites of flavin mononucleotide, L-tyrosine and L-glutamine were changed only in the group receiving NDC-CQ, whereas in the group receiving CQ, these metabolites were unchanged. Therefore, 12 and 8 new metabolic pathways were induced, in P. falciparum, in the group receiving NDC-CQ compared to the control group and compared to the group receiving CQ (drug control), respectively (Figs 10–12).
Superimposed spectra of NDC-CQ treated P. falciparum.

PLS-DA scores plot showing the separation of two groups (the control group and test group receiving the IC50 dose of NDC-CQ).

Important features identified by PLS-DA. In VIP scores, the chemical shifts of the metabolites in the test group are shown in green (a decrease in metabolites) and red (an increase in metabolites).

Loadings plot for the selected PCs. In the loading plot the categorization of the two control and test groups is indicated by deleting the low value data, without changing the original meaning of the data. The chemical shift of the metabolites, that has the most changes relative to the centre of the plot, is determined.

Differentiating metabolites and pathways in the control and treated P. falciparum with IC50 dose of CQ and NDC-CQ

Total, total number of compounds in the pathway; Hits, the actual matched number from data uploaded by user; Raw P, the P value derived from enrichment analysis; Holm P, the P value adjusted using Holm–Bonferroni method; FDR P, the P value adjusted using false discovery rate; Impact, the pathway impact value derived by pathway topology analysis.
The table above incorporates the detailed results from pathway analysis. The statistical P values from enrichment analysis are further adjusted for multiple testing to accommodate for many pathways that are tested simultaneously.
This shows the detailed results from the pathway analysis using over representation analysis with the hypergeometric test. Since many pathways are tested at the same time, the statistical P values from enrichment analysis are further adjusted for multiple testings. The total/maximum importance of each pathway is 1; the importance measure of each metabolite node is actually the percentage w.r.t the total pathway importance, and the pathway impact value is the cumulative percentage from the matched metabolite nodes. In the table the column named as Total is the total number of compounds in the pathway; the Hits are the actually matched number from the user uploaded data; the Raw P is the original P value calculated from the enrichment analysis; the impact is the pathway impact value calculated from pathway topology analysis. In Fig. 13 the circles higher, bigger and closer to the y axis are of greater importance. Metabolic changes of the parasites exposed to NDC-CQ are listed in Table 3 (Namazi and Adeli, Reference Namazi and Adeli2003).
Pathway analysis of the groups receiving NDC-CQ. Pathway analysis showing all matched pathways according to P values from pathway enrichment analysis and pathway impact values from pathway topology analysis.

Metabolites with their chemical shifts were identified from HMDB

Discussion
The method used to synthesize PEG dendrimers in previous studies was time consuming and costly and in addition, toxic substances such as dichloromethane and pyridine were used in its synthesis (Namazi and Adeli, Reference Namazi and Adeli2003; Namazi and Adeli, Reference Namazi and Adeli2005). However, in the present study, a new method was used to synthesize nano-PEG, which in addition to using substances with very low toxicity such as DCC and EDC as activators, instead of using dichloromethane and pyridine toxicants, the reaction time and also the time to reach the product were significantly reduced.
Jafari Iri Sofla et al. (Reference Jafari Iri Sofla, Rahbarizadeh and Ahmadvand2015) showed that poly(amidoamine)dendrimers (PAMAM), at a concentration of 1000 μg mL−1, were toxic to BT-474 cells and Hung et al. (Reference Hung, Hung, Chang, Dai, Li, He, Chen, Huang, Wei, Jia and Yeh2011) found that unmodified poly(amidoamine) dendrimers cause pores in cell membranes and cell death. The results of a study showed that the G2 dendrimer was less toxic to MCF-7 cells than other dendrimer generations (G1, G3 and G4) (Pan et al., Reference Pan, Cui, Xu, Huang, Li, He and Gao2007). The MTT results of the present study also confirmed the non-toxicity of this dendrimer and indicated that the synthesized nano-carrier had/has no toxicity to Vero cells up to high concentrations (100 μg mL−1).
The solubility and biological activity of curcumin and chloroquine in water increased with the help of nanocarriers used in this study. According to the study by Alavidjeh et al. (Reference Alavidjeh, Haririan, Khorramizadeh, Ghane, Ardestani and Namazi2010), PEG, which is the core of this dendrimer, is not only fully biocompatible but also highly water soluble. This polyether compound, with citric acid side branches which have a negative charge, is not toxic to cell and is completely soluble in water. These nanocarriers, in addition to solubilizing the drug in water, protect the curcumin and chloroquine by further stabilizing the drug against degradation, which is consistent with the study by Erfani-Moghadam et al. (Reference Erfani-Moghadam, Nomani, Najafi, Yazdani and Sadeghizadeh2014). When the biodegradability of these dendrimers was studied by Alavidjeh et al., they found that second-generation dendrimers (G2), under enzymatic conditions, are biodegradable in the cell and can be metabolized and excreted by other cell processes (Alavidjeh et al., Reference Alavidjeh, Haririan, Khorramizadeh, Ghane, Ardestani and Namazi2010).
The adsorption kinetics studies of the nanocomposite using FCM and fluorescence microscopy are possible due to the intrinsic fluorescence characteristics of curcumin. In the present study, due to the presence of curcumin–dendrimer conjugate in the synthesized nanocomposite, a 4-fold increase in the cellular uptake of curcumin was observed (80% cellular uptake of curcumin conjugate in the composite compared with 20% cellular uptake of free curcumin). This increase in uptake appears to be due to the increased solubility of curcumin, due to the presence of dendrimer, and dendrimer entry into the cell by endocytosis, as for other nanoparticles also, the involvement of endocytosis in cellular uptake has been identified (Sahu et al., Reference Sahu, Kasoju and Bora2008). Also, the results of the present study showed that the cellular uptake of the nanocomposite was time dependent. Babaei et al. (Reference Babaei, Sadeghizadeh, Hassan, Feizi, Najafi and Hashemi2012) have also reported a time-dependent cell uptake of dendrosomal nanocurcumin.
One of the problems of using drug–nanocarrier conjugates is the rapid release of drug and elimination of the drug before reaching the target tissue, but in the present study, the synthesized nanocomposite showed slow release behaviour and provided longer-term protection for the drug. Given that combination therapies are now used to treat a variety of diseases, including malaria, and according to the WHO recommendation of using natural herbal medicines which can be useful and more effective due to its lower side-effects (Elmi et al., Reference Elmi, Gholami, Azadbakht and Ziaei2014). Therefore, in the present study, curcumin was used as a natural compound for the preparation of the NDC conjugate and to increase the effect of the synthesized nanocomposite, chloroquine was loaded into the complex (NDC-CQ) as a novel antimalarial drug. In the studies by Cui et al. (Reference Cui, Miao and Cui2007) and Reddy et al. (Reference Reddy, Vatsala, Keshamouni, Padmanaban and Rangarajan2005) IC50 values of curcumin on P. falciparum in vitro (culture medium) were reported 24.69 ± 0.47 and 5 μ m, respectively. However, in the present study, IC50 values for curcumin alone and for curcumin conjugated to the G2 dendrimer (NDC) were 12 and 9 μg mL−1 (32 and 24 μ m), respectively. Therefore, nanodendrimer G2 has increased the effect of curcumin on Plasmodium parasite, by increasing the solubility of curcumin, which confirms the study by Debnath et al. (Reference Debnath, Salloum, Dolai, Sun, Averick, Raja and Fata2013) in this study they showed that the dendrimer increased the solubility of curcumin and also its anticancer activity. Many investigations have been performed around the world on different nanocarriers and nanodrugs to achieve the suitable drug in the fight against malaria including the study by Panneerselvam et al. (Reference Panneerselvam, Ponarulselvam and Murugan2011). The results from this study showed that the synthesized silver nanoparticles at a concentration of 100 μg mL−1 removed 83% of P. falciparum parasites. By nanosizing decoquinate, Wang et al., (Reference Wang, Li, Reyes, Zhang, Zeng, Zhang, Xie, Lee, Roncal, Melendez, Hickman and Kozar2014) were able to reduce its effective dose rate on hepatic forms of P. berghei (from 20 to 1.25 mg kg−1), which led to a decrease in drug toxicity. According to Jawetzs law on antimicrobial combination, the combination of two drugs may have synergistic, additive or antagonistic effects (Sonne and Jawetz, Reference Sonne and Jawetz1969). The results of study by Oyeyemi et al. (Reference Oyeyemi, Morenkeji, Afolayan, Dauda, Busari, Meena and Panda2018) showed that the combination of curcumin and artemisinin has a synergistic effect.
The results of the present study also showed that chloroquine, as a drug to treat malaria, with NDC, as a natural herbal compound, had a better effect than the drugs alone, so that the obtained NDC-CQ at a concentration of 2.5 μg mL−1 prevented the growth of P. falciparum parasites (82.6%) in the culture medium, which was more than the sum of inhibitory effects of chloroquine (55.6%) and curcumin (15.5%) alone. Therefore, the effect of chloroquine and curcumin together on the nanocomposite is greater than the effect of chloroquine and curcumin alone, which may be due to the synergistic effect of these two compounds on each other.
In study by Neto et al. (Reference Neto, Machado, Lindeza, do Rosário, Gazarini and Lopes2013), which is consistent with our study, the results showed that the use of antimalarial drugs combined with curcumin is more effective than the use of these drugs alone.
In the present study, the metabolic cycles of parasite before and after exposure to NDC-CQ were investigated by the 1H NMR method, for the exact evaluation of the effect of the synthesized nanocomposite on plasmodium parasites. The metabolites and altered metabolic pathways, in the present study, are presented in Tables 2 and 3.
The results showed that the metabolic cycle of glyoxylate and dicarboxylate exhibited the greatest change compared to the control group, which is consistent with the study by Han et al. (Reference Han, Huang, Nan and Zhong2009) on artemisinin. Therefore, synthesized NDC-CQ and artemisinin affect the common metabolic cycle, which may indicate the similar effects of the two drugs, which of course, needs further investigation.
In the present study, the metabolites of L-glutamine were affected by the metabolic pathway of glyoxylate and dicarboxylate. Various studies have shown that in Plasmodium-infected red blood cells, glutamine is converted to glutamate, that the reaction is catalysed by glutaminase and 7-glutamyl-transpeptidase. According to the study by Elford et al. (Reference Elford, Haynes, Chulay and Wilson1985), the glutamine level can be associated with the lysis of erythrocytes by the parasite. Our study also showed an increase in the amount of glutamine compared to the control group, which is consistent with the above study. On the other hand, according to a study, the amount of glutamine is effective in invasion of red blood cells by parasites (Vilmont et al., Reference Vilmont, Azoulay and Frappier1990).
Another altered metabolic pathway in the present study was nitrogen metabolism which, like glyoxylate and dicarboxylate metabolism pathways, altered the metabolism of L-glutamine. The third altered metabolic pathway was riboflavin metabolism. The study by Akompong et al. (Reference Akompong, Ghori and Haldar2000) showed that the riboflavin cycle is involved in asexual development and production of food vacuoles of P. falciparum. The results of their study showed that riboflavin plays a role in the production of hemozoin and the rate of haemoglobin consumption by the parasite. Therefore, it could be a suitable drug target in the future to combat malaria caused by P. falciparum.
A study, by Parvazi et al. (Reference Parvazi, Sadeghi, Azadi, Mohammadi, Arjmand, Vahabi, Sadeghzadeh and Zamani2016) on cinnamon extract showed that it leads to changes of succinic acid, glutathione and β-alanine metabolites in the parasite extract, which was not seen in our study. This could be due to the fact that the nanodendrimer contained both CQ and curcumin whereas Parvazi et al. had used cinnamon extract alone and therefore, the differences in the metabolic cycle obtained from the study by Parvazi et al., and the present study may be due to differences in the nature of the drugs used in these two studies.
Another metabolic pathway modified by synthesized NDC-CQ was aminoacyl-tRNA biosynthesis. According to the study of Nyamai and Tastan Bishop (Reference Nyamai and Tastan Bishop2019), this metabolic pathway in addition to synthesizing the first enzyme required for protein translation and amino acid catalysis, is different in humans and the parasite Plasmodium. Therefore, it is considered as a suitable drug target for antimalarial drug development. The nucleus of P. falciparum has two codes for methionyl tRNA synthetase, which are called pfmrscy and pfmrsapi. For many years, this enzyme has been known as a target for anti-bacterial, anti-fungal drugs.
In recent years, many investigations have been carried out on this enzyme, as a drug target, in eukaryotes (Hussain et al., Reference Hussain, Yogavel and Sharma2015), because of the importance of this topic, James et al. investigated the synthesis of amino-acyl tRNA in eukaryotic parasites (Turner et al., Reference Turner, Graziano, Spraggon and Schultz2006). Since the parasitic t-RNA synthetase has a soluble crystalline structure, it can be a suitable target for anti-parasitic drugs, including drugs against P. falciparum malaria (Pham et al., Reference Pham, Dawson, Jackson, Lim, Pasaje, Turner and Ralph2013). In the future, it is hoped that this enzyme may be used as a target for anti-parasitic drugs.
Another important metabolic cycle that changed in the present study was the TCA cycle.
The study by Ginsburg (Reference Ginsburg2010) showed that the blood stage of the parasite requires the TCA cycle, for glucose fermentation to produce energy, and has the enzymes needed for this cycle. The results of the study by Olszewski et al. (Reference Olszewski, Mather, Morrisey, Garcia, Vaidya, Rabinowitz and Llinás2010) showed that the metabolism of the Krebs cycle in P. falciparum is greatly separated from glycolysis. The main carbon sources for the Krebs cycle are aspartate, asparagine, glutamate and glutamine amino acids, which are created by the breakdown of the haemoglobin molecule, are then deaminated and converted to oxaloacetate or alpha ketoglutarate. They believed that the Krebs cycle in the parasite P. falciparum is not like a cycle but rather has a branched structure with several reactions which act in the opposite direction of the standard pathway of the Krebs cycle (Olszewski et al., Reference Olszewski, Mather, Morrisey, Garcia, Vaidya, Rabinowitz and Llinás2010), but this theory has been rejected (Olszewski and Llinas, Reference Olszewski and Llinas2011).
The NDC-CQ compared with the negative control group caused metabolic changes in pathways, as shown in Table 2. Changes in some metabolic pathways, such as glyoxylate, dicarboxylate, glutathione, thiamine and citrate cycles (TCA cycles), were observed in the NDC-CQ and drug control group (CQ) (Fig. 14). Due to the use of CQ in the NDC-CQ, the obtained results were consistent with predictions. The alterations in the metabolic pathways (terpenoid backbone biosynthesis, pyruvate metabolism and glycolysis or gluconeogenesis) in the CQ recipient group and not altering of these metabolic pathways in the NDC-CQ group were on the other hand unexpected. Due to the use of CQ in the structure of the NDC-CQ, it was expected that all of the metabolic pathways of the CQ group would also be altered in the NDC-CQ group. However, the investigation of altered metabolites in these pathways revealed that only pyruvic acid metabolite was affected by the mentioned pathways. Since pyruvic acid has been altered by other pathways, such as the metabolism of thiamine and the citrate cycle (TCA cycle), therefore the NDC-CQ, similar to CQ, has led to changes in pyruvic acid metabolite but from other metabolic pathways.
Pathway analysis of the groups receiving CQ.

In this study, 1H NMR spectroscopy was used with untargeted metabolomics to study the effect of the nanocomposite on P. falciparum in vitro. Targeted metabolomics using LC-MS would help deepen the understanding about the drug targets effected by the nanocomposite, by identification of drug targets and by allowing detailed characterization of modes of action and resistance of existing and novel antiprotozoal drugs. The metabolic pathways altered by the synthesized nanocomposite were different from the ones exhibited by other drugs.
Conclusion
With regard to the better effect of the synthesized nanodrug on P. falciparum in the culture medium compared to CQ, this nanodrug can be considered as an effective anti-Plasmodium compound that more comprehensive research studies in this area are recommended. On the other hand, a more thorough review of metabolites for understanding the life cycle of malaria parasites in the host may be helpful, because it will lead to the identification of effective pathways and metabolites induced by the drug (drug intended to prevent malaria) and also reveal the involvement of new interveners in the fight against malaria.
Supplementary material
The supplementary material for this article can be found at https://doi.org/10.1017/S0031182020000372.
Acknowledgements
The authors would like to thank the Pasteur Institute of Iran for carrying out the in vitro studies involving the culture of P. falciparum.
Financial support
The authors would like to thank the Iran University of Medical Sciences for providing the necessary funding for this research.
Conflicts of interest
The authors declare that they have no conflicts of interest.
Ethical standards
Performing the procedures required for the study was approved by the Ethical Committee of the Faculty of Medicine (Iran University of Medical Sciences). The code of: IR.IUMS.FMD.REC.1396. 9321577004 was designated for the study which was in accordance with the Declaration and Guidelines.



