

Introduction
The spectre of a new era of authoritarianism is looming large at the horizon. During the 1980s and the 1990s, the debate on regime change has mainly focused on the so-called ‘third wave of democratization’ (Huntington, Reference Huntington1991). Starting from the mid-2000s, scholars have been increasingly alert to the risk of a reverse wave of autocratization. Early ‘worrisome signs’ (Puddington and Piano, Reference Puddington and Piano2005) soon turned into more alarming claims regarding the acceleration of an erosion process (Puddington, Reference Puddington2010) and the beginning of ‘a mild but protracted democratic recession’ (Diamond, Reference Diamond2015; see also Mechkova et al., Reference Mechkova, Luehrmann and Lindberg2017). Freedom House considers 2017 as the 12th consecutive year of worldwide decline in political freedom, the worst decline in years according to the Economist Intelligence Unit.
While autocratization in the interwar and post-World War II periods has been extensively studied (Linz and Stepan, Reference Linz and Stepan1978; Berg-Schlosser and Mitchell, Reference Berg-Schlosser and Mitchell2002; Bermeo Reference Bermeo2003), we know relatively little about its contemporary manifestation. To be sure, studies on the recent cases are proliferating, but most of them focus either on single countries or on small-N regional samples. Moreover, uncertainty remains about what the opposite of democratization consists in, how many distinct forms it can take, and consequently whether the cases studied are different instances of the same phenomenon or different phenomena.
The shortage of cross-regional comprehensive analyses and the confusion concerning what should and should not be considered evidence of a process opposite to democratization hamper the accumulation of knowledge in this relatively young field of study. Most importantly, we fail to seize the actual import and urgency of the problem. Are these processes of regime change growing in number and frequency? What specific forms does autocratization take in the post-Cold War era, and how does it differ from the past? What are the regions most affected by this syndrome? To address these questions, this article offers one of the first cross-regional studies on the prevailing patterns of contemporary processes opposite to democratization. We proceed as follows, in particular.
In the first and second sections, we elaborate a framework for the comparative analysis of the processes opposite to democratization. This framework builds on the notion of autocratization, which we adopt as an umbrella concept for all the processes of regime change that share a direction towards autocracy. We identify six regime transitions that can be considered as many forms of autocratization, and classify them based on the quality and quantity of the change involved and on the modes of regime change opposite to democratization, that is, the various ways in which it may happen. The remaining of the article presents and analyses new data on the cases, forms and modes of post-Cold War processes of autocratization across the world. Specifically, Section 3 describes the data collection process. We identify 46 episodes of autocratization occurred between 1990 and 2015, in particular. Focusing on these cases, we track geographical and temporal trends, in Section 4. The final section wraps up the main findings.
The analysis confirms that autocratization represents an increasingly relevant political phenomenon, especially in sub-Saharan Africa, Latin America, Asia and the post-communist world. Moreover, autocratization tends to take different forms in different regions, and to ‘evolve’ through time. Often, finally, contemporary processes of autocratization unfold through combinations of multiple modes.
What is autocratization?
After the publication of Linz and Stepan's (Reference Linz and Stepan1978) pioneering research on democratic breakdown in interwar and post-World War II Europe and Latin America, the processes of regime change opposite to democratization have received relatively little attention. During the 1980s and the 1990s, scholars mainly focused on the so-called ‘third wave of democratization’ (Huntington Reference Huntington1991), that is, the sequence of democratic transitions occurred in Southern Europe, Latin America, Asia, communist countries and sub-Saharan Africa during the last part of the 20th century (O'Donnell and Schmitter, Reference O'Donnell and Schmitter1986; Diamond et al., Reference Diamond, Linz and Lipset1989; Przeworski, Reference Przeworski1991; Linz and Stepan, Reference Linz and Stepan1996, among others). Subsequently, attention shifted to the flaws of many new democracies (Merkel, Reference Merkel2004) and the emergence of a ‘grey zone’ (Carothers, Reference Carothers2002) populated by hybrid regimes (Diamond, Reference Diamond2002; Schedler, Reference Schedler2006; Levitsky and Way, Reference Levitsky and Way2010).
Since the mid-2000s, the processes of regime change opposite to democratization have re-gained attention. However, this strand of the literature remains rather dispersed, due to a prevalence of analyses on post-Cold War cases that focus on either single countries or small-N regional samples (Fish, Reference Fish and Anderson2001; Berg-Schlosser, Reference Berg-Schlosser2008; Adebanwi and Obadare, Reference Adebanwi and Obadare2011; Kneuer, Reference Kneuer, Erdmann and Kneuer2011; Stefes and Sehring, Reference Stefes, Sehring, Erdmann and Kneuer2011; Agh, Reference Agh2015; Kornai, Reference Kornai2015; de la Torre and Ortiz Lemos, Reference de la Torre and Ortiz Lemos2016). Cross-regional analyses are rare (but see Tomini, Reference Tomini2017).
A related problem, which similarly hampers the mutual recognition among scholars engaged in the analysis of the phenomenon and our ability to seize the actual import of the phenomenon, refers to the lack of a shared definition of what a process opposite to democratization consists in, and of how many distinct forms it can take. It is not clear whether the recent cases that have been studied are different instances of the same phenomenon or different phenomena. Scholars disagree on whether changes from democracy to autocracy, transitions that do not lead to closed autocracy, and transformations involving hybrid regimes that are neither fully democratic nor entirely autocratic should be all considered evidence of a process opposite to democratization, in particular (for a review: Cassani and Tomini, Reference Cassani and Tomini2018).
To address the shortage of cross-regional comparative analyses of the phenomenon and the confusion concerning what should and should not be considered evidence of a process opposite to democratization, our analysis builds on the notion of ‘autocratization’, which we use as an umbrella concept arching over any process of regime change towards autocracy. Regime change is a transformation in the formal and informal institutions that regulate how to assign and exercise political authority in a country (Eckstein and Gurr, Reference Eckstein and Gurr1975). More specifically, we identify in political participation, public contestation and executive limitation three relevant institutional dimensions of regime variance (Dahl, Reference Dahl1971; Diamond, Reference Diamond1999). Accordingly, autocratization is a process of regime change towards autocracy that makes the exercise of political power more arbitrary and repressive and that restricts the space for public contestation and political participation in the process of government selection.
Mainly defined by the direction of change, various regime transitions fall under the umbrella concept of autocratization. Resting on a widely used fourfold regime spectrum (Diamond, Reference Diamond2002; Lindberg, Reference Lindberg2009; Luehrmann et al., Reference Luehrmann, Tannenberg and Lindberg2018, among others) that ideally lies along a democracy–autocracy continuum and that includes liberal democracy, defective democracy, electoral autocracy and closed autocracy, in that order, we identify six main forms that autocratization can take. More specifically, the following six regime transitions share the core requirement of going towards autocracy: (1) liberal democracy → closed autocracy; (2) liberal democracy → electoral autocracy; (3) liberal democracy → defective democracy; (4) defective democracy → closed autocracy; (5) defective democracy → electoral autocracy; (6) electoral autocracy → closed autocracy.
The six transitions correspond to alternative combinations of the political regimes that can suffer autocratization and of the regimes that can be installed as a consequence of this process. The three main institutional dimensions of regime variance – that is, political participation, public contestation and executive limitation – help explain in what the different forms of autocratization mainly consist.
Transitions to closed autocracy are invariably a consequence of events that significantly limit political participation, that is, citizens’ possibility to influence government selection. Limiting political participation triggers autocratization in both liberal democracies, defective democracies and electoral autocracies. In turn, transitions to electoral autocracy result from political events that restrict public contestation, but do not significantly compromise political participation. Restricting public contestation triggers autocratization only in liberal and defective democracies, that is, in polities that guarantee citizen right to criticize the government and to replace it. Finally, transitions to defective democracy imply measures that weaken executive limitation in a country, whereas politics remains sufficiently competitive and participatory. Weakening executive limitation triggers autocratization only in liberal democracies, that is, in countries in which the boundaries within which an incumbent ruler exercises his/her political authority are well defined and enforced.
To be sure, the way we conceptualize the processes opposite to democratization differs from others in the literature, including the idea of ‘democratic backsliding’ (Bermeo, Reference Bermeo2016; Waldner and Lust, Reference Waldner and Lust2018). While much depends on the research focus, autocratization outperforms democratic backsliding as a conceptual tool to analyse these processes of regime change for several reasons, in our view.
First, the emphasis that the notion of democratic backsliding puts on the point of departure of a process opposite to democratization is fraught with normative assumptions regarding the loss of something ‘good’ and the return to a previous, arguably ‘worse’ or ‘primitive’ status. Putting our personal opinions about the intrinsic desirability of democracy aside, these should be more correctly framed as research questions. We should verify, rather than assume, whether regime change opposite to democratization re-installs (or bring ‘back’) a previously existing regime in a country, if it leads to a form of non-democratic rule that the country under examination has never experienced before and, in both cases, the performance of the new regime.
On the contrary, by stressing the direction of change, autocratization draws attention not only to the pars destruens of a process of regime change, or the end of an existing regime, but also to its pars construens, that is, the installation of a new regime. Concerning the latter, moreover, it identifies and differentiates between the possible points of arrival. In our view, this is the most valid way to conceptualize the opposite of democratization, a notion that similarly stresses the direction rather than the point of departure of regime change, and that remains similarly open-ended concerning its outcomes (Whitehead, Reference Whitehead2002, 32).
As a second difference, backsliding is often understood as sensitive to even minor changes in terms of political participation, public contestation and executive limitation (Waldner and Lust, Reference Waldner and Lust2018).Footnote 1 On the contrary, our typology of autocratization admittedly shoehorns complex political developments into predefined regime categories, thus discarding transformations that might represent a shift towards autocracy but do not amount to an outright change in the formal and informal institutions regulating how political power is assigned and exercised. Given the cross-regional scope of this work, we see selectivity as an advantage. While we do not mean to downplay the implications that even minor shifts towards autocracy can have for citizens, we prefer to interpret them as early warning signals of an outright process of autocratization, which could or could not take place.
Finally, autocratization represents an umbrella concept that helps recognize a rather broad range of processes of regime change that may differ in several respects as fundamentally similar, which is essential for comparative research. We expect our approach to appear loose to some readers, given that our definition of autocratization encompasses even regime changes that do not result in the installation of an autocratic regime, such as transitions from liberal democracy to defective democracy. Once again, one may consider the notion of ‘democratic backsliding’ fitting these regime changes in a better way. However, considering these transitions as a form of autocratization is consistent with a definition that puts the emphasis on the direction of regime change. Just as democratization applies even to ‘political systems that do not become fully democratic’ (Huntington, Reference Huntington1991, 15), the opposite process does not necessarily lead to full autocracy. Hence, the breadth that characterizes the notion of autocratization matches with the breadth informing the opposite concept of democratization.
Most importantly, by considering transitions from liberal democracy to defective democracy as a form of autocratization, we do not disregard the differences that exist between these and other regime transitions that fall under the same label. Quite the contrary, we lay the foundations for examining these differences, as the next section clarifies.
Comparative autocratization: quality, quantity and modes of regime change towards autocracy
The six regime transitions that fall under the umbrella concept of autocratization share the direction of change, but differ in many respects. To frame the comparative analysis of the various forms that autocratization can take, we highlight three main sources of variance, which we deem of primary importance. Specifically, we focus on the quality of the change that a process of autocratization involves, the quantity, and the mode(s). Quality and quantity, which represent two alternative mainstream approaches to conceptualize political regimes and changes across them (Sartori, Reference Sartori1987; Collier and Adcock, Reference Collier and Adcock1999), help classify the processes of autocratization, based on their points of departure and arrival. In turn, the modes of autocratization refer to the different ways in which a process of autocratization may take place.
The qualitative approach to the conceptualization of political regimes rests on the idea that a fundamental difference exists between democracy and autocracy. Hence, we should consider whether autocratization implies a change from democracy to autocracy. We distinguish ‘radical’ from ‘moderate’ autocratization, in particular. Autocratization is radical when democracy becomes autocracy. Otherwise, autocratization is moderate. Accordingly, transitions from either liberal democracy or defective democracy to either electoral autocracy or closed autocracy are all cases of radical autocratization. Transitions from liberal democracy to defective democracy and from electoral autocracy to closed autocracy represent moderate forms of autocratization, instead, even if the two differ from each other in many respects.
According to the quantitative approach, differences between political regimes are matters of degree. Hence, we should evaluate how autocratic a polity becomes following a process of autocratization. Even if quantity is a continuous measure, we set a threshold that separates ‘full’ from ‘partial’ autocratization. Whenever a closed autocracy is installed, a country is said to undergo full autocratization. In turn, transitions from liberal democracy to defective democracy and from either liberal democracy or defective democracy to electoral autocracy represent forms of partial autocratization, although we agree that the chosen threshold disregards differences concerning the degree to which autocratization can be partial.
The modes of autocratization, in turn, can be catalogued in several ways. A first raw distinction can be made between processes of autocratization that unfold through rupture or reform, respectively, corresponding to abrupt and incremental regime changes towards autocracy. For instance, O'Donnell (Reference O'Donnell, Mainwaring, O'Donnell and Valenzuela1992), Schmitter (Reference Schmitter1994) and Schedler (Reference Schedler1998) distinguish ‘quick’, ‘rapid’ and ‘sudden’ regime breakdowns from ‘slow death(s)’ and ‘lingering demise(s)’. In a similar way, Lueders and Lust (Reference Lueders and Lust2018) separate regime breakdown from regime backsliding. This binary classification points to a meaningful distinction concerning the duration and/or the intensity of regime change, but tells relatively little about how the processes of autocratization unfold in practice.
Bermeo (Reference Bermeo2016) compiles a more detailed list that encompasses three varieties of coups d’état, arguably abrupt modes of autocratization, and three varieties of less disruptive modes of autocratization. The former include open-ended coups, promissory coups and executive coups. The latter include executive aggrandizement, election-day fraud and electoral manipulation. This otherwise meritorious classificatory effort does not perfectly fit with our definition of autocratization, nor with the focus and the goals of our analysis, though. First, Bermeo's categories are sometimes ambiguous concerning the fundamentum divisionis. As an example, distinguishing between promissory and open-ended coups is more about the goals than the modes of autocratization. Moreover, even the author questions the validity of this distinction, when she notices that promissory coups seldom lead to new elections within a reasonable span of time. Finally, she observes that blatant electoral fraud and coups are increasingly rare, while cases of executive aggrandizement and electoral manipulation are growing in frequency. Hence, Bermeo's classification is mainly useful in diachronic comparisons between contemporary and past processes of regime change towards autocracy, whereas our analysis focuses on the post-Cold War period.
Given the lack of classificatory frameworks adequate to our research, we derive an alternative classification of autocratization modes based on our definition, and disentangle the different ways in which the exercise of political power can be made more arbitrary and repressive and in which the space for public contestation and political participation can be restricted. To do this, we should reconsider the three institutional dimensions that frame the above definition.
Participation refers to citizens’ possibility to influence the process of leadership selection. Hence, it depends on institutions such as elections, universal suffrage and multipartyism. In turn, public contestation is the possibility to criticize the conduct of the government and to compete for replacing it. Hence, it mainly relates to the fairness of elections and the protection of the freedoms of expression, information, organization and assembly. Finally, executive limitation refers to the boundaries within which an incumbent ruler exercises his/her political authority, to the level of arbitrariness she/he enjoys in making decisions, and relatedly to the protection of citizens against the ruler's abuses. Hence, it has primarily to do with the mechanisms of horizontal accountability and the protection of citizen rights against the ruler's abuses.
Accordingly, we identify the following five categories of autocratization modes: military intervention, electoral process manipulation, political rights violation, civil liberties restriction and horizontal accountability loosening. These categories result from an attempt to find a balance between exhaustiveness, mutual exclusiveness, specificity and parsimony. Each category encompasses multiple specific ways in which the institutional dimensions of political participation, public contestation and executive limitation can be reshaped in an autocratic sense, as detailed below.
Military interventions imply an active role of the army in the process of autocratization of a country. The army can intervene either of its own accord to overthrow an elected government, or on the initiative of a civilian chief executive, who declares the state of emergency in the context of a self-coup. Military interventions represent quite disruptive events that have especially harmful implications in terms of political participation and public contestation. However, military interventions do not necessarily lead to the installation of a non-elected government, but to new elections. Moreover, coups can fail. We also consider interventions of paramilitary groups and rebel forces.
The manipulation of the electoral process encompasses all those actions that relate to the conduct of elections. These include restrictions to universal suffrage, ballot stuffing, vote buying and irregularities in voter and candidate registration, in the vote counting and in the accessibility of the polling stations. This category also covers subtler modifications of the electoral rules, such as interfering in the work of the electoral management body, undermining its autonomy, removing presidential term limits, redrawing electoral districts, tuning the electoral threshold and postponing elections for long periods. So defined, the manipulation of the electoral process has its most severe consequences on political participation and on the component of public contestation more directly related to electoral competition.
Differently from the previous category, the violation of political rights encompasses all the measures that do not directly relate to elections, but that nonetheless influence political participation and public contestation in a country. These include limitations to the freedom of association, assembly, expression and information. The latter refer to all the legal, financial and informal actions against the pluralism in the press and other media. Episodes of harassment, intimidation, arrest, imprisonment and violence against journalists, politicians and political supporters fall in this category too. To the extent that the independent media and opposition parties also act as watchdog agencies, and that political rights pertain to the broader category of citizens’ rights, their violation influences even the dimension of executive limitation.
Civil liberties refer to the non-strictly-political dimension of life. Civil liberties in a country are restricted by any measure that compromises the physical integrity of citizens, the principle of equality before the law, individual and personal autonomy rights, religious freedom, academic freedom, minorities’ rights, the freedom to form civil society organizations and their independence. Admittedly, civil liberties represent a rather broad category. Accordingly, while restrictions to civil liberties have primarily to do with the institutional dimension of executive limitation, especially concerning citizen protection from rulers’ abuses, they may indirectly influence also the other regime dimensions.
In turn, the loosening of horizontal accountability has mainly to do with the exercise of political power, notably, the mechanisms through which the executive power is constrained and monitored by other institutional actors. More specifically, horizontal accountability loosens when constitutional reforms and other formal and informal measures are implemented with the aim of reshaping the balance of power between the executive and the legislative in favour of the former, of subordinating the judiciary power and of suppressing or undermining the autonomy of other monitoring and regulatory agencies.
New data on autocratization, 1990–2015
The proposed conceptual and analytical framework helps investigate trends of post-Cold War autocratization insofar as it can be applied to a global sample of such events. The measurement of autocratization faces two main challenges. On one hand, we need a magnitude threshold that establishes when transformations in the formal and informal institutions regulating how to assign and exercise political power – namely, political participation, public contestation and executive limitation – amount to outright regime change. On the other hand, it is particularly important to establish the points of departure and of arrival of the examined processes, that is, the regime type of the country in which autocratization has occurred and the regime type that has been installed as a consequence of it.
Democracy–autocracy scales – such as the indexes developed by Freedom House and Varieties of Democracy (V-Dem) – could provide an overview of the countries involved by the new wave of autocratization, if any, but they hardly fulfil the above tasks. The relatively high sensitivity of these indexes may induce to overestimate the empirical relevance of the phenomenon. Specifically, using these scales, we could record increases in the level of authoritarianism in a country across two or more years, but we cannot tell outright regime changes from other analytically minor transformations. Any minimum index score change to separate the two from each other would be arbitrary and difficult to justify. Going ‘from degrees to types’ – that is, building regime types and recording regime changes by fixing one or more cut-off points along a democracy–autocracy scale – would be similarly discretionary (Bogaards, Reference Bogaards2010). Moreover, since they aggregate several institutional attributes together, these indexes tell little about what and how many institutional dimensions the examined processes of regime change affect.
Hence, we opt for an approach to the measurement of contemporary processes of autocratization that rests on these indexes but integrates the sometimes too concise information they provide with more detailed data and with an in-depth examination of the potential cases of autocratization. To select the relevant episodes of post-Cold War autocratization, we proceed as follows, in particular.
First, we gather data on political institutions and political events that cover a global sample of 164 countries observed on a yearly basis throughout the 1990–2015 period. We draw further information on the political events occurred in the observed countries and period from the reports compiled by research institutes and governmental and non-governmental organizations such as Freedom House, Amnesty International, Human Rights Watch and the US Department of State. A full list of the sources from which data and information are collected is available in the Appendix.
Second, we run a preliminary screening of the potential cases of autocratization. For each country, we highlight all the score changes towards autocracy between year t and t−1 that either Freedom House or Varieties of Democracy record in their democracy–autocracy indexes.Footnote 2 Overall, we count 410 changes towards autocracy in the Freedom House index, and 1245 changes towards autocracy in the V-Dem index. The much larger number of changes recorded by V-Dem is to some extent explained by the higher sensitivity of this index. Unsurprisingly, the described initial screening has signalled a relatively large number of potential cases of autocratization. In several of the flagged countries, moreover, the recorded changes tend to form time-strings, which allow identifying spells of potential autocratization, that is, series made of one or more consecutive (or about consecutive) years of changes towards autocracy.
Third, using the collected data and reports, for every recorded spell of potential autocratization, we make a fourfold assessment. Specifically, we establish the regime type of the country under examination; the autocratization-related events occurred in the signalled historical juncture; whether the change is meaningful enough to represent an outright regime transition; and, if it is the case, the regime type that is installed following autocratization. As a reminder, changes in at least one and any of the three main institutional dimensions of regime variance could be sufficient to trigger a transition towards autocracy from one regime type to another, as specified in the first section of this article.
Fourth, we classify every case of regime transition towards autocracy selected through this procedure based on our analytical framework. The selected cases represent the units of observation in our new dataset on post-Cold War autocratization. We identify these cases in a ‘Country Year’ format. The year refers to the date in which the regime change has occurred, according to our evaluation, although in most of the selected cases, the process of autocratization has unfolded through longer periods of multiple years, as the time-strings of changes towards autocracy previously recorded suggest. Accordingly, we create new variables recording the form of autocratization (i.e. the regime types of departure and of arrival of the observed transition), the quality and the quantity of the change involved, and the modes through which it has unfolded.
Concerning the latter, for every case in our sample, we re-examine the autocratization-related events previously highlighted and re-aggregate them in the five categories of autocratization modes discussed in the second section of this article, corresponding to as many new binary variables. To be sure, for each case of autocratization, we record every mode for which we find evidence. Of course, an in-depth examination of many of these cases would reveal that some modes are more decisive than others in determining the observed process of regime change. However, given the mainly descriptive purposes of our analysis, we want to account for the complexity that often characterizes these processes of regime change.
The final list includes 46 episodes of autocratization occurred during the past two decades and a half in 40 countries. Four countries have suffered two episodes of autocratization (Bangladesh; Central African Republic; Guinea-Bissau; Venezuela), one country three of them (Thailand). Table A.1 in the Appendix reports the resulting dataset of post-Cold War autocratization.Footnote 3 In the Notes to Table A.1, we also highlight and briefly discuss a few potentially controversial cases of autocratization in our list and some other cases that have been excluded.
Trends of post-Cold War autocratization
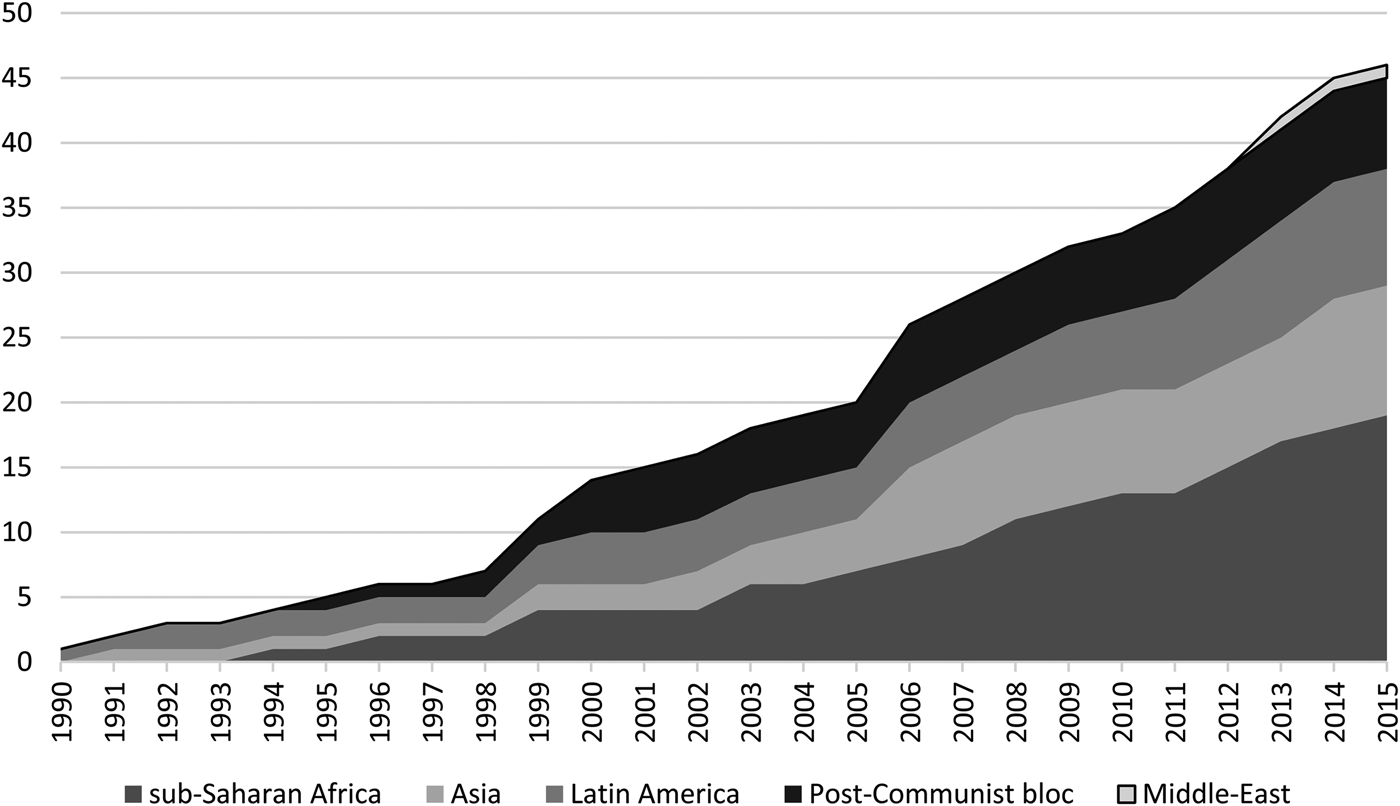
The survey confirms that autocratization represents an empirically relevant phenomenon in the post-Cold War era. Figure 1, which tracks autocratization frequencies throughout the post-Cold War period in a cumulative way, suggests an even more thought-provoking remark. To be sure, we refrain from engaging in the dispute on the hypothesis of a new reverse wave of regime changes (Diamond, Reference Diamond2008, Reference Diamond2015; Merkel, Reference Merkel2010; Plattner, Reference Plattner2014; Levitsky and Way, Reference Levitsky and Way2015; Schmitter, Reference Schmitter2015; Mechkova et al., Reference Mechkova, Luehrmann and Lindberg2017; Luehrmann et al., Reference Luehrmann, Tannenberg and Lindberg2018), also considering that the theory of democratization ‘by ebbs and flows’ (Huntington, Reference Huntington1991) has already proved of limited explanatory power (Doorenspleet, Reference Doorenspleet2005). However, we should acknowledge that autocratization's pace of diffusion has been growing since the early 2000s. While during the 1990s autocratization represented a relatively marginal phenomenon, the diffusion of this syndrome has experienced a first acceleration at the beginning of the 21st century. Starting from the mid-2000s, the slope of the line delimiting the aggregate area in Figure 1 gets steeper, and two 5-year sub-phases of acceleration can be identified.
Autocratization by region and year.

Figure 1 also shows that autocratization has spread unevenly across the world, though. With 19 cases occurred in 17 countries, sub-Saharan Africa is the continent that has suffered the most from this syndrome, outdistancing three main other affected regions, namely, Asia (10 episodes occurred in seven countries), Latin America (nine episodes occurred in eight countries) and the former communist bloc (seven episodes occurred in as many countries). Not a single Western country has experienced autocratization during the examined period. Not surprisingly, given the resilience that traditional forms of authoritarianism have demonstrated in this part of the world (Heydemann and Leenders, Reference Heydemann and Leenders2011), the Middle East is another under-represented region in our dataset. Turkey is the only case of autocratization that we recorded in the area.
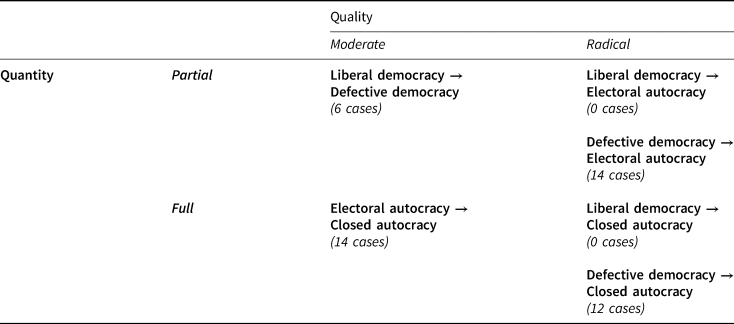
While these statistics capture the overall meaningfulness of the phenomenon that we are studying, they are less informative about the different forms that this syndrome takes in the post-Cold War period. Previously, we discussed that autocratization can take different forms, depending on the regime of the country suffering it and on the regime that is installed as a consequence of it. Table 1 classifies the 46 cases in our dataset according to the quality and the quantity of the change that a process of autocratization involves. As a reminder, quality distinguishes radical from moderate processes of autocratization, whereas quantity separates full from partial autocratization.
Autocratization by quality and quantity

Note: The raw number of recorded cases for each form of autocratization is reported in parentheses.
Source: Authors’ own data and elaboration (Cassani and Tomini, Reference Cassani and Tomini2019).
While Table 1 has no empty cell, we did not find evidence of any transition from liberal democracy to electoral autocracy and from liberal democracy to closed autocracy. At first glance, liberal democracies thus appear relatively stable regimes. More specifically, post-Cold War processes of autocratization have involved liberal democratic countries only in 13% of cases. It follows that most of contemporary autocratization takes place in hybrid regimes. In this regard, defective democracies are the regimes most frequently affected by this syndrome, being involved in about 57% of the recorded transitions towards autocracy. The remaining 30% of the cases of autocratization in our sample took place under electoral autocracy.
Table 1 also shows that slightly less than half (12 cases out of 26) of post-Cold War radical transitions from defective democracy to some form of autocracy actually represent episodes of full autocratization that resulted in the installation of a closed autocracy. In general, the cases of full autocratization clearly outnumber the episodes of partial autocratization, if we also consider the 14 transitions from electoral autocracy to closed autocracy. On the other hand, besides representing unlikely victims of autocratization, contemporary liberal democracies experience only moderate forms of autocratization leading to defective democracy rather than to the end of democracy.
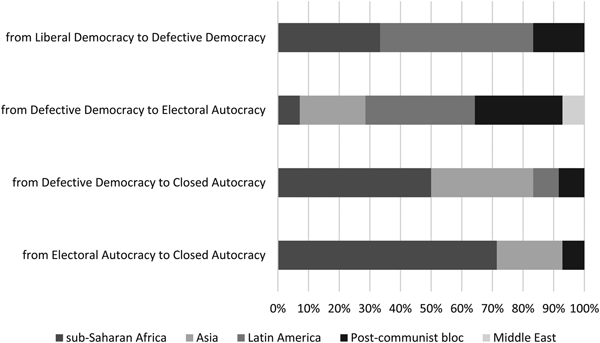
Geography represents a key source of variation that helps seize contemporary trends of autocratization. Autocratization tends to take different forms in different regions. Figure 2 illustrates the regional distribution of the four forms of regime change towards autocracy for which we have collected evidence. The most evident trend refers to Africa, which has the lion's share of post-Cold War full autocratization: 72 and 50% of the recorded transitions from electoral autocracy to closed autocracy and from defective democracy to closed autocracy have occurred south of the Sahara, respectively. Vice versa, full autocratization is the modal form of regime change towards autocracy in the region, meaning that, when autocratization occurs in Africa, it likely leads to the installation of a closed autocracy. It has happened in 16 out of the 19 episodes of autocratization recorded in this region. Among the African cases of full autocratization, moderate transitions that involve electoral authoritarian regimes (10 cases) outnumber radical transitions from defective democracy (six cases).
Autocratization forms by region.

On the other hand, partial autocratization is a mainly Latin American phenomenon, and the modal type of autocratization in this region. Overall, 40% of the recorded transitions from liberal democracy to defective democracy and from defective democracy to electoral autocracy have occurred in Latin America, whereas eight of the nine cases of autocratization that we count in this region have not led to closed autocracy. While regime change towards autocracy in Latin America tends to stop short of full autocratization, it often implies a radical transition. More than one-third of the transitions from defective democracy to electoral autocracy have occurred in Latin America (five out of 14 total cases). Latin America is also the region in which half of the moderate transitions from liberal democracy to defective democracy have occurred (three cases).
Figure 2 highlights a few other regional trends. Like Africa, autocratization in Asia has led to closed autocracy in 70% of cases. However, similarly to Latin America, more often than not Asian autocratization is radical, causing defective democracies to be replaced by either closed autocracy (four out of 10 Asian autocratization episodes) or electoral autocracy (three other cases). The post-communist region offers a less variegated picture. More than half of the transitions towards autocracy occurred in this region between 1990 and 2015 (four out of seven cases) took place under defective democracy and caused the installation of electoral authoritarian regimes.
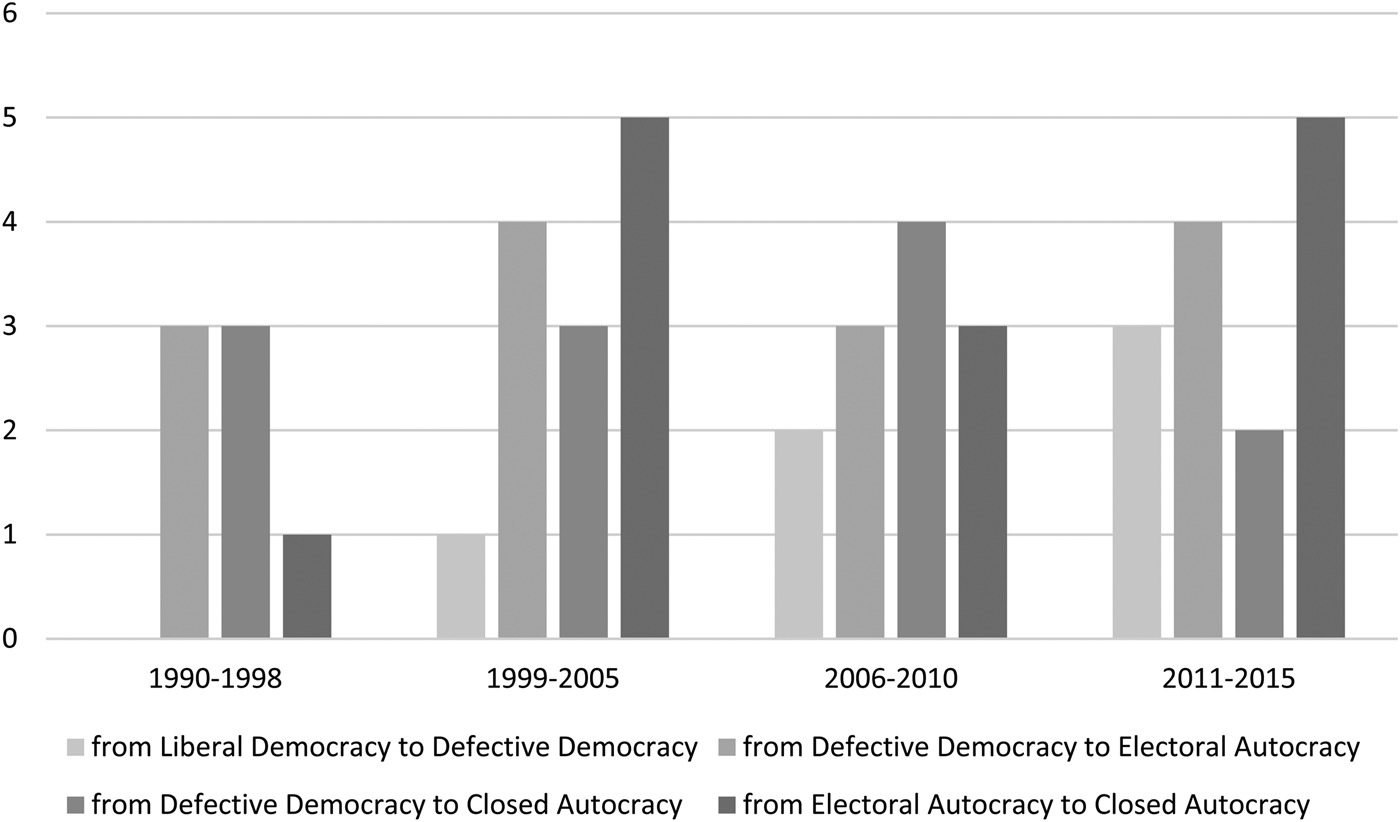
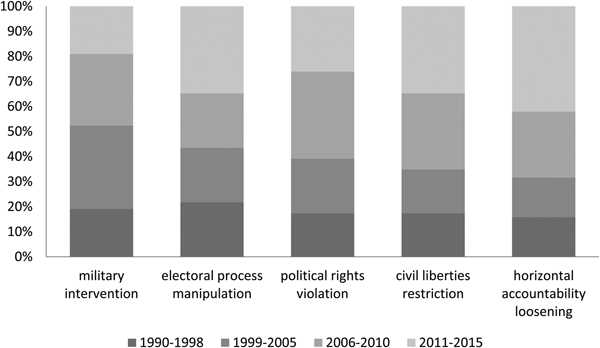
Post-Cold War patterns of autocratization also vary through time. To capture historical trends in a vivid way, Figure 3 groups the recorded cases of autocratization in four unbalanced periods, corresponding to the four sub-phases of diffusion previously highlighted by Figure 1. The resulting bar chart generates mixed feelings. Transitions from defective democracy to closed autocracy seem to have peaked during the second half of the 2000s, and their frequency has decreased since then. This is good news, if we consider that they represent a radical and full form of autocratization, and the most disruptive form of regime change towards autocracy in our sample, by far. Transitions from electoral autocracy to closed autocracy are the most frequent forms of autocratization in the 21st century, thus far, followed by transitions from defective democracy to electoral autocracy.
Autocratization forms by period.
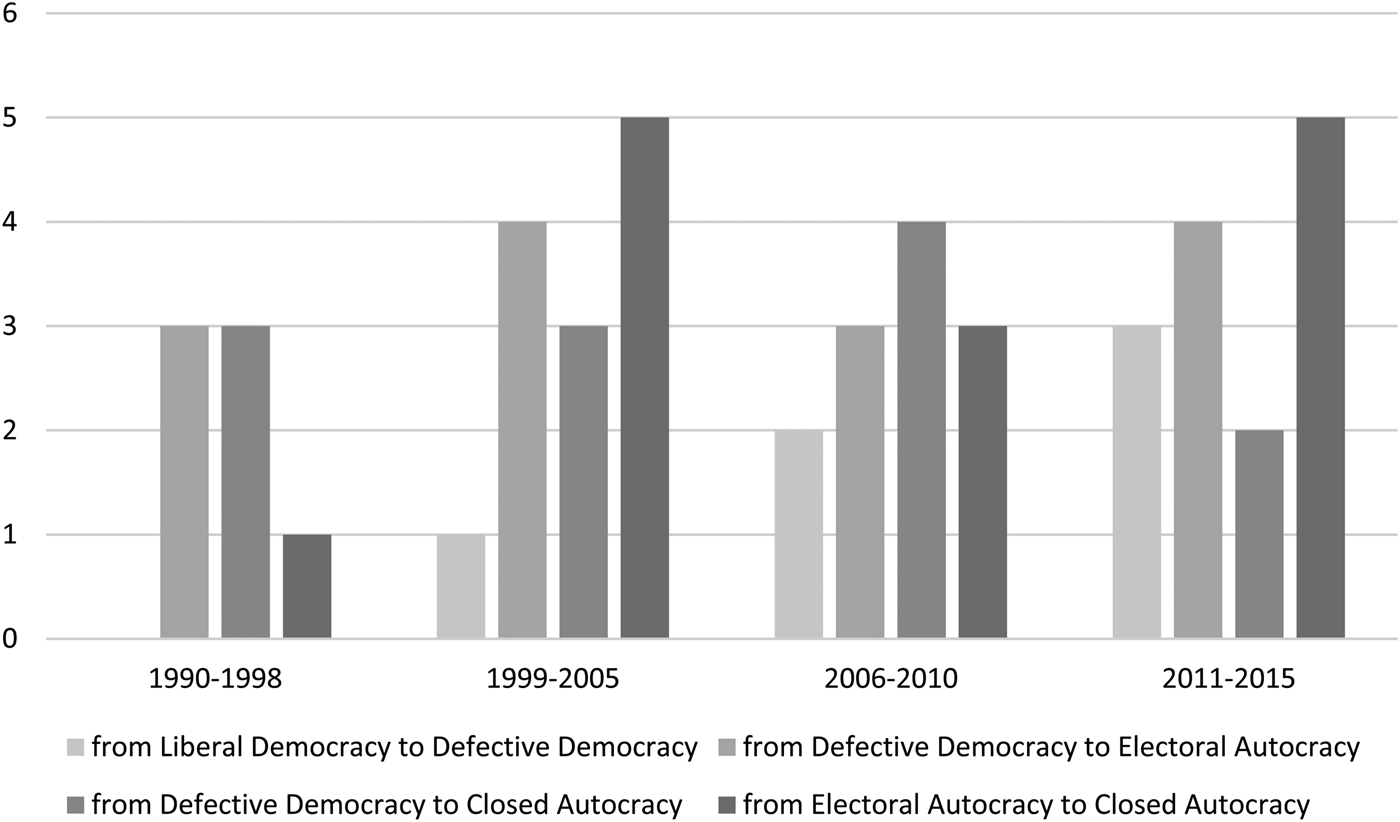
On the other hand, while less impressive from a strictly numeric viewpoint, the trend that transitions from liberal democracy to defective democracy have been following since the early 2000s deserves attention. Figure 3 shows that this form of autocratization was empirically irrelevant during the 1990s. To be sure, transitions from liberal democracy to defective democracy have remained a rare form of autocratization even during the last 10/15 years, the least common, indeed. However, their frequency is growing at a remarkably stable rate. They represent a relatively new but increasingly relevant phenomenon.
Concerning the modes of autocratization, the analysis of the cases in our sample shows that post-Cold War processes of autocratization tend to unfold in complex and multi-modal ways. We count 19 episodes of horizontal accountability loosening, 23 episodes of manipulation of the electoral process, 23 violations of political rights, 23 events concerning the restriction of civil liberties and 21 military interventions, which variously combine with each other in the 46 cases of autocratization occurred between 1990 and 2015, for a total of 109 autocratization-related events.
While the five modes of autocratization are represented in a relatively even way in our dataset from a strictly numerical viewpoint, we observe an evolution in how regime change towards autocracy happens. Figure 4 tracks how the empirical relevance of the different modes of autocratization has varied throughout the post-Cold War era, based on the same sub-periods that we used in Figure 3. Until 2005, military interventions were the most common mode of autocratization. Starting from the mid-2000s, however, manipulations of the electoral process, violations of political rights, restrictions to civil liberties and the loosening of horizontal accountability represent increasingly relevant modes through which political regimes autocratize. Between 2006 and 2015, the episodes of electoral process manipulation, political rights violation and civil liberties restriction have more than doubled in frequency. The cases in which autocratization has involved the loosening of the mechanisms of horizontal accountability have tripled, in turn. On the contrary, military intervention represents the least common autocratization mode during the five most recent observed years.
Autocratization modes by period.

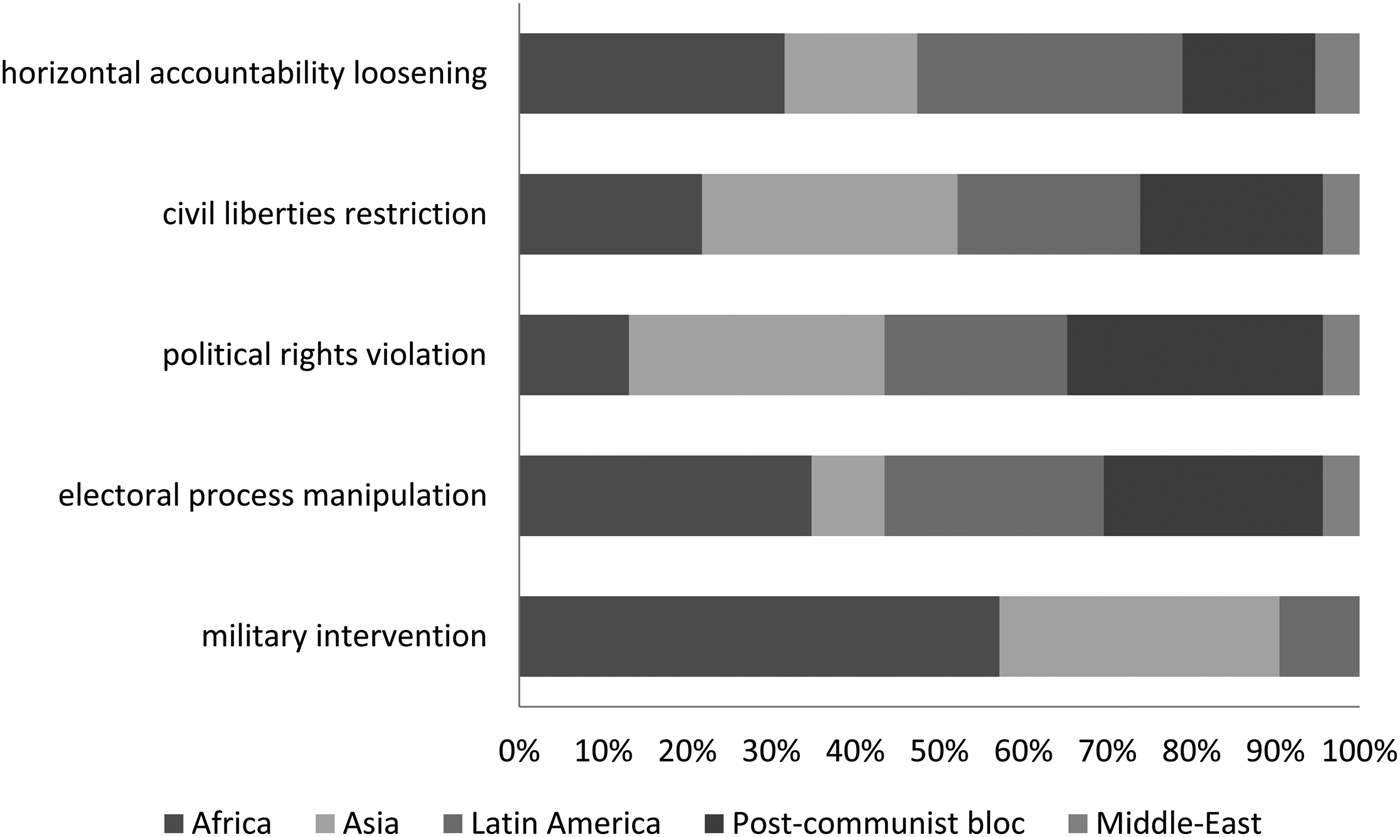
Regional variations in the modes of autocratization also exist. According to Figure 5, 90% of the recorded military interventions have occurred in Asia and Africa, which has suffered alone more than half of such episodes (12 military coups in 10 countries). The second most frequent mode of autocratization in the sub-Saharan continent is the manipulation of the electoral process, which is common even in Latin America and the post-communist bloc. The violation of political rights, the restriction of civil liberties and the loosening of horizontal accountability represent other relatively frequent modes of autocratization in these regions. About two-thirds of the recorded episodes of horizontal accountability loosening have occurred in Latin America and Africa. In turn, no post-communist country has autocratized following the intervention of the military, thus far. Military interventions are rare also in Latin America. Autocratization in Asia, finally, offers a more variegated picture showing that military interventions, political rights violations and civil liberties restrictions occur with similar frequencies.
Autocratization modes by region.

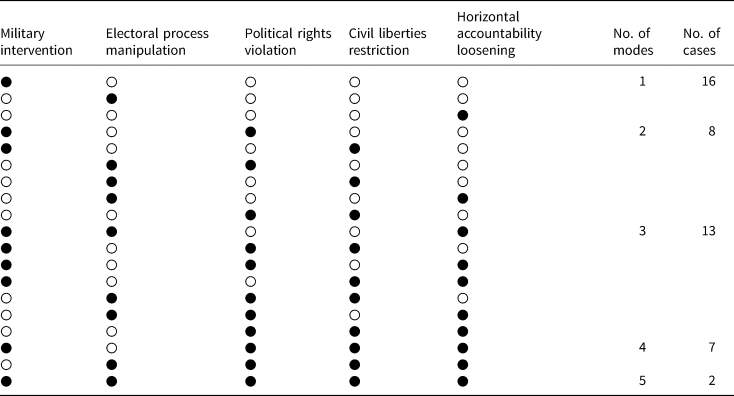
As anticipated, post-Cold War regime changes towards autocracy tend to unfold through multiple modes. Table 2 reports 19 combinations of modes that exist in our dataset, in particular. Most of them combine two, three or more modes. Only 16 of the 46 selected cases of autocratization have occurred through a single mode. Yet how do the different modes of autocratization combine with each other? In Table 2, it is interesting to note that military intervention and electoral process manipulation tend to combine with the remaining modes, but rarely with each other. They appear somehow alternative modes through which autocratization can happen. On the other hand, the violation of political rights, the restriction of civil liberties and the loosening of executive constraints often go together.
Combinations of autocratization modes

Note: The units of analysis are the 46 cases of autocratization in our sample. Each row represents an existing combination of one or more modes. Black dots indicate the presence of the corresponding modes, white dots their absence.
Source: Authors’ own data and elaboration (Cassani and Tomini, Reference Cassani and Tomini2019).
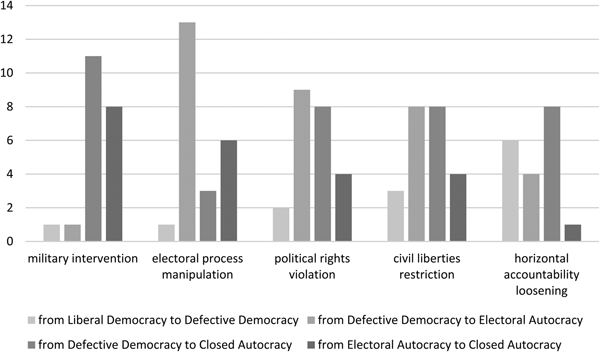
Figure 6 moves a step forward and matches modes and forms of autocratization. The vast majority of the military interventions have been recorded in cases of full autocratization leading to the installation of a closed autocracy. The second most evident regularity refers to the manipulation of the electoral process. More than half of such events have occurred in countries suffering a transition from defective democracy to electoral autocracy. Another quarter of the manipulations of the electoral process that we recorded are associated with transitions from electoral autocracy to closed autocracy.
Autocratization modes by regime transition form.

The recorded violations of political rights and restrictions of civil liberties are distributed more evenly across the different forms of autocratization, but are especially frequent in radical transitions from defective democracy to either electoral autocracy or closed autocracy. Likewise, the vast majority of the actions resulting in the loosening of the mechanisms of horizontal accountability have been recorded in cases of autocratization that involve democratic regimes. The rarity of the latter three modes in cases of autocratization that take place under electoral authoritarianism is not surprising, since horizontal accountability, civil liberties and political rights are generally weak in these regimes.
Conclusion
Despite a renewed scholarly interest, the processes of regime change opposite to democratization remain a relatively understudied topic at the centre of a debate characterized by uncertainty concerning what they consist in, by disagreement on the actual import of the phenomenon, and by a shortage of systematic cross-regional studies. To start filling these gaps, this article built on the notion of autocratization, provided a framework for the comparative analysis of these processes, produced new data on the post-Cold War cases, and investigated contemporary patterns.
To summarize, we define as a process of regime change towards autocracy that makes the exercise of political power more arbitrary and repressive and that restricts the space for public contestation and political participation in the process of government selection. So defined, autocratization can take the form of the following six regime transitions: from liberal democracy to defective democracy; from liberal democracy to electoral autocracy; from liberal democracy to closed autocracy; from defective democracy to electoral autocracy; from defective democracy to closed autocracy; from electoral autocracy to closed autocracy.
These transitions have a similar direction towards autocracy but may differ in several respects. To account for these differences, we distinguish radical from moderate autocratization, depending on whether a transition leads to an outright change from democracy to autocracy, and full from partial autocratization, depending on whether a transition ends with the installation of a closed autocracy. We also consider five different ways in which autocratization may happen, that is, military intervention, electoral process manipulation, political rights violation, civil liberties restriction and horizontal accountability loosening.
This framework has a key advantage, in our view. It recognizes all the regime transitions that share the direction towards autocracy as possible manifestations of a process of autocratization, but also provides a few basic coordinates to make distinctions and conduct comparative analysis. These are essential features to get a fuller understanding of the phenomenon under examination. By means of the proposed framework, we could seize the overall import of autocratization, but also observe its variations. In this respect, our research confirms that autocratization represents an empirically relevant phenomenon in the post-Cold War era, whose pace of diffusion is growing in a worrisome way, at least since the mid-2000s. Contemporary transitions towards autocracy are complex processes of regime change, often unfolding through multiple modes, moreover.
Sub-Saharan Africa, Asia, Latin America and the post-communist world are the most affected regions. These regions were protagonists during the most recent global wave of democratization, between the late-1970s and the mid-1990s (Huntington, Reference Huntington1991). Hence, post-Cold War autocratization has mainly involved states whose democratic or semi-democratic institutions were relatively young. Defective democracies are the most likely victims of this syndrome, followed by electoral autocracies, in particular. These findings challenge some of our expectations concerning the future of democracy. In particular, while defective democracies have been traditionally considered among the most fragile regimes, electoral authoritarianism has been often deemed a stepping stone to fuller democratization (Hadenius and Teorell, Reference Hadenius and Teorell2007). The growing number of recently institutionalized electoral autocracies that move towards closed authoritarianism tells quite a different story.
Geography and time also emerge as important dimensions of variance that help size a few patterns in the forms and modalities of post-Cold War processes of autocratization. Autocratization tends to take different forms in different regions. When autocratization occurs in Africa, it typically leads to the installation of a closed autocracy, often following either a military intervention that overthrows an elected government or the manipulation of the electoral rules. The case of Africa is exemplary of what we have just said concerning the likeliest candidates of contemporary autocratization. Africa represents a latecomer of democratization, a cradle for hybrid regimes and a frontrunner of (re-)autocratization (Carbone and Cassani, Reference Carbone and Cassani2016). While the third wave of democratization reached the continent's shores only during the 1990s, autocratization in Africa has started spreading at the beginning of the 2000s, earlier than in other regions and in a more sizeable way, mainly targeting electoral authoritarian regimes.
Much of Latin American contemporary regime changes towards autocracy stop short of full autocratization, and involve democratic regimes in which elected officials weaken the mechanisms of horizontal accountability, violate political rights and civil liberties, and occasionally manipulate the rules of the game. Even in this case, the most recent wave of democratization (Huntington, Reference Huntington1991) has shaped the prevailing forms that autocratization takes in this region. In Latin America, autocratization involves more democratic countries than electoral autocracies, which is not surprising given the dramatic number of democratic transitions occurred in the continent between the late 1970s and the 1980s (O'Donnell and Schmitter, Reference O'Donnell and Schmitter1986). The rarity of military interventions in post-Cold War Latin America should be highlighted, too, in striking contrast with the dramatic number of coups occurred in the region between the 1950s and the 1970s.
Even post-communist countries tend to suffer partial forms of autocratization, whereby defective democracies become electoral autocracies through various combinations of modes that never include the intervention of the military, though. On the other hand, Asia is another region in which autocratization often leads to closed autocracy, virtually always through a combination of military interventions and political rights violations.
From a historical viewpoint, despite the focus of this research on a relatively short and recent period (1990–2015), evolutions are evident in the forms that autocratization takes and in how it happens. Transitions from defective democracy to closed autocracy and military interventions give way to less disruptive forms of autocratization that occur following subtler manipulations of electoral rules, violations of political rights, restrictions to civil liberties and/or the loosening of the mechanisms of horizontal accountability.
We conclude drawing attention to transitions from liberal democracy to defective democracy, a relatively new, still rare, but increasingly frequent form of autocratization. Liberal democracies are stable regimes, in general, and tend to suffer only moderate and partial forms of autocratization leading to defective democracy. Despite the apparently minor political consequences of these regime changes that do not lead to the installation of autocracy, the crumbling of liberal democracy is perhaps the most disturbing finding of our analysis, if we consider its potential longer-term implications. These transitions lead to defective democracy, which is the most fragile regime type, as we have seen. In other words, the risk is that the autocratization sequence that Venezuela has experienced between 2000 and 2012 – from liberal democracy to defective democracy and from defective democracy to electoral autocracy – will not remain an isolated case.
Author ORCIDs
Andrea Cassani, 0000-0002-5523-0327.
Acknowledgments
The authors are grateful to the participants of the panel ‘An authoritarian resurgence? De-democratization and authoritarian resilience in the contemporary world’ held at the Annual Congress of the Società Italiana di Scienza Politica (September 2017, Urbino, Italy) and to the participants of the workshop ‘Autocracy strikes back’ held at the Department of Social and Political Science of the Università degli Studi di Milano (April 2018, Milano, Italy).
Financial support
The research is part of the project ‘Comparative autocratization. Modes and consequences of regime changes opposite to democratization, 1990–2018’. The research received no grants from public, commercial or non-profit funding agency.
Data
The replication dataset is available at http://thedata.harvard.edu/dvn/dv/ipsr-risp. Please feel free to contact the authors for further information.