Mastitis is still the most costly and challenging disease for the dairy industry (Dadpasand et al. Reference Dadpasand, Zamiri, Atashi and Akhlaghi2012) and often results in early culling of dairy cows. Annual statistics published by the German Cattle Breederś Federation (Bonn, Germany) show that the percentage of culling because of udder diseases among all culling in German dairy herds was 14·9% in the year 2012 (ADR, 2013). Inflammation of the mammary gland, usually in response to invasive agents, can be characterised by an increase in the somatic cell count (SCC) in milk (Rodriguez-Zas et al. Reference Rodriguez-Zas, Gianola and Shook2000). The individual cow-level lab somatic cell count (LSCC), measured in the composite milking and generally log-transformed to the lab somatic cell score (LSCS), is the commonly used indicator trait for monitoring udder health (Rupp & Boichard, Reference Rupp and Boichard1999).
SCC in milk is a multifactorially influenced parameter. After the beginning of lactation, LSCS decreases to a minimum at around 60 d post-calving and increases thereafter (Wiggans & Shook, Reference Wiggans and Shook1987). Variation in the shape and level of the LSCS pattern is related to systematic environmental effects, such as stage of lactation (Schutz et al. Reference Schutz, Hansen, Steuernagel, Reneau and Kuck1990), lactation number and season (Wiggans & Shook, Reference Wiggans and Shook1987), udder infection status (Sheldrake et al. Reference Sheldrake, Hoare and McGregor1983) and individual cows (Rodriguez-Zas et al. Reference Rodriguez-Zas, Gianola and Shook2000). The increase in SCC with stage of lactation can be caused by response to infection as well as increased concentration due to declining yield or physiological effects associated with lactation that are independent of infection (Wiggans & Shook, Reference Wiggans and Shook1987). In addition, the elevation of somatic cells in milk is related negatively to milk production and milk composition (Monardes & Hayes, Reference Monardes and Hayes1985). Estimates of genetic and phenotypic correlations between LSCS and production traits vary in the literature (Schutz et al. Reference Schutz, Hansen, Steuernagel, Reneau and Kuck1990; Jamrozik et al. Reference Jamrozik, Bohmanova and Schaeffer2010).
If milk samples for SCC analysis are collected monthly, clinical mastitis cases with rapid recovery may not necessarily be detected by SCC (Heringstad et al. Reference Heringstad, Klemetsdal and Ruane2000). Therefore, dairy producers have the possibility to use sensor systems for daily automated on-line mastitis detection in composite or quarter milk (Hogeveen et al. Reference Hogeveen, Kamphuis, Mollenhorst and Steeneveld2010; Koeck et al. Reference Koeck, Miglior, Kelton and Schenkel2012). In the present study, measurement data of the automated on-line SCC (OSCC) sensor system CellSense™ (Sensortec, Hamilton/Dairy Automation Limited, Waikato, New Zealand) were analysed. The measuring principle is based on the California Mastitis Test (CMT). A detergent-based chemical reagent interacts with a milk sample (e.g. mastitic milk) to form a gel. The viscosity of the formed gel is expressed as drain time. It is the time the gel needs to flow through a standardised measurement chamber (Whyte et al. Reference Whyte, Orchard, Cross, Frietsch, Claycomb and Mein2004). Whyte et al. (Reference Whyte, Orchard, Cross, Frietsch, Claycomb and Mein2004) explained that the association between SCC and drain time of a milk sample relies on the fact that the viscosity of the gel is proportional to the DNA content of the milk. The more somatic cells in the milk sample, the higher the viscosity of that sample. Given that in addition to it the OSCC is obtained from the drain time by each sensor using a specific algorithm, the sensor records might be comparable to the LSCC. Previous studies dealing with the mentioned sensor system analysed the correlation between lab and sensor. Leslie et al. (Reference Leslie, Dingwell, Yan, Bashiri and Johnstone2007) and Kamphuis et al. (Reference Kamphuis, Pietersma, van der Tol, Wiedemann and Hogeveen2008Reference Kamphuis, Sherlock, Jago, Mein and Hogeveenb) obtained correlation coefficients between lab and sensor records of r = 0·71 and r = 0·76.
In order to clarify the potential of drain time as an alternative to SCC for mastitis detection, it is first necessary to understand the factors of variation of drain time and to analyse the correlation between SCC and drain time as well as their relation to other milk constituents. Therefore, the objectives were (1) to compare different fixed effect models describing the log-transformed draintime (logDT) by evaluating the goodness of model fit; (2) to compare logDT and LSCS curves for first, second, third and later lactations and (3) to estimate correlations between cow effects for logDT as well as LSCS with important production traits.
Materials and methods
Sensor data
Cow-level milk viscosity data were recorded at the dairy research farm Karkendamm of the Institute of Animal Breeding and Husbandry, Christian-Albrechts-University in Kiel (Germany) between April 2011 and December 2012. Approximately 165 Holstein-Friesian dairy cows were milked twice daily in a rotary parlour with 28 milking stalls (GEA Farm Technologies). Automatic viscosity sensors were attached at the main milk-line on every fourth milking stall as an on-line system. The measuring principle is based on the automated California Mastitis Test (CMT), which was developed in 1957 (Schalm & Noorlander, Reference Schalm and Noorlander1957) and derived from the Whiteside test (Whiteside, Reference Whiteside1939). Sampling, mixing, measuring and cleaning were performed according to Whyte et al. (Reference Whyte, Orchard, Cross, Frietsch, Claycomb and Mein2004) and were completed automatically. Data were available approximately 2 min after the milk flow started. From the drain time the OSCC of the composite milk sample is obtained by each sensor. Drain time records included in the data ranged from 0·80 to 6·00 s. The drain time was log10(+1)-transformed (logDT) to achieve a normally distributed trait with homogenous variance. Cows which were milked into buckets were not assessed by the sensors.
Data from herd management system and laboratory
Milk yield was automatically recorded at every milking in the herd management system (DairyPlan, GEA Farm Technologies). According to Dodenhoff & Emmerling (Reference Dodenhoff and Emmerling2009), records with a minimum of 2 kg milk per milking were included in the data. Milk composition was analysed weekly based on samples collected from 2 consecutive milkings. LSCC was log-transformed to the LSCS as suggested by Ali & Shook (Reference Ali and Shook1980) to obtain normal distribution. LSCS was regarded as the reference. Table 1 illustrates the percentage distribution of the traits, drain time and milk yield, for lactation numbers 1–7. For further examination, dairy cows were classified into lactation number 1, 2 and equal or greater than 3. Forty-four lactation weeks were obtained. Days in milk (DIM) included in the data were between lactation days 5 and 305.
Percentage of observations (n) per lactation number for the traits, drain time and milk yield

Data sets
Two data sets were defined. The first data set (D1) contained milking data from the herd management software (DairyPlan, GEA Farm Technologies), e.g. milk yield and LSCC, fat, protein and lactose milking data. In total, 187 692 milkings from 320 cows from 1238 test-day milkings were recorded. Considering that the sensors were not installed at every milking stall, the second data set (D2) consisted of 25 887 drain time records from 311 cows on 980 test-day milkings. Table 2 provides descriptive statistics for the traits drain time, logDT, LSCC, LSCS, milk yield and fat, protein and lactose contents.
Descriptive statistics: number of observations (n), median, mean value, sd, minimal (Min) and maximal (Max) values for the traits drain time, log-transformed drain time (logDT), lab somatic cell count (LSCC), lab somatic cell score (LSCS), milk yield, fat content, protein content and lactose content
† (log10(Drain time)+1)
‡ log2(LSCC/100)+3)
Model evaluation and evaluation criteria
Eight fixed models with different definitions of the lactation stage were compared to find the alternative with best model fit. The basic model included the fixed effects test-day milking (TDM), sensor number (SN) and lactation number (LNU). Lactation stage was considered as lactation week (model I) or lactation week within lactation number (model II) or by the functions Ali Schaeffer (models III and IV) (AS; Ali & Schaeffer, Reference Ali and Schaeffer1987) and Legendre polynomials of second degree (models V and VI) and third degree (models VII and VIII) (LP; Bohmanova et al. Reference Bohmanova, Miglior, Jamrozik, Misztal and Sullivan2008) (Table 3). These functions are commonly used in random regression and covariance function models (Macciotta et al. Reference Macciotta, Vicario and Cappio-Borlino2005). All fixed models were analysed using the SAS procedure MIXED with the Maximum Likelihood (ML) method (SAS®, 2010).
Function terms of lactation day (d) for four models using the Ali-Schaeffer curve (AS) and Legendre polynomials of second and third degree (LP2–LP3) to simulate the shape of the lactation curves†
† t = [−1 + (2((d−5)/(305−5)))]
Goodness of fit of the eight different models for logDT was evaluated by the corrected Akaike information criterion (AICC; Burnham & Anderson, Reference Burnham and Anderson1998) and the Bayesian information criterion (BIC; Schwarz, Reference Schwarz1978).
 $${\rm AICC}_{{\rm ML}} \, = \, - 2ln{\rm ML \;+ \;} \displaystyle{{2n(\,p + q)} \over {n - p + q - 1}}$$
 $${\rm BIC}_{{\rm ML}} \, = \, - 2ln{\rm ML\; + \; (}p + q{\rm )\; (ln\;} n{\rm )}$$
For calculating the information criteria, n is the number of observations, p the number of fixed effects and q the number of random effects (SAS®, 2010). Littell et al. (Reference Littell, Milliken, Stroup, Wolfinger and Schabenberger2006) mentioned that the model that minimises AICC or BIC is superior, but if AICC or BIC are close, the simpler model is generally considered preferable.
A random regression model for statistical inference and estimation of variance components was defined. This model contained random regression coefficients to describe the shape of cow-specific lactation curves.
The resulting random regression model applied to the data sets D1 and D2 for the analysis of logDT, LSCS, milk yield, fat, protein and lactose content was model IV (RR):
 $$y_{ijklm} = {\rm \mu} + {\rm TDM}_i + {\rm SN}_j + {\rm LNU}_k + \mathop \sum \limits_{n \;=\; 1}^z b_{kn} \times x_{ijklmn} (d) + \mathop \sum \limits_{n \;=\; 0}^z {\rm cow}_{{\rm ln}} \times x_{ijklmn} (d) + \; e_{ijklm} $$
where y ijklm = observation of logDT, LSCS, milk yield, fat, protein or lactose content, μ = overall mean, TDM i = fixed effect of the ith test day milking (i = 1–980), SN j = fixed effect of the jth sensor (j = 1–7), LNU k = fixed effect of the kth lactation number (k = 1, 2, ≥3), b kn = nth fixed regression coefficient within the kth lactation number on the four AS function terms of lactation day d with x ijklm1(d) = d/310, x ijklm2(d) = (d/310)2, x ijklm3(d) = ln(310/d) and x ijklm4(d) = (ln(310/d))2, cow ln = nth random regression coefficient for AS terms of the lth animal (D1: l = 320, D2: l = 311) and e ijklm = random residual effect.
Random residual (e ijklm) variance (σe2) and individual cow variance components (σc12, σc22, σc32, σc42, σc52) were assumed to be normally distributed, with a covariance between the intercept and slope parameters.
Lactation curves were calculated by summing up average fixed effects plus the terms of the Ali Schaeffer function multiplied by the estimated regression coefficients. The random regression model was analysed using the SAS procedure MIXED with the REML method (SAS®, 2010). The significance of differences between least square means (LSM) was adjusted with the Bonferroni correction (SAS®, 2010).
Results
Fixed effect model
The fixed effects involved in the eight different models, the residual variance (σ2e) and differences for the AICC (∆ AICC) and BIC (∆ BIC) for the logDT dependent on the functions are presented in Table 4. According to the differences between the evaluation criteria AICC and BIC, respectively, the Ali-Schaeffer function is most suitable for modelling the fixed regression part of the mixed model. Model IV performs better than the other models. In general, model V performs the poorest for all logDT models. The rankings based on the residual variance (σ2e) are not the same as for both AICC and BIC in all cases. Moreover, the relationship between AICC and BIC differs between the fixed regression models (models III to VIII) and the fixed effect models I and II. This is reflected in the reverse relationship between AICC and BIC.
Residual variance (σ2e) and differences between the corrected Akaike information criterion (∆ AICC) and between Bayesian information criterion (∆ BIC) for the log-transformed drain time dependent on 8 different models
TDM, test-day milking; SN, sensor; LNU, lactation number; LWE, lactation week; AS, Ali-Schaeffer curve of first to fourth degree; LP1–LP3, Legendre polynomials of first to third degree
Lactation curves
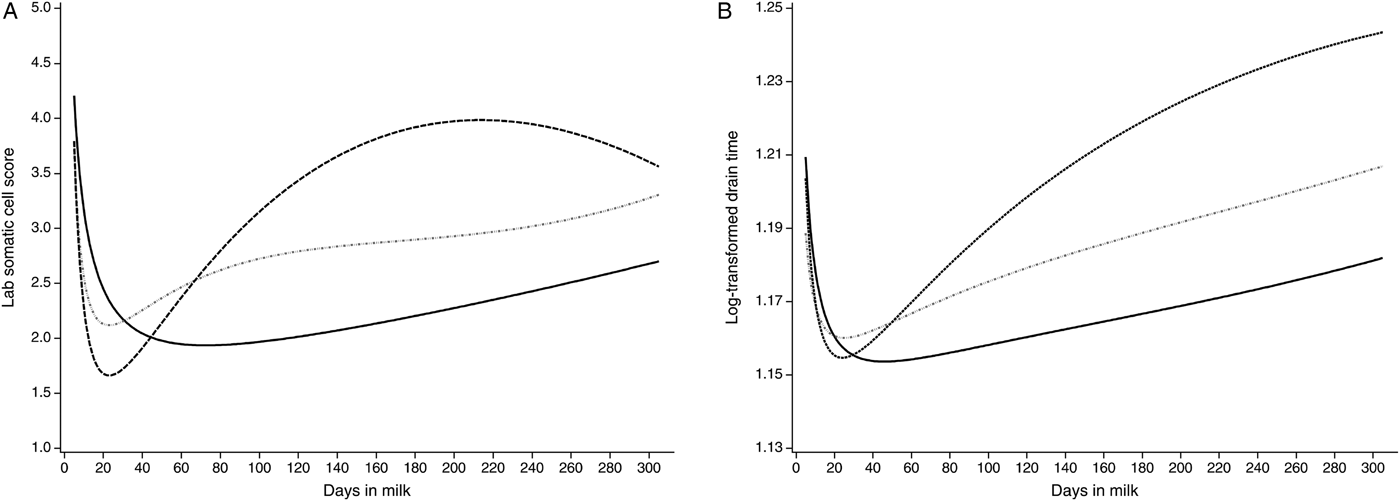
The lactation curves of LSCS and logDT for cows in first, in second and in third and higher lactations modelled with the Ali-Schaeffer function are presented in Fig. 1. The lactation curves of LSCS and logDT show a close resemblance. In early lactation, LSCS and logDT both decrease until approximately 40 DIM. Thereafter, LSCS and logDT increase. The sole exception is the lactation curve of LSCS in the third and higher lactations which declines marginally around 220 DIM. In general, the lactation curves for LSCS as well as for logDT differ between lactations. Herein, the concentration of somatic cells in milk is minimal for primiparous cows, higher for second-lactation cows and considerably larger for later parities. The lactation curves of logDT have a better accordance at the beginning of the lactations and at the end of the third and higher lactations than the lactation curves of LSCS.
Lactation curves for the laboratory somatic cell score (LSCS) (a) and the log-transformed drain time (logDT) (b) of cows in first lactation (solid black), in second lactation (dashed dotted grey) and in third and higher lactations (dashed black) modelled with the Ali-Schaeffer function.
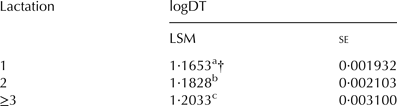
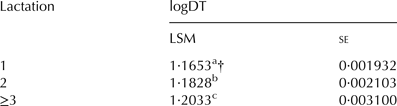
Table 5 shows the least square means (LSM) and se of logDT for first, second and third and higher lactations. For primiparous cows, the somatic cells in milk are significantly lower than for cows in the second and the third and higher lactations.
Least square means (LSM) and se of the log-transformed drain time (logDT) for first, second, third and higher lactations [from Model IV (RR)]
† Values with different superscript letters are significantly different (P < 0·05)
Correlations between cow effects
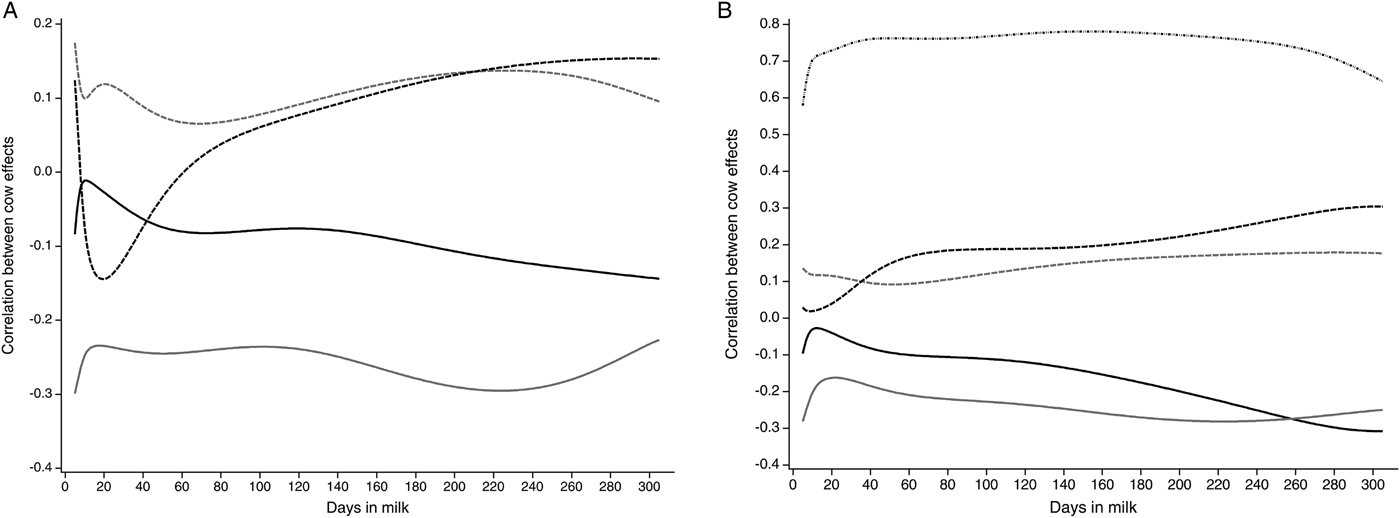
In Fig. 2a, the correlations between cow effects between LSCS and milk yield, lactose, protein and fat content for 5–305 DIM calculated with the Ali-Schaeffer function are presented. Negative correlations are found between LSCS and milk yield. They decrease from DIM 5 (r = −0·08) to DIM 11 (r = −0·01) and again increase up to r = −0·14 in late lactation. The correlations of LSCS and lactose content show a similar shape. They range from r = −0·30 in early lactation to r = −0·23 in late lactation. Conversely, correlations between cow effects for protein and fat content with LSCS decrease until approximately DIM 20. The correlations between LSCS and protein show a more pronounced shape than the correlations between LSCS and fat. In early lactation, the correlation is r = 0·12, decreases up to r = −0·14 and increases until late lactation to r = 0·15. Positive correlations between cow effects for fat and LSCS are obtained at the beginning of lactation (r = 0·18). Both are minimally correlated in mid-lactation (r = 0·07). In late lactation, the correlation between LSCS and fat content decreases again.
Correlations between cow effects for the traits laboratory somatic cell score (LSCS) (a) and log-transformed drain time (logDT; dashed dotted black) (b) with milk yield (kg; solid black), lactose content (%; solid grey), fat content (%; dashed grey) and protein content (%; dashed black) for 5–305 days in milk (DIM) calculated with the Ali-Schaeffer function
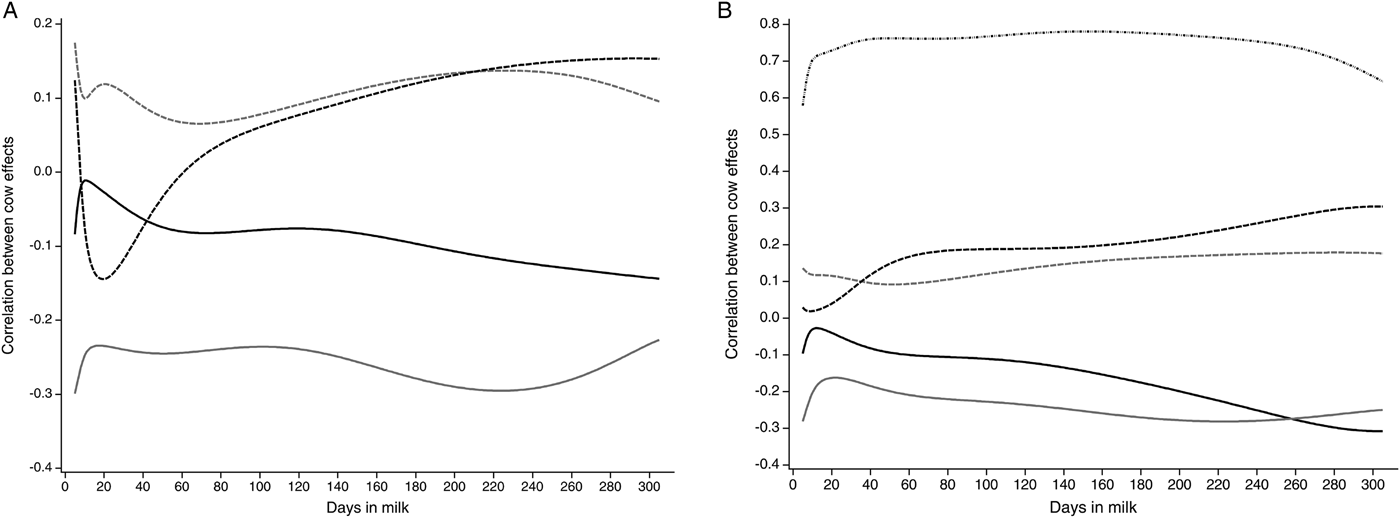
In Fig. 2b, correlations between cow effects between logDT and milk yield, lactose, protein, fat content and LSCS for 5–305 DIM calculated with the Ali-Schaeffer regression model are illustrated. The correlations between cow effects for milk yield and lactose content with logDT decrease in the first days in milk, as previously shown for their correlations with LSCS. Milk yield and logDT have a quite similar correlation in the end of lactation (r = −0·31). The correlation between logDT and lactose content is highest in initial lactation and late lactation, both with r = −0·28. Correlations between logDT and protein and fat content show a less pronounced shape than the correlations for LSCS. Correlations between logDT and protein content ranged from r = 0·02 (DIM 9) to r = 0·30 (DIM 305). Fat content and logDT were highly correlated on DIM 281 with r = 0·18 and only marginally correlated on DIM 52 (r = 0·09). LogDT and LSCS are closely correlated with r = 0·78 in mid-lactation. The correlation between logDT and LSCS was r = 0·58 in the initial lactation, whereas in late lactation a higher correlation of r = 0·65 could be obtained.
Discussion
Fixed effect models
From the eight fixed effects models the alternative with the Ali & Schaeffer function stratified by parity class shows the best fit. This result is in agreement with Kocak & Ekiz (Reference Kocak and Ekiz2008) and Buttchereit et al. (Reference Buttchereit, Stamer, Junge and Thaller2010). The random regression model for logDT and LSCS was used because fixed regression models imply that the shape of the lactation curve is the same for all cows and that they can only differ in height (Schaeffer & Jamrozik, Reference Schaeffer and Jamrozik2008). Moreover, random regression models could estimate covariance functions along a given trajectory (Van Der Werf et al. Reference Van Der Werf, Goddard and Meyer1998).
Lactation curves
Accurate knowledge about lactation curves is important for the management and research of dairy production systems (Cankaya et al. Reference Cankaya, Unalan and Soydan2011). For example, the first 50 DIM of lactation are most interesting because the majority of cases of mastitis occur when the physiological demands of the cow are already high (Heringstad et al. Reference Heringstad, Chang, Gianola and Klemetsdal2003; Hinrichs et al. Reference Hinrichs, Stamer, Junge and Kalm2005; Gross et al. Reference Gross, van Dorland, Bruckmaier and Schwarz2011). The lactation curves for LSCS (Fig. 1a) and logDT (Fig. 1b) nearly correspond to each other and the trend of LSCS showed a similar pattern for the different lactations as reported by Yamazaki et al. (Reference Yamazaki, Hagiya, Takeda, Sasaki, Yamaguchi, Sogabe, Saito, Nakagawa, Togashi, Suzuki and Nagamine2013). After the initial stage of lactation, LSCS and logDT were lowest for primiparous cows, higher for second-lactation cows and considerably larger for later parities. With respect to Jamrozik et al. (Reference Jamrozik, Bohmanova and Schaeffer2010) and Hossein-Zadeh (Reference Hossein-Zadeh2013), there is an increasing trend of somatic cells with the lactation number. After initial lactation, the concentration of somatic cells and as a consequence also the milk viscosity in milk increased. Later in the first lactation and in later parities, rises in SCC tend to be enduring and attained higher level (Haile-Mariam et al. Reference Haile-Mariam, Bowman and Goddard2001). In comparison, the previously mentioned difference between somatic cells in milk of cows in first, second and third and later parities was supported by the significant differences for the LSMs between lactations in this study (Table 5). The different shape of the LSCS curve compared with the logDT curve at the beginning and end of third and higher lactation could be explained, because cows in later lactations were relatively underrepresented in the current study.
Primiparous cows had a higher SCC and logDT in milk in the initial stage of lactation compared with multiparous cows, because somatic cells in milk have been found to increase immediately after calving, regardless of whether the cow is infected or not (Dohoo & Meek, Reference Dohoo and Meek1982). Early in first lactation, high milk yield might increase the cows’ susceptibility to mastitis and can result in high SCC (Haile-Mariam et al. Reference Haile-Mariam, Bowman and Goddard2001).
For third and higher parities, the shape of the LSCS lactation curves differed slightly from the logDT curve. This could be due to the fact that the health situation of multiparous cows is well-known from prior lactations. Although the udder health situation of each cow must be carefully checked before milking (Kamphuis et al. Reference Kamphuis, Pietersma, van der Tol, Wiedemann and Hogeveen2008a), older cows might be treated earlier at the beginning of lactation than cows in first parity.
Correlations between cow effects
It is well established that the increase of somatic cells in milk is associated with a declining milk yield (Miller et al. Reference Miller, Norman, Wiggans and Wright2004) as well as decreasing lactose, fat and casein content because of diminished synthesis. Furthermore, the whey protein fraction in milk increases by transfer from blood (Kitchen, Reference Kitchen1981; Woloszyn, Reference Woloszyn2007).
Different estimates of genetic and phenotypic correlations between LSCS and production traits were found in the literature. Results in the current study were supported by Yamazaki et al. (Reference Yamazaki, Hagiya, Takeda, Sasaki, Yamaguchi, Sogabe, Saito, Nakagawa, Togashi, Suzuki and Nagamine2013) who reported negative phenotypic correlations between LSCS and milk yield with r = −0·11 to −0·19 for the first lactation and r = −0·17 to −0·40 for the second lactation. According to Jamrozik et al. (Reference Jamrozik, Bohmanova and Schaeffer2010), the genetic correlation between LSCS and milk yield was slightly positive in first parity, and low or negative in second and later lactations.
Negative correlations between cow effects were found between LSCS and lactose content. This reflected the decline in lactose content under mastitic conditions reported in the literature (Berglund et al. Reference Berglund, Pettersson, Östensson and Svennersten-Sjaunja2007). Welper & Freeman (Reference Welper and Freeman1992) described a phenotypic and genetic correlation between lactose content and LSCS of r = −0·15 and r = −0·11, respectively. This may be due to the role of lactose in maintaining the osmotic balance during the milk secretion process. As SCC increases, salt concentrations increase, therefore less lactose is required to maintain the osmotic balance.
Different reports were found in literature concerning correlations between LSCS and protein or fat content. Schutz et al. (Reference Schutz, Hansen, Steuernagel, Reneau and Kuck1990) reported that phenotypic correlations with LSCS in first parity, second parity, third and later parities were higher for protein content (r = 0·09, 0·08, 0·10) than for fat content (r = −0·01, −0·06, −0·07). Furthermore, genetic correlations with LSCS in first parity, second parity, third and later parities were r = 0·11, r = 0·05 and r = 0·03 for protein content and r = 0·00, r = −0·14 and r = −0·20 for fat content. Protein percentage has been reported both to increase and to decrease in high LSCC milk (Kennedy et al. Reference Kennedy, Sethar, Moxley and Downey1982; Monardes & Hayes, Reference Monardes and Hayes1985). This agrees with present findings for varying correlations between cow effects between protein content and LSCS for 5–305 DIM. Fat percentage has been reported to be lower in high LSCC milk (Schutz et al. Reference Schutz, Hansen, Steuernagel, Reneau and Kuck1990; Welper & Freeman, Reference Welper and Freeman1992). This is in contrast to the present findings. Schalm & Noorlander (Reference Schalm and Noorlander1957) mentioned that the used reagent for the CMT was chosen because it did not involve the milk fat as part of the visible positive reaction with mastitic milk. This might be an explanation for the differences of the correlations found between logDT and fat content in this study and the reports in literature.
Correlations between cow effects for logDT and LSCS for 5–305 DIM were higher in this study than reported in the literature. Leslie et al. (Reference Leslie, Dingwell, Yan, Bashiri and Johnstone2007) and Kamphuis et al. (Reference Kamphuis, Sherlock, Jago, Mein and Hogeveen2008b) mentioned correlations of r = 0·71 and r = 0·76. Correlations between cow effects between logDT and LSCS alternated. In the initial lactation, a lower correlation coefficient than in late lactation was found. This could be due to the fact that the first individual test-day SCC is more strongly influenced by systematic environmental effects, such as stage of lactation, lactation number and season (Ali & Shook, Reference Ali and Shook1980; Emanuelson et al. Reference Emanuelson, Danell and Philipsson1988; Schutz et al. Reference Schutz, Hansen, Steuernagel, Reneau and Kuck1990). Nevertheless, based on the calculated correlations in this study, logDT could be an alternative daily obtained indicator for mastitis control compared with monthly LSCS records.
Conclusions
The fixed part of the logDT lactation curve was fitted the best by the AS function. The results of the current study support the hypothesis that the drain time has the ability to serve as an alternative daily obtained indicator for mastitis control compared with the monthly LSCC records. In a further step, corresponding treatment data will be attached to the data. Further research is needed, in particular to determine whether cows with an intramammary infection are recognised as having high drain time values.
We gratefully acknowledge the Federal Office for Agriculture and Food (Bonn-Mehlem, Germany) and the Federal Ministry of Food, Agriculture and Consumer Protection (Bonn, Germany) for financial support of the project ‘Innovative methods of trait recording in dairy cattle as a basis of the modern breeding programme of the Nord-Ost-Genetic’. Furthermore, gratitude is expressed to our cooperation partners Nord-Ost-Genetic GmbH & Co. KG (Verden an der Aller, Germany); Martin Luther University Halle-Wittenberg (Germany); Landesforschungsanstalt für Landwirtschaft und Fischerei MV (Mecklenburg-Vorpommern, Germany); Sächsisches Landesamt für Umwelt, Landwirtschaft und Geologie (Dresden, Germany); and Leibniz Institute for Farm Animal Biology (Dummerstorf, Germany). Special gratitude is expressed to Olaf Suhr and Andreas Springer from GEA Farm Technologies GmbH (Bönen, Germany) for helpful technical approaches.