





Introduction
Healthcare-associated infections (HAIs) are responsible for an estimated 72,000 deaths annually in the U.S. 1 While progress has been made in reducing most types of HAIs, approximately 1 in 31 hospitalized patients develop at least one infection. 1 Infections caused by multidrug-resistant organisms (MDROs) are particularly concerning given limited therapeutic options. Unfortunately, prior downward trends in MDROs reversed course during the COVID-19 pandemic, with a particular increase in hospital-onset infections observed starting in 2020. Reference Wolford, McCarthy and Baggs2 Wastewater sampling from 2024 suggests that the southeastern United States carries an outsized burden of these infections. Reference Kim, Zulli and Chan3 HAIs also contribute significantly to healthcare costs, with the combination of central line-associated bloodstream infections (CLABSIs), ventilator-associated pneumonia, surgical site infections, Clostridioides difficile infections, and catheter-associated urinary tract infections (CAUTIs) costing an estimated $10 billion annually. Reference Zimlichman, Henderson and Tamir4
It is intuitive and widely accepted that high hand hygiene adherence reduces HAIs. However, many of the studies looking at the relationship between improved hand hygiene adherence and HAIs are not high-quality studies with retrospective or quasi-experimental design, and results of these studies have been variable. Reference Backman, Zoutman and Marck5,Reference Mouajou, Adams, DeLisle and Quach6 Some studies that evaluated the impact of hand hygiene on HAIs have had small numerators and thus been underpowered to detect a significant difference. Reference Mouajou, Adams, DeLisle and Quach6–Reference Rupp, Fitzgerald and Puumala8 Additionally, hand hygiene adherence is often measured through direct observation, which is prone to the Hawthrone effect and overestimates true adherence. Reference Srigley, Furness, Baker and Gardam9,Reference Hagel, Ludewig and Pletz10
The limitations of direct observation have generated interest in alternative methods for hand hygiene monitoring. Reference Srigley, Furness, Baker and Gardam9,Reference Ward, Schweizer, Polgreen, Gupta, Reisinger and Perencevich11–Reference Masroor, Doll, Stevens and Bearman14 Automated hand hygiene monitoring systems (AHHMS) are an appealing solution to overcome the pitfalls of direct observation. They allow for much greater numbers of observations, including during nights and weekends. They eliminate observation bias and are less prone to the Hawthorne effect. However, these electronic systems have their own limitations. Reference Ward, Schweizer, Polgreen, Gupta, Reisinger and Perencevich11,Reference Conway, Riley, Saiman, Cohen, Alper and Larson15–Reference Ellingson, Polgreen and Schneider17 Most AHHMS only measure hand hygiene upon room entry and exit and therefore do not capture other key moments for hand hygiene, as outlined by the World Health Organization and the Centers for Disease Control and Prevention (CDC). Reference Boyce and Pittet18,19 Additionally, studies have found that installation of such systems without supplementary infection prevention measures may not result in improved hand hygiene adherence. Reference Conway, Riley, Saiman, Cohen, Alper and Larson15,Reference Kwok, Juergens and McLaws20 Justification for the adoption of AHHMS by hospitals is hampered by the cost of these systems and the lack of compelling evidence regarding their ability to reduce HAIs. Reference Cawthorne and Cooke21 In this study, we aim to assess if higher hand hygiene adherence rates as measured by an AHHMS are associated with lower rates of MDROs and other pathogens of epidemiologic significance.
Methods
Study setting
This retrospective cohort study was conducted at four acute care facilities within a large academic healthcare system in Atlanta, Georgia and included two community hospitals with 152 and 373 private rooms and two teaching hospitals with 537 and 582 private rooms. Across the four facilities, the study included 57 bedded units, 14 of which were ICUs. Maternity units and neonatal units were excluded, and there are no pediatric units in the healthcare system. The study period spanned from January 2021 to September 2022, following the implementation of an AHHMS in 2020 (Clean Hands—Safe Hands, Atlanta, GA; now part of SwipeSense, Atlanta, GA). During the study period, there were also hospital-level efforts to improve hand hygiene adherence. This study was approved by the university’s institutional review board.
Automated hand hygiene monitoring system
All inpatient rooms on the study units were equipped with hand hygiene sensors attached to the hand hygiene product dispenser at the entrance of each room. These sensors identified the unique Bluetooth beacon emitted by the badge worn by the care provider and detected motion into and out of patient rooms as well as the dispensing of alcohol-based hand rub or soap. If hand hygiene was not performed within five seconds of entering a patient’s room, a voice reminder prompted the provider to perform hand hygiene. All staff who provided direct patient care were asked to wear a badge, including nurses, nurse technicians, physicians, advanced practice providers and therapists, though badge wearing was not a mandatory requirement for employment. Hand hygiene adherence was recorded by the electronic system based on whether the healthcare worker dispensed hand hygiene product within a predetermined amount of time after being detected to have entered or exited the patient’s room. A hand hygiene opportunity was counted as adherent even if the voice reminder triggered, assuming hand hygiene product was dispensed within the predetermined time frame. Additional details on the functioning, components, and effectiveness of the AHHMS in increasing hand hygiene adherence are detailed in a separately published pilot study, which served to validate the AHHMS and tested the impact of different feedback strategies on improving hand hygiene adherence. Reference Steinberg, Tippett and Walsh22 The findings from this pilot study provided support for healthcare-system wide adoption of the AHHMS utilizing real-time voice reminders.
Data collection
This study uses hospital units and months as units of analysis. Hand hygiene data was extracted for all study units from the AHHMS. Pathogens of epidemiologic significance included methicillin-susceptible Staphylococcus aureus (MSSA), methicillin-resistant Staphylococcus aureus (MRSA), vancomycin-resistant Enterococci (VRE), extended-spectrum beta-lactamase (ESBL)-producing Enterobacterales, carbapenem-resistant Enterobacterales (CRE), and Clostridioides difficile (C. difficile). These organisms were selected based on their inclusion on CDC’s list of urgent or serious antibiotic resistance threats and relative abundance in our facilities. 23 Definitions for each organism can be found in Supplemental Table 1. Since most but not all are multidrug-resistant, we refer to these organisms collectively as MDRO+. Hospital-onset clinical cultures from all body sites (including non-sterile sites) were extracted from the electronic medical record for all MDRO+ other than C. difficile, which was specific to stool testing. Hospital-onset was defined as a specimen collected on or after hospital day 4, with each MDRO+ only being counted once per calendar month per patient. This simplified version of the CDC’s National Healthcare Safety Network (NHSN) criteria for healthcare facility-onset laboratory-identified events, which counts blood isolates as new after every 14 days rather than by calendar month, was selected to increase the specificity for true hospital-onset infections. 24
Statistical analysis
In descriptive analyses, we assessed correlations between unit-level hand hygiene adherence and hospital-onset-MDRO+ rates, defined as the number of MDRO+ detected per 1,000 patient-days. We analyzed each MDRO+ individually, composites of organisms with similar clinical characteristics and/or transmission potential (ie, MSSA + MRSA, MRSA + VRE, ESBL + CRE) and a composite of all MDRO+ organisms. We generated bar plots to display the mean MDRO+ rates per adherence bin (bins of 10%, eg 21%–30%) for each hospital. Further, we created scatterplots to examine the relationship between adherence and infection rates stratified by intensive care unit (ICU) vs non-ICUs. Locally estimated smoothing curves (LOESS) were overlaid to visualize trends and correlation coefficients to summarize the strength of the association. We present the median monthly MDRO+ rates by unit type, facility, and hand hygiene adherence levels measured in quartiles. Mixed-effect negative binomial regression models with an unstructured covariance matrix were used to evaluate associations between monthly average unit-level hand hygiene adherence (%) and MDRO+ rates per 1,000 patient-days, including units as a random intercept. The analysis was performed at the unit-month level and retained temporal variation rather than aggregating observations across time. This model was used to estimate rate ratios to assess the effect of a 1% increase in hand hygiene adherence on MDRO+ rates, while accounting for a one-month time lag between hand hygiene adherence and MDRO+ detection. We were limited to monthly intervals for potential time lags since adherence data were measured monthly. One month was chosen as our best clinical estimate, acknowledging that the true lag has not been well defined and likely varies widely between pathogen type and between individual patients. The one-month lag was incorporated by aligning monthly hand hygiene adherence values with MDRO+ rates observed in the subsequent month, ie hand hygiene adherence in month t−1 was used to predict MDRO+ rates in month t. In a sensitivity analysis, we analyzed the data without a time lag and found similar results. The models adjusted for unit type (ICU vs non-ICU), the number of clinical cultures and C. difficile tests ordered per month per hospital unit, and the average number of inpatient COVID-19 cases over a rolling seven-day period.
Results
During the 21-month study period, there were a total of 1,197 unit-month observations (N) across 752,341 patient days (119,695 ICU and 632,646 non-ICU patient days). Facility A, the smaller community hospital with two non-ICU wards and one ICU had 63 unit-month observations while the larger community hospital B had 336 unit-month observations. Both large teaching hospitals, hospitals C and D, had 399 unit-month observations.
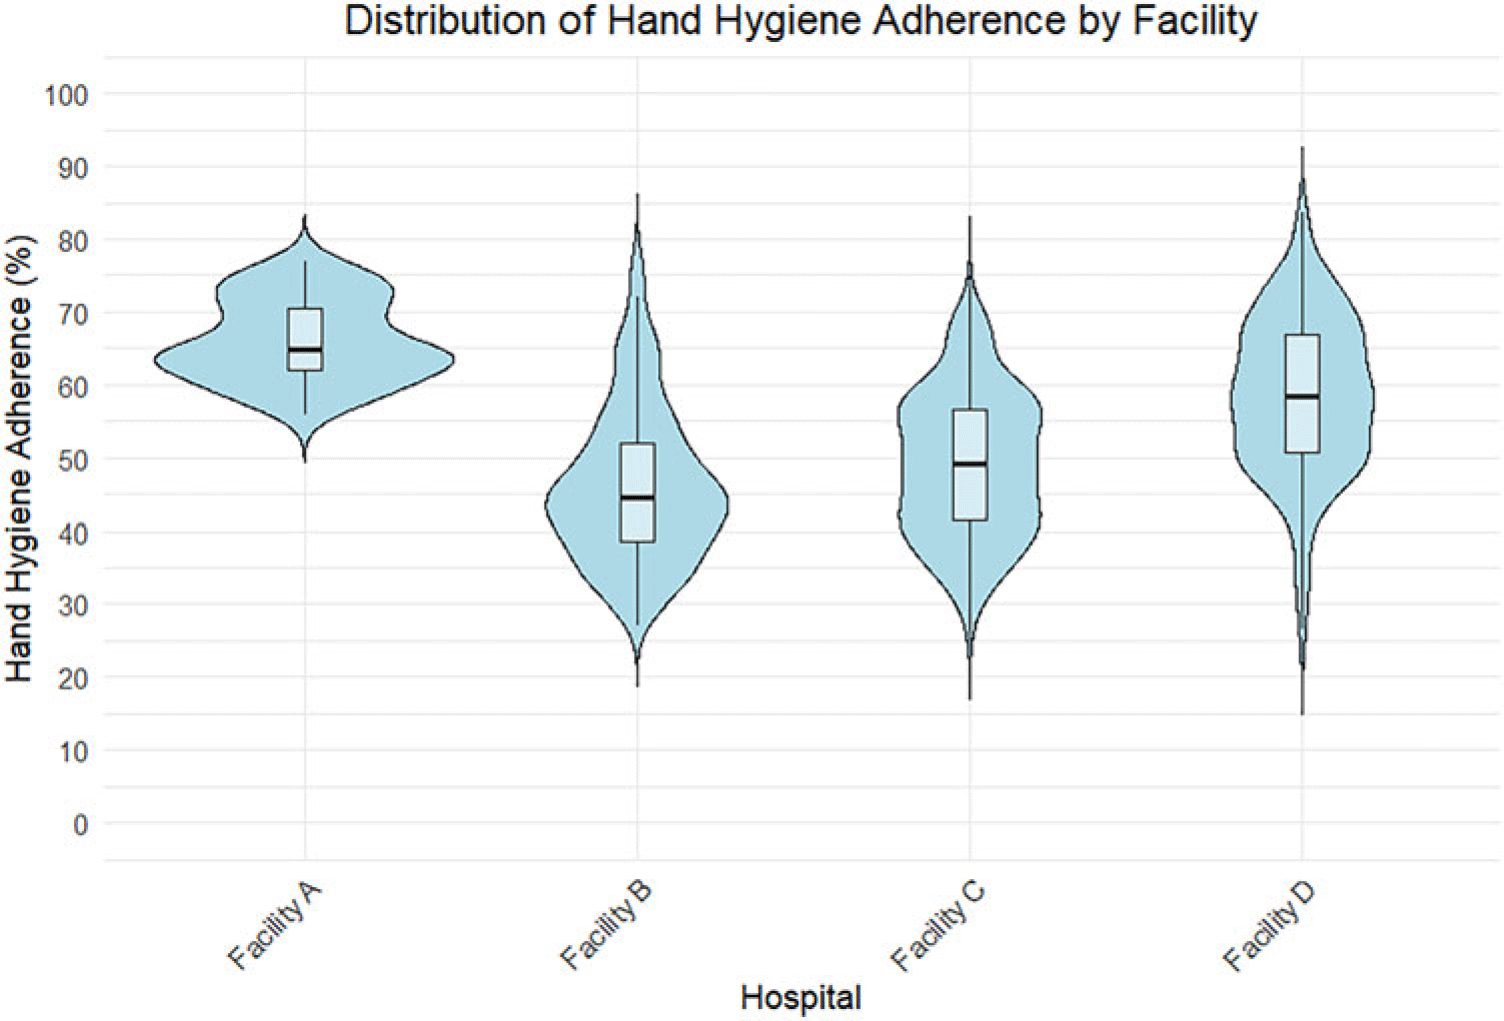
There were 22,767,036 hand hygiene opportunities recorded by the AHHMS during the study period. The mean monthly hand hygiene adherence rate was 52% (Interquartile-Range [IQR]: 43%–61%) over the study period. Hand hygiene adherence increased from 41% in January 2021 to 57% in September 2022 on average across units and facilities. Facility A had the highest average hand hygiene adherence at 65% followed by Facility D (59%). Facilities C and D, which are the largest facilities with greatest number of units and highest case mix index, had more variation in adherence (Figure 1). Average hand hygiene adherence was higher in ICUs (57%) compared to non-ICUs (50%).
Distribution of average hand hygiene adherence by facility, January 2021–September 2022.

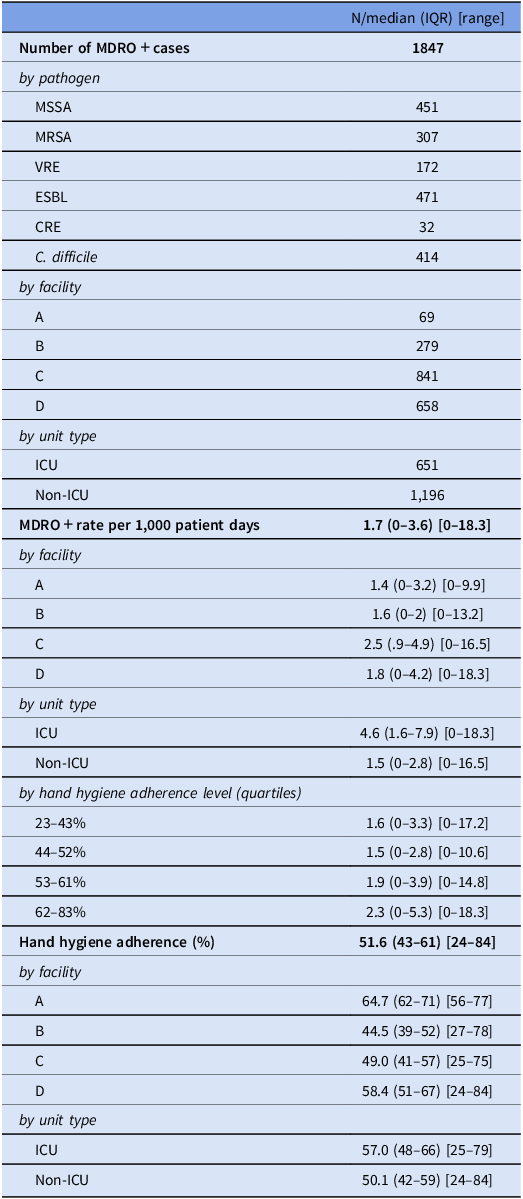
A total of 1,847 MDRO+ detections were observed in 752,341 patient days. Among specific pathogens, ESBL organisms were the most frequently reported, accounting for 471 positive cultures, followed by MSSA (n = 451) and C. difficile (n = 414), together representing nearly 72% of all positive tests. MRSA, VRE, and CRE were less commonly detected (Table 1). When examined by facility, the largest number of MDRO+ detections occurred at Facility C (n = 841), contributing nearly half of all MDRO+ detections.
Number of MDRO + Cases, MDRO + Rates, and hand-hygiene adherence levels by facility and unit-type

Table 1. Long description
A table with 18 rows and 4 columns. The columns are labeled ‘N/median (IQR) [range]’, ‘by pathogen’, ‘by facility’, ‘by unit type’, ‘by hand hygiene adherence level (quartiles)’, and ‘Hand hygiene adherence (%)’. The rows are labeled with specific pathogens, facilities, unit types, and hand hygiene adherence levels. The table provides data on the number of MDRO+ cases, MDRO+ rates per 1,000 patient days, and hand hygiene adherence percentages. Notable data points include the highest number of MDRO+ cases for ESBL organisms (471) and the highest MDRO+ rate per 1,000 patient days in ICUs (4.6). Facility C has the highest number of MDRO+ cases (841), and the highest hand hygiene adherence is observed in Facility D (58.4 percent).
MDRO+, multidrug-resistant organisms and other pathogens of interest; IQR, interquartile range; MSSA, methicillin-susceptible Staphylococcus aureus; MRSA, methicillin-resistant Staphylococcus aureus; VRE, vancomycin-resistant Enterococci; ESBL, extended-spectrum beta-lactamase-producing Enterobacterales; CRE, carbapenem-resistant Enterobacterales; C. difficile, Clostridioides difficile; ICU, intensive care unit.
The median composite MDRO+ rate across all facilities was 1.7 per 1,000 patient days (IQR: 0–3.6). ICUs exhibited a higher MDRO+ rate with a median rate of 4.6 (IQR: 1.6–7.9) compared to 1.5 (IQR: 0–2.8) in non-ICUs. In crude descriptive analyses, units with higher hand hygiene adherence had a greater MDRO+ rate. Specifically, unit-months with adherence rates of 62%–83% (highest fourth quartile) had an average MDRO+ rate of 2.3 per 1,000 patient days (IQR: 0–5.3), compared to 1.6 (IQR: 0–3.3) in those with adherence rates of 23%–43% (lowest quartile). In Figure 2, we visually examine the relationship between hand hygiene adherence (%) and corresponding MDRO+ rates per 1,000 patient days, stratified by ICU versus non-ICU across five pathogen categories: MSSA+ MRSA, MRSA+ VRE, ESBL+ CRE, C. difficile, and overall MDRO+. LOESS curves were overlaid to assess trends within ICU and non-ICUs. Across all pathogens, there was no strong inverse association observed between hand hygiene adherence and MDRO+ rates. The overall correlation coefficients (r) ranged from 0.09 (C. difficile) to 0.19 (total MDRO+), suggesting weak positive associations in most categories. For the MRSA and VRE composite and the MSSA and MRSA composite, a moderate upward trend was observed, particularly for ICUs, although the correlation coefficients remained weak (r = 0.16 and 0.14 respectively). We assessed facility-specific trends between mean MDRO+ rates and binned hand hygiene adherence across the 4 facilities and found non-linear trends (Figure 3). Facility A displayed a relatively flat pattern with little variation in MDRO+ rates across adherence bins. Facilities B, C, and D displayed modest upward trends with MDRO+ rates increasing with adherence and then slightly tapering in higher bins (70%–90%). MDRO+ rates remained relatively stable over the study period, fluctuating between 2.2 and 2.8 cases per 1,000 patient-days per month (Figure 4). Visual inspection of temporal trends points to a possible inverse relationship between hand hygiene adherence and MDRO+ rates in the first half of the study period but this did not persist in the second half of the study period (Figure 4).
Association between MDRO+ rate per 1,000 patient days and hand hygiene adherence (%) by unit and pathogen type. MDRO+, multidrug-resistant organisms and other pathogens of interest; MRSA, methicillin-resistant Staphylococcus aureus; MSSA, methicillin-susceptible Staphylococcus aureus; VRE, vancomycin-resistant Enterococci; CRE, carbapenem-resistant Enterobacterales; ESBL, extended-spectrum beta-lactamase-producing Enterobacterales; C. difficile, Clostridioides difficile; ICU, intensive care unit.

Average MDRO+ rate per 1,000 patients and hand hygiene adherence bin by facility. MDRO+, multidrug-resistant organisms and other pathogens of interest. Dotted line reflects the average trend.

Figure 3. Long description
Panel A: A bar graph showing the relationship between hand hygiene adherence and average MDRO+ rates for Facility A. The horizontal axis represents hand hygiene adherence bins in percent, ranging from 20 to 90 percent. The vertical axis represents the average MDRO+ rate per 1,000 patient days, ranging from 0 to 4. The bars are vertical and colored green. The data shows relatively consistent MDRO+ rates across different hand hygiene adherence bins, with rates around 2 per 1,000 patient days. A dotted line reflects the average trend. Panel B: A bar graph showing the relationship between hand hygiene adherence and average MDRO+ rates for Facility B. The horizontal axis represents hand hygiene adherence bins in percent, ranging from 20 to 90 percent. The vertical axis represents the average MDRO+ rate per 1,000 patient days, ranging from 0 to 4. The bars are vertical and colored orange. The data shows an increasing trend in MDRO+ rates with higher hand hygiene adherence, peaking at around 3 per 1,000 patient days. A dotted line reflects the average trend. Panel C: A bar graph showing the relationship between hand hygiene adherence and average MDRO+ rates for Facility C. The horizontal axis represents hand hygiene adherence bins in percent, ranging from 20 to 90 percent. The vertical axis represents the average MDRO+ rate per 1,000 patient days, ranging from 0 to 4. The bars are vertical and colored blue. The data shows a peak in MDRO+ rates at the 60 to 70 percent hand hygiene adherence bin, with rates around 4 per 1,000 patient days. A dotted line reflects the average trend. Panel D: A bar graph showing the relationship between hand hygiene adherence and average MDRO+ rates for Facility D. The horizontal axis represents hand hygiene adherence bins in percent, ranging from 20 to 90 percent. The vertical axis represents the average MDRO+ rate per 1,000 patient days, ranging from 0 to 4. The bars are vertical and colored purple. The data shows a peak in MDRO+ rates at the 70 to 80 percent hand hygiene adherence bin, with rates around 4 per 1,000 patient days. A dotted line reflects the average trend.
Average MDRO+ rate per 1,000 patients and hand hygiene adherence over time. MDRO+, multidrug-resistant organisms and other pathogens of interest.

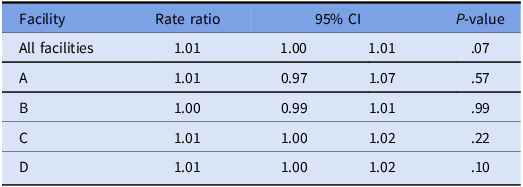
Results from the negative binomial mixed effects regression (Table 2) with a one-month time lag between hand hygiene adherence and MDRO+ detection found that for all sites combined, for a 1% increase in hand hygiene adherence, the MDRO+ rate did not change significantly with a rate ratio of 1.01 (95% CI: 1.00–1.01) and P value of .07. This suggests a null association between hand hygiene adherence and MDRO+ rates after adjusting for unit type, average number of COVID-19 cases, and number of MDRO+ tests ordered (Table 1). The observed effects remained consistent across individual facilities. In a sensitivity analysis, we analyzed the results without the one-month time lag and found similar results (RR: 1.00, 95% CI: 1.00–1.01). To explore the possibility that hand hygiene adherence only impacts MDRO+ detection above a certain threshold, we performed a separate sensitivity analysis restricted to unit-month observations that had a hand hygiene adherence rate over 60% (30% of the data) and still did not see an effect (RR: 1.01, 95% CI: 1.00, 1.03). Additionally, the effect estimates remained the same after adjustment for calendar time in a separate sensitivity analysis.
Association between MDRO + Rate per 1,000 patient days (with one month lag) and hand hygiene adherence using a negative binomial mixed effects regression*

Table 2. Long description
A table titled Association between MDRO+ Rate per 1,000 patient days (with one month lag) and hand hygiene adherence using a negative binomial mixed effects regression. The table has four rows and four columns. The columns are labeled Facility, Rate ratio, 95% CI, and P-value. The row labels are All facilities, A, B, C, and D. Row 1: All facilities, Rate ratio 1.01, 95% CI 1.00 to 1.01, P-value .07. Row 2: Facility A, Rate ratio 1.01, 95% CI 0.97 to 1.07, P-value .57. Row 3: Facility B, Rate ratio 1.00, 95% CI 0.99 to 1.01, P-value .99. Row 4: Facility C, Rate ratio 1.01, 95% CI 1.00 to 1.02, P-value .22. Row 5: Facility D, Rate ratio 1.01, 95% CI 1.00 to 1.02, P-value .10. The table presents the results of a negative binomial mixed effects regression analysis examining the association between hand hygiene adherence and MDRO rates across different facilities. The rate ratio, 95% confidence interval, and P-value are provided for each facility, indicating the effect of a 1% increase in hand hygiene adherence on MDRO rates.
MDRO+, multidrug-resistant organisms and other pathogens of interest; CI, confidence interval.
*Adjusted for number of clinical cultures and Clostridioides difficile tests ordered, unit type (intensive care unit vs non-intensive care unit), and average inpatient COVID-19 cases in a 7-day period, with random intercepts for units.
Discussion
In this study, we examined the relationship between hand hygiene adherence and hospital-onset MDRO+ rates across multiple acute care hospitals after implementation of an AHHMS. Overall hand hygiene adherence improved during the study period, and visually an inverse relationship between hand hygiene adherence and hospital-onset MDRO+ rates appeared to exist early in our study period (Figure 4). However, we were unable to demonstrate a clear unit-level inverse association between hand hygiene adherence and MDRO+ rates when controlling for the number of clinical cultures and C difficile tests ordered per month, unit type (ie, ICU versus non-ICU), and inpatient COVID-19 cases.
One explanation for our findings is that unmeasured factors likely influence the relationship between hand hygiene adherence and MDRO+ detection. This is evidenced by the fact that units with higher hand hygiene adherence had a greater MDRO+ rate in our analysis. This may reflect more attention to hand hygiene in ICUs and other units that house our most medically complex patients with high acuity and long lengths of stay, putting them at greater risk for being colonized or infected with an MDRO+. Not surprisingly, the hospital with the highest MDRO+ rate (Facility C) cares for the most medically complex and highly immunocompromised patient population, underscoring this point. Relatedly, hospital infection prevention measures introduce the potential for reverse causality, where low hand hygiene adherence in a unit may lead to increased attention from infection prevention teams, thereby reinforcing other MDRO+ prevention measures. Reference McLaws25 On the other hand, in units with low MDRO+ prevalence, infection prevention teams may be less present, allowing hand hygiene adherence to drift downwards. Another challenge is that not all MDRO+ detections reflect true nosocomial acquisition, as some patients have undetected colonization present on admission. Finally, some routes of MDRO+ transmission are unrelated to lapses in hand hygiene, including tap water exposures and insufficient cleaning of the patient environment or supplies, which confounds this analysis.
A limitation of our study is that not all healthcare workers wore a badge during the study period, suggesting that electronically derived hand hygiene adherence data may not reflect true compliance. The variability in adherence between units and months may reflect differences in badge-wearing behaviors rather than actual hand hygiene practices. Additionally, for those individuals who are badged, the AHHMS only captures hand hygiene adherence at room entry and exit and not at other key moments for hand hygiene, such as after touching a patient or their environment. The system also cannot measure the quality of hand hygiene performed, which can be difficult to capture even with direct observation programs.
Another potential limitation is that the hand hygiene adherence rates measured in the study (average 57% with unit-to-unit variation) may not be sufficiently high to appreciably impact HO-MDRO+ rates. Some studies have reported reductions in HAIs when hand hygiene adherence exceeds 60%, though the optimal target remains uncertain. Reference Mouajou, Adams, DeLisle and Quach6 On visual inspection, MDRO+ rates appeared to dip down in the highest bins of hand hygiene adherence in our data, though we still did not observe an effect via a sensitivity analysis restricted to unit-month observations that had a hand hygiene adherence rate over 60%. This suggests the need for future research to determine if there is a hand hygiene threshold at which we can expect reductions in MDRO+ rates, which may vary based on unit type and baseline rates of both hand hygiene adherence and MDROs.
While hand hygiene adherence improved post implementation of an AHHMS, we were unable to demonstrate a direct impact on MDRO+ rates. The interplay between hand hygiene, infection prevention efforts, and MDRO acquisition is complex, and an absence of proof does not negate the importance of hand hygiene. However, facilities considering adopting an AHHMS need to recognize the challenges in quantifying the value of such systems. Future research should explore how the implementation of AHHMS can be most impactful, considering variables such as who wears the badge and how to capture key opportunities for hand hygiene besides room entry and exit.
Supplementary material
The supplementary material for this article can be found at https://doi.org/10.1017/ice.2026.10524.
Acknowledgments
None.
Financial support
The authors received grant support from the Emory Prevention Epicenter Program (PEACH) through the Centers for Disease Control and Prevention (CDC) [U54CK000601]. This content is solely the responsibility of the authors and does not necessarily represent the official views of the CDC.
Competing interests
S.K.F. reports that Emory University received a services agreement from Pfizer for surveillance research activities on Clostridioides difficile and Neisseria meningitides starting in 2026 for 2 years. The remaining authors report no conflicts of interest relevant to this article.




 Open access

