Introduction
The domestic goat, Capra hircus L., also known as “poor man's cow” is an important livestock species that contributes to the economy of many developing countries through the production of meat, milk, fiber, and skin (MacHugh and Bradley, Reference MacHugh and Bradley2001; Abdul-Aziz, Reference Abdul-Aziz2010; Rout et al., Reference Rout, Thangara, Mandal and Roy2012). In Nigeria, goats play diverse roles in the economy, culture and religion of the people, with wide distribution across all agro-ecological zones of the country from the coastal South to the Arid North (Okpeku et al., Reference Okpeku, Ozoje, Adebambo, Agaviezor, O'Neill and Imumorin2011a, Reference Okpeku, Yakubu, Peters, Ozoje, Ikeobi, Adebambo and Imumorin2011b). Goats are the largest group of ruminant livestock in Nigeria totalling about 55.8 million (FAOSTAT, 2013), with various surveys showing that up to 85 percent of rural households, poor farmers, small business owners of both sexes and all age groups raise them (Bayer, Reference Bayer, von Kaufman, Chater and Blench1986). Nigerian goats are able to tolerate harsh climates, thrive on poor-quality diets provided by scarce grazing on marginal lands (Okpeku et al., Reference Okpeku, Ozoje, Adebambo, Agaviezor, O'Neill and Imumorin2011a, Reference Okpeku, Yakubu, Peters, Ozoje, Ikeobi, Adebambo and Imumorin2011b), and the presence of trypanotolerance in some breeds (Abdul-Aziz, Reference Abdul-Aziz2010) are advantages for their production and management. Moreover, their small size, low maintenance requirements and short generation interval (Okpeku et al., Reference Okpeku, Yakubu, Peters, Ozoje, Ikeobi, Adebambo and Imumorin2011b) underscores their importance for increasing production efficiency in rural agricultural systems verses other livestock species (Amills et al., Reference Amills, Ramirez, Tomas, Badaoui, Marmi, Acosta, Sanchez and Capote2009; Rout et al., Reference Rout, Thangara, Mandal and Roy2012).
Recent archaeological and molecular biological studies suggested that goats originated in West Asia. However, very little is known of the processes leading to their domestication such as the timing of population expansion and the dynamics of their selection pressures (Nomura et al., Reference Nomura, Yonezawa, Mano, Kawakami, Shedlock, Hasegawa and Amano2013).
The hypervariable region I (HVR1) of mitochondrial DNA (mtDNA) contains highly informative polymorphic sites due to its: (1) simple maternal inheritance without recombination, (2) relatively rapid evolution rate; endpoints useful for diversity studies in many organisms and species (Brown et al., Reference Brown, Gadaleta, Pepe and Saccone1986; Bradley et al., Reference Bradley, Machugh, Cunningham and Loftus1996; Luikart et al., Reference Luikart, Giellly, Excoffier, Vigne, Bouuvet and Taberlet2001; Amills et al., Reference Amills, Ramirez, Tomas, Badaoui, Marmi, Acosta, Sanchez and Capote2009; Zhong et al., Reference Zhong, Zhao, Niu, Wang, Jin, Zhao, Wang, Li, Zhang and Ma2013; Akis et al., Reference Akis, Oztabak, Mengi and Un2014; Zhao et al., Reference Zhao, Zhong, Wang, Li and Zhang2014). The mtDNA polymorphisms have been largely applied not only to better understand phylogenetic relationships in many animal species, including cattle (Bradley et al., Reference Bradley, Machugh, Cunningham and Loftus1996; Mannen, Nagata and Tsuji, Reference Mannen, Nagata and Tsuji2001; Troy et al., Reference Troy, Machugh, Bailey, Magee, Loftus, Cunningham, Chamberlain, Sykes and Bradley2001; Kim et al., Reference Kim, Li, Guo, Li, Holmkvist, Hansen, Pedersen, Wang and Nielsen2010; Taberlet et al., Reference Taberlet, Coissac, Pansu and Pompanon2011), chickens (Niu et al., Reference Niu, Fu, Luo, Ruan, Yu, Chen and Zhang2002; Liu et al., Reference Liu, Wu, Yao, Miao, Luikart, Baig, Beja-Pereira, Ding, Palanichamy and Zhang2006), horses (Vilà et al., Reference Vilà, Leonard, Götherström, Marklund, Sandberg, Lidén, Wayne and Ellegren2001; Lira et al., Reference Lira, Linderholm, Olaria, Brandstrom Durling, Gilbert, Ellegren, Willerslev, Liden, Arsuaga and Gotherstrom2010) and goats (Mannen, Nagata and Tsuji, Reference Mannen, Nagata and Tsuji2001; Sultana, Mannen and Tsuji, Reference Sultana, Mannen and Tsuji2003; Chen et al., Reference Chen, Su, Wu, Sha and Zhang2005; Pereira et al., Reference Pereira, Pereira, Van Asch, Bradley and Amorim2005; Naderi et al., Reference Naderi, Rezaei, Taberlet, Zundelm, Rafat, Naghashm, el-Barody, Ertugrul and Pompanon2007; Okpeku et al., Reference Okpeku, Ozoje, Adebambo, Agaviezor, O'Neill and Imumorin2011a, Reference Okpeku, Yakubu, Peters, Ozoje, Ikeobi, Adebambo and Imumorin2011b; Zhong et al., Reference Zhong, Zhao, Niu, Wang, Jin, Zhao, Wang, Li, Zhang and Ma2013; Akis et al., Reference Akis, Oztabak, Mengi and Un2014; Zhao et al., Reference Zhao, Zhong, Wang, Li and Zhang2014), but also to understand maternal origin and migration of livestock. Based on the phylogenetic analyses of caprine mtDNA polymorphisms, at least four mtDNA lineages (A–D) have been discovered, with the lineage A group being the most diverse and widely distributed in comparison with other lineages (Luikart et al., Reference Luikart, Giellly, Excoffier, Vigne, Bouuvet and Taberlet2001; Sultana, Mannen and Tsuji, Reference Sultana, Mannen and Tsuji2003; Chen et al., Reference Chen, Su, Wu, Sha and Zhang2005; Akis et al., Reference Akis, Oztabak, Mengi and Un2014). Luikart et al. (Reference Luikart, Giellly, Excoffier, Vigne, Bouuvet and Taberlet2001) assessed the phylogenetic history and matrilineal population structure of 406 domestic goats representing 88 breeds across the world and identified three highly divergent lineages A–C. More recently, Naderi et al. (Reference Naderi, Rezaei, Taberlet, Zundelm, Rafat, Naghashm, el-Barody, Ertugrul and Pompanon2007) analysed 2 430 domestic goat samples from all over the old world and identified three additional lineages (A–G).
Although a few studies examining the nuclear microsatellite DNA of Nigerian goats have been reported (Adebambo, Reference Adebambo2003; Muema et al., Reference Muema, Wakhungu, Hanotte and Jianlin2009; Okpeku et al., Reference Okpeku, Ozoje, Adebambo, Agaviezor, O'Neill and Imumorin2011a, Reference Okpeku, Yakubu, Peters, Ozoje, Ikeobi, Adebambo and Imumorin2011b), there is no published report on mtDNA diversity in Nigerian goats. Therefore, we have investigated the HVR1 of the caprine mitochondrial genome in three major Nigerian goat breeds sequences along with archived sequences from Africa and Asia available on NCBI to gain a better understanding of matrilineal origin of Nigerian goats, gain insight into demographic distribution and understanding goat domestication and adaptation. This will be important in facilitating the development of new approaches to improve selection and mating systems for animal breeding and conservation programmes.
Materials and methods
Sample collection and DNA isolation
Whole blood was collected from 291 unrelated goats belonging to three major goat breeds [140 Red Sokoto (RSO); 53 Sahel (SAH) and 97 West African Dwarf (WAD)]. Samples were collected from 19 different locations covering the five agro-ecological zones in the country (Figure 1). Efforts were made to collect samples from unrelated goats, based on the pedigree information provided by owners. Blood samples were collected by jugular venipuncture and DNA was isolated using ZymoBead™ Genomic DNA kit (Zymo Research Corporation, Irvine, CA, USA) following the manufacturer's instructions. Quantification of DNA yield and assessment of quality were done using a Nanodrop; ND-100 UV/Vis Spectrophotometer (Nanodrop Technologies, Inc., Wilmington, DE, USA).
Map of Nigeria showing sampled locations.

PCR amplification and DNA sequencing
To amplify the HVRI of goat mtDNA, a pair of primers was designed using the known goat mtDNA sequence (AB044304, FAOSTAT, 2013) in the GENETOOL package and synthesized in an ABI 392 Oligosynthesizer (Perkin Elmer, Foster City, CA). Primer sequences were as follows: forward 5′-CATCCATATAACGCGGACAT-3′ and reverse 5′-GTGTGAGCATGGGCTGATTA-3′. PCR amplification was carried out in a 10 µl reaction volume containing 5 ng of DNA, 10 pM of each primer, 200 pM of dNTPs, 1× PCR buffer containing 2 mM MgCl2, and 2 U of AmpliTaq Gold (Perkin Elmer, Foster City, CA). Amplification was performed in a Veriti thermal cycler (Applied Biosystems, Carlsbad, CA) employing the following conditions: 94 °C for 5 min; 35 cycles at 94 °C for 30 s, 54 °C for 45 s and 72 °C for 2 min; and final extension at 72 °C for 5 min. The amplicons were sequenced using BigDye™ (Applied Biosystems, Foster City) Terminator cycle sequencing kit in ABI Prism 3730 DNA Analyser (Applied Biosystems, Foster City) following manufacturer's protocol.
Data analysis
Five hundred and thirty three (503) base pairs from the mtDNA HVRI region of 291 goats of three Nigerian breeds, 366 sequences from 11 breeds of Indian goats, one breed each from Kenya, China and Korea and a sequences from Sheep (Ovis aries) was used as an outgroup (downloaded from NCBI; accession numbers AY155674 to AY156039, KJ420485, KJ420476, KJ420443, KJ420458, KJ420481, KJ420480.1 KJ420474, EU126792, AY853293, KP164694, KP164705, DQ188864, GQ141240, DQ188851, DQ121618, KP120664, KP120665, KP120646, KP120646, KP120622, EF490471 and AJ317864 to AJ31787 respectively), were aligned using ClustalW software package (Thompson, Higgins and Gibson, Reference Thompson, Higgins and Gibson1994). The MEGA 6.0 (Tamura et al., Reference Tamura, Stecher, Peterson, Filipski and Kumar2013) and DNASP software package version 5.10.01 (Librado and Rozas, Reference Librado and Rozas2009) were used for formatting the sequences to make them compatible with the desired software. Median joining networks (Bandelt, Forster and Rohl, Reference Bandelt, Forster and Rohl1999) were drawn using the Network 3.1.1.1 software (http://www.fluxus-engineering.com). Haplotype diversity, SE, Fu's Fs statistics (Fu, Reference Fu1997), mismatch analysis (Schneider et al., Reference Schneider, Kueffer, Roessli and Excoffier1999), analysis of molecular variance (AMOVA), mean number of pairwise differences and population pairwise F ST values were computed using ARLEQUIN version 2.001 (http://anthropologie.unige/arlequin) (Excoffier, Smouse and Quattiro, Reference Excoffier, Smouse and Quattiro1992). F ST values were calculated using 1 000 bootstraps. These F ST values were used to reconstruct an NJ/UPGMA tree in comparison with Indian and wild goat breeds using the MEGA package version 6.0 (Tamura et al., Reference Tamura, Stecher, Peterson, Filipski and Kumar2013). DnaSP program, version 5.10.01 (Librado and Rozas, Reference Librado and Rozas2009) was used for estimating haplotype and nucleotide diversity.
Results
mtDNA HVR1 variation in Nigerian goats
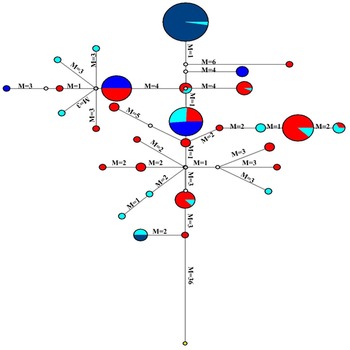
The sequences from the study have been deposited in GenBank and published with accession numbers KM582169–KM582416. Analysis of mitochondrial HVR1 sequences in Nigerian goats revealed 204 different haplotypes. In addition to base substitutions and deletions, a 75 base insertion was observed in one individual belonging to WAD breed. The number of haplotypes found in each breed ranged from 24 in RS to 58 in WAD. Haplotype diversity values for the breeds were 0.465, 0.985 and 0.982 for RSO, SAH and WAD, respectively (Table 1). Transition–transversion ratios were found to be 1.6:1, 2:1 and 3.5:1 for RSO, SAH and WAD, respectively, while the total calculated for the study was 7.1:1. Median joining networks (Figure 2) were constructed based on the data obtained from transition and transversion ratios using the Network for phylogeny software. The network indicated considerable diversity, with the central node having the highest haplotype frequency of 105 made up of 3.81 percent SAH goats, 5.71 percent RS and 90.48 percent WAD. Of interest, other nodes in the network also contained more than one haplotype group.
Median joining network of goat mtDNA distribution among Nigerian goat breeds with sheep mtDNA as an out group. Circles represent haplotypes and have a size proportional to frequency. Mutational differences are shown on lines. Colour Legend: Red Sokoto = Red, West African Dwarf (WAD) = Deep Blue, Sahel = Sky Blue, sheep = Yellow.

Genetic diversity parameters for HVRI sequences of the Nigerian goat breeds.

NS, number of sequences; H, number of haplotypes; H d, haplotype diversity; K, average number of nucleotide differences; π, nucleotide diversity π s, synonymous nucleotide diversity; π a, non-synonymous nucleotide diversity; S, number of polymorphic sites; SP, singleton variable sites; PIP, parsimony informative sites; dN/dS, Tajima ratio of non-synonymous to synonymous nucleotide diversity.
Genetic diversity and population expansion
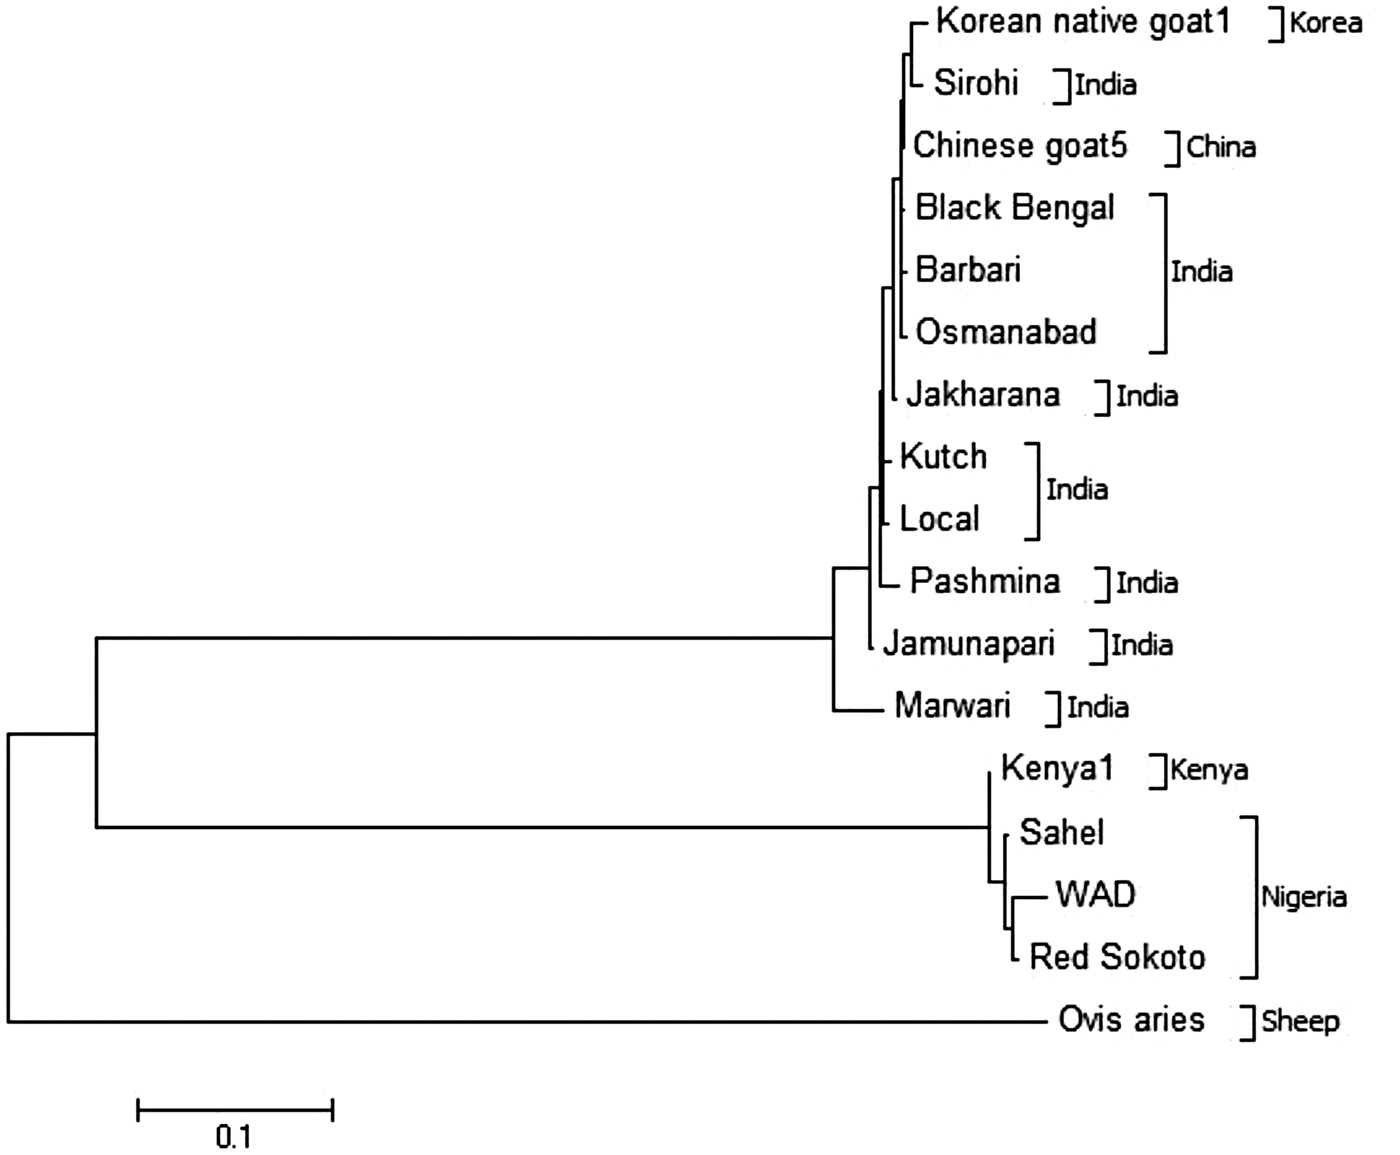
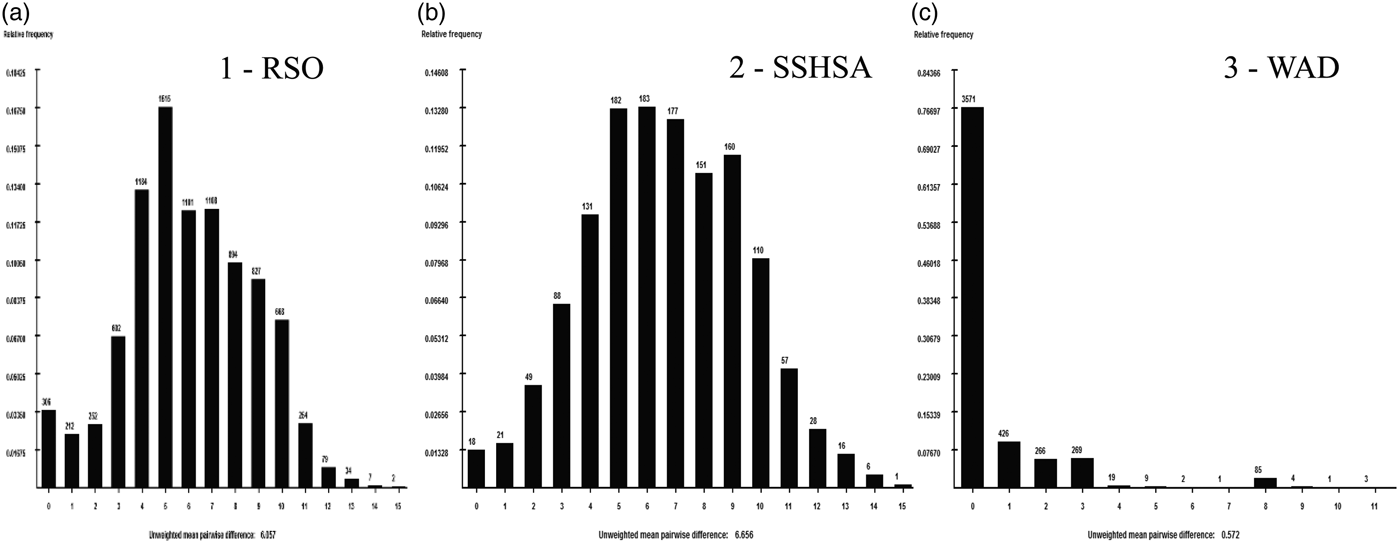
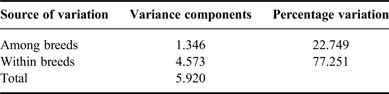
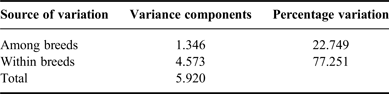
For comparison, a neighbour-joining (NJ) tree (Figure 3) was constructed using MEGA 6.0 (Tamura et al., Reference Tamura, Stecher, Peterson, Filipski and Kumar2013), with Nigerian goat sequences, 363 Indian goat sequences and ten sequences from wild goats. All Nigerian goats clustered together at the top of the NJ tree and were followed by a cluster of Indian domestic goats. The wild goat types used as an out-group diverged from Indian goats as expected. However, clear differences were observed within the domestic goats of India and the Nigerian goat populations. In the Nigerian goat populations, WAD clearly separated from RSO and SAH goats. Further, genetic analysis based on AMOVA (Table 2) demonstrated that the largest genetic variation (77.25 percent) in all of these goat breeds is accounted for by within-group variation, while among-group variation accounted for approximately a quarter (22.75 percent) of the total genetic variation. Genetic distances between breeds were calculated taking into account the molecular distances between haplotypes, and the resulting F ST values were positively correlated (Figure 3). Mismatch distributions (Figure 4) showed smooth and predominantly unimodal curves but not for WAD (Figure 4, No. 3). This breed appeared to have had a different demographic history from the other two studied breeds.
NJ tree of Nigerian, Indian and wild goat breeds compared with wild goat mtDNA sequences.

Mismatch distributions for mtDNA types of Nigerian goat breeds. (a) Red Sokoto, (b) Sahel, (c) WAD.

Result of AMOVA among Nigerian goat breeds base on mtDNA HVR1 sequence.
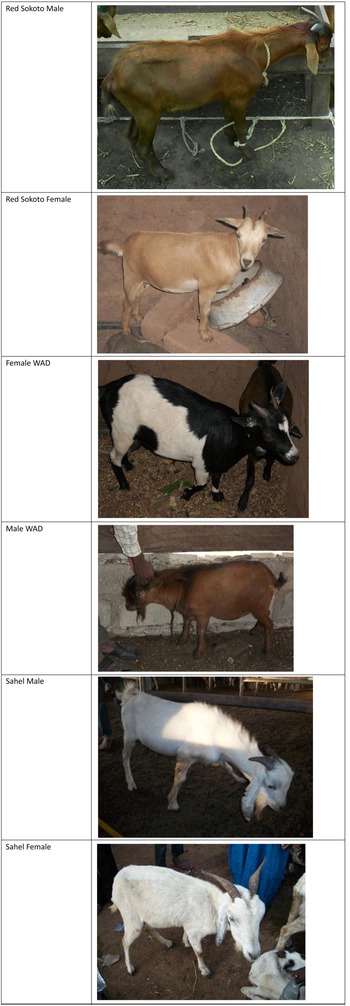
The results of DnaSP analysis indicated that the selected region (1–620) of the 291 sequences from the three Nigerian goat breeds have sites excluding sequences with gaps (35). The number of polymorphic sites, singleton variable sites and parsimony informative sites for individual breed sequences are higher than those for the entire sequences. SAH goat sequences had the highest value of haplotype diversity and average number of nucleotide difference (0.982 and 6.203), respectively followed by WAD goats. WAD had highest haplotype number (58) and nucleotide diversity (0.259) followed by SAH (40 and 0.204), respectively. Synonymous nucleotide diversity is less than non-synonymous nucleotide diversity in WAD and RSO goats (Table 1). The ratio of dN/dS was greater than 1.0 in WAD and RSO goats while less than 1.0 in SAH goats. The pictures of the three breeds of Nigerian goats used in this study are presented in Figure 5.
Pictures of the three breeds of Nigerian goats.

Discussion
The present work is the first substantial diversity study of Nigerian goats based on mtDNA HVR1 sequences. Nigerian goat mtDNA sequences showed some degree of diversity in the HVR1 region. The total number of haplotypes generated in this study for Nigerian goats was similar to the results reported in the literature, which supports a high degree of diversity in goat populations (Joshi et al., Reference Joshi, Rout, Mandal, Tyler-Smith, Singh and Thangaraj2004; Çinarkul and Ertugrul, Reference ÇinarKul and Ertugrul2011; Zhong et al., Reference Zhong, Zhao, Niu, Wang, Jin, Zhao, Wang, Li, Zhang and Ma2013; Akis et al., Reference Akis, Oztabak, Mengi and Un2014; Zhao et al., Reference Zhao, Zhong, Wang, Li and Zhang2014). In Indian goats, Joshi et al. (Reference Joshi, Rout, Mandal, Tyler-Smith, Singh and Thangaraj2004) reported 200 haplotypes in 363 sequences from ten populations. Çinarkul and Ertugrul (Reference ÇinarKul and Ertugrul2011) reported 208 haplotypes in Turkish goat populations. These results also compare well with a recent study in Chinese goats, which observed a total of 192 haplotypes with 141 variable sites with haplotype and nucleotide diversities based on 481-bp segment of the mtDNA D-loop region, indicating a relatively high genetic diversity in Chinese black goats (Zhong et al., Reference Zhong, Zhao, Niu, Wang, Jin, Zhao, Wang, Li, Zhang and Ma2013). Median joining network constructed from transition and transversion data revealed considerable diversity and interrelatedness among the different Nigerian goat's breeds in the present study. Okpeku et al. (Reference Okpeku, Ozoje, Adebambo, Agaviezor, O'Neill and Imumorin2011a, Reference Okpeku, Yakubu, Peters, Ozoje, Ikeobi, Adebambo and Imumorin2011b) working with microsatellites reported interrelatedness in Nigerian goat breeds, which could be attributed to uncontrolled breeding among different breeds and a subsequent reduction in heterozygosity. This heterozygote deficiency have been reported to arise due to population sub-structure from pooling together different populations resulting in genetic admixture (Cerda-Flores et al., Reference Cerda-Flores, Villalobos-Torres, Barrera-Saldaña, Cortés-Prieto, Barajas, Rivas, Carracedo, Zhong, Barton and Chakraborty2002; Muema et al., Reference Muema, Wakhungu, Hanotte and Jianlin2009; Rout et al., Reference Rout, Thangara, Mandal and Roy2012), overlapping generations, mixing of populations from different geographical locations and natural selection favouring heterozygotes or subdivision accompanied by genetic drift (Agha et al., Reference Agha, Pilla, Galal, Shaat, D'Andrea, Reale, Abdelsalam and Li2008). Similar results of high genetic diversity resulting from average expected heterozygosity (0.671 across loci, 10.7 alleles per locus) in Iranian goats accounting for the within-breed component (G ST = 5.9 percent) have recently been reported using microsatellite DNA markers (Vahidi et al., Reference Vahidi, Tarang, Naqvi, Falahati Anbaran, Boettcher, Joost, Colli, Garcia and Ajmone-Marsan2014). In addition, positive and highly significant F IS values in the Naini, Turki-Ghashghaei, Abadeh and Markhoz breeds indicate some level of inbreeding in these populations (Vahidi et al., Reference Vahidi, Tarang, Naqvi, Falahati Anbaran, Boettcher, Joost, Colli, Garcia and Ajmone-Marsan2014). Some studies indicate poor genetic diversity and low differentiation in Chinese domestic goat breeds (Li et al., Reference Li, Zhang, Chen, Zeng, Qiu and Liu1997; Jia et al., Reference Jia, Shi, Jian, Zhu, Zhang, He, Liao, Yu and Li1999; Li and Valentini, Reference Li and Valentini2004) in contrast to Nigerian goats.
Our results contrast somewhat with a recent study of HVR1 in Anatolian goats using 295 individuals that observed high genetic diversity values and a weak phylogeographical structure (Akis et al., Reference Akis, Oztabak, Mengi and Un2014), although it is consistent with overall findings of (Luikart et al., Reference Luikart, Giellly, Excoffier, Vigne, Bouuvet and Taberlet2001; Naderi et al., Reference Naderi, Rezaei, Taberlet, Zundelm, Rafat, Naghashm, el-Barody, Ertugrul and Pompanon2007). Recent re-analysis of a consensus fragment of 481 bp in the D-loop region from 339 individuals of indigenous Chinese goat mtDNA showed high diversity but poor geographic specificity (Zhao et al., Reference Zhao, Zhong, Wang, Li and Zhang2014), although the network and NJ tree revealed three divergent maternal haplogroups (A, B1 and B2) in 17 local breeds captured in 198 different haplotypes. The discrepancies between published reports can be partially explained to differences in methodologies the investigators used in those aforementioned reports (Liu et al., Reference Liu, Wu, Yao, Miao, Luikart, Baig, Beja-Pereira, Ding, Palanichamy and Zhang2006). The NJ tree placed Nigerian goats into two distinct breeds or groups; the Northern (SAH and RSO) and Southern (WAD). Generally, similar classifications based on microsatellite markers obtained in earlier studies (Okpeku et al., Reference Okpeku, Ozoje, Adebambo, Agaviezor, O'Neill and Imumorin2011a, Reference Okpeku, Yakubu, Peters, Ozoje, Ikeobi, Adebambo and Imumorin2011b) support our findings.
Within group variation was far higher and accounted for 77.25 percent of the genetic diversity observed in this study. High genetic diversity observed within breeds from mtDNA analysis can be attributed to maternal effect of multiple ancestors (Naderi et al., Reference Naderi, Rezaei, Taberlet, Zundelm, Rafat, Naghashm, el-Barody, Ertugrul and Pompanon2007; Rout et al., Reference Rout, Thangara, Mandal and Roy2012; Akis et al., Reference Akis, Oztabak, Mengi and Un2014). In an analysis involving 2 430 individuals from all over the world, Naderi et al. (Reference Naderi, Rezaei, Taberlet, Zundelm, Rafat, Naghashm, el-Barody, Ertugrul and Pompanon2007) also reported that 77 percent of mtDNA variation is distributed within breeds. Similarly, in Indian goats, 83 percent of the total molecular variance was observed in the within-breed component (Joshi et al., Reference Joshi, Rout, Mandal, Tyler-Smith, Singh and Thangaraj2004), and more than 75 percent of the variations in Anatolian goats have been found between haplotypes. The higher within-breed variation observed has favoured genetic exchange, as goats are portable food resources that often accompany humans through migratory movements and trade routes (Azor et al., Reference Azor, Monteagudo, Luque, Tejedor, Rodero, Sierra, Herrera, Rodero and Arruga2005; Amills et al., Reference Amills, Ramirez, Tomas, Badaoui, Marmi, Acosta, Sanchez and Capote2009; Liu et al., Reference Liu, Cao, Chen, Yao and Liu2009).
Mismatch distributions (pairwise comparisons) of mtDNA have also been widely used to explore demography (Rogers and Harpending, Reference Rogers and Harpending1992). In the present study, mismatch analysis was done to evaluate population expansion among the different breeds, vital for predicting breeds with more population growth potentials. Populations with a constant size usually demonstrate ragged multimodal distribution, whereas a smooth, unimodal distribution is observed in expanding populations. The match of a real data set to these models can be assessed by the “raggedness” (Joshi et al., Reference Joshi, Rout, Mandal, Tyler-Smith, Singh and Thangaraj2004). In this study, the WAD goat breed showed a higher raggedness in this regard while the Northern breeds showed more uniform curves. These differences suggest a greater population expansion in the Northern population (SAH and RSO) than in the South (WAD). This suggests that the Northern goat breeds may have demographic origins different from WAD. However, distinctive demarcation of the breeds could also be attributed to the high genetic diversity of mtDNA HVR1 sequences. High polymorphic sites, singleton variable sites and nucleotide diversity were found in WAD, indicating that WAD exhibited the highest genetic diversity potentially more useful for selection. The higher genetic diversity of HVR1 in WAD may be related to its extensive adaptability and survival across the Southern Nigeria. In terms of nucleotide and haplotype diversities, SAH and WAD showed high values compared with other goat breeds worldwide (Luikart et al., Reference Luikart, Giellly, Excoffier, Vigne, Bouuvet and Taberlet2001; Pereira et al., Reference Pereira, Pereira, Van Asch, Bradley and Amorim2005; Naderi et al., Reference Naderi, Rezaei, Taberlet, Zundelm, Rafat, Naghashm, el-Barody, Ertugrul and Pompanon2007). Higher non-synonymous nucleotide diversity relative to synonymous nucleotide diversity in WAD and RSO may be due to direct selection and a ratio of dN/dS greater than 1 suggests that variation at the mtDNA HVR1 is under positive selection (Kryazhimskiy and Plotkin, Reference Kryazhimskiy and Plotkin2008).
In conclusion, a clear genetic structure was found among Nigerian goat breeds with appreciable variation in mtDNA HVR1 region. This study grouped Nigerian goat breeds into two major groups with higher within-breed variation than variation among breeds. Results suggest two different demographic origins for northern and southern breeds within goat populations in Nigerian. The present study suggests a high degree of genetic admixing among Nigerian goats arising from possibly different maternal origins, which is in contrast to evidence from goats in the Levant and Central Asia, where goats where originally domesticated.
Acknowledgements
We thank the International Foundation for Science (IFS), Stockholm, Sweden and the Indian Government through the Indian National Science Academy Junior Research Development Tata fellowship for financial support to Moses Okpeku. Additional support from the College of Agriculture and Life Sciences, Cornell University, Ithaca, NY is gratefully acknowledged.
Statement of interest
The authors declare that we do not have any conflicting interest during and after this research.